
Usman Khan
Product Manager

Jana Zweigoron
Product Marketing Manager

Gayatri Ramesh
Senior Product Manager
Moving your logs to a new platform is only part of a migration. Over the years, your teams have built saved searches, alerts, and dashboards in Splunk’s Search Processing Language (SPL). These assets capture which errors matter, which conditions trigger paging alerts, and which views an on-call engineer opens first. Rebuilding that library by hand is slow and error-prone, typically requiring you to inventory every asset, learn a new query syntax, rewrite each search, and manually confirm that the results match. This work can be complex and time-consuming even for experienced users, and often delays or blocks a migration entirely.
Datadog’s in-app migration tools, Translate and Import, help you recreate your SPL queries, alerts, and dashboards in Datadog without rewriting them from scratch. In this post, we’ll show how you can:
Translate and validate individual SPL queries
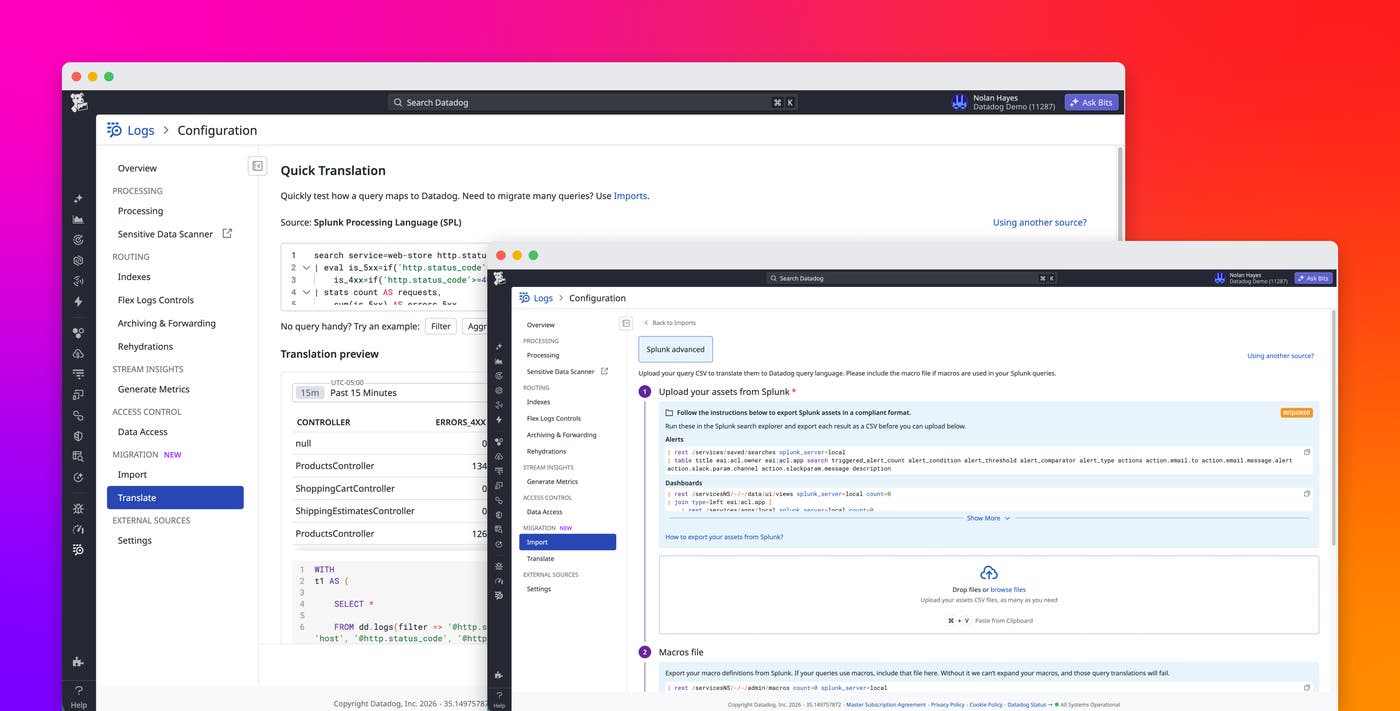
Datadog’s Translate tool converts individual SPL queries into Datadog log searches and lets you validate the results against your own logs. Suppose you run an ecommerce platform and want to confirm that your critical observability workflows and assets will carry over to Datadog. One of the assets is a storefront health scorecard that tracks request counts, error rates, and latency across different endpoints. The underlying query that powers the scorecard combines search filters, conditional evaluations, aggregations, and commands to filter and sort the results:
search service=web-store http.status_code=* NOT http.url_details.path="/_health"| eval is_5xx=if('http.status_code'>=500, 1, 0), is_4xx=if('http.status_code'>=400 AND 'http.status_code'<500, 1, 0)| stats count AS requests, sum(is_5xx) AS errors_5xx, sum(is_4xx) AS errors_4xx, avg(duration) AS avg_ms, perc95(duration) AS p95_ms, max(duration) AS max_ms, dc(host) AS hosts BY controller, http.url_details.path| eval error_rate_pct=round((errors_5xx / requests) * 100, 2), avg_ms=round(avg_ms, 1), p95_ms=round(p95_ms, 1)| where requests > 100| sort - error_rate_pct| head 10In Datadog Log Management, open Translate and paste the query. Alongside the translation, you get:
A step-by-step explanation that maps each part of the SPL pipeline to its Datadog equivalent, so you can learn the new syntax as you go
Live results from your own logs, so you can check that the output matches what you saw in Splunk
Quick actions, such as opening the search in the Log Explorer or creating a monitor from it
Because the results come from your live data, you can spot problems right away. For example, if a field is named differently in Datadog than it was in Splunk, the results show you before you’ve built anything on top of the query.
Import alerts and dashboards in bulk
While you can use Translate to convert and validate individual SPL queries, Import enables you to translate alerts and dashboards in bulk. Import saves you from having to translate hundreds of assets separately and reduces the risk of overlooking one that matters.
In Log Management, open Import and follow the in-app instructions to export your saved searches, alerts, and dashboards from Splunk. You don’t need to install anything in your Splunk environment. Then drag the export file into Datadog.
Datadog translates each asset into its Datadog equivalent:
Splunk alerts become Datadog monitors, with the translated query and the original trigger conditions.
Splunk dashboards become Datadog dashboards, translated widget by widget.
Datadog keeps translated monitors and dashboard definitions as drafts until you’re ready to publish the assets. You can open any translated monitor or dashboard, compare it with the SPL that it came from, and check its results against your data. When you have verified the translation, publish it to make it available to your team. Publishing creates standard Datadog monitors and dashboards, so you can manage them the same way as any others, including through the API and Terraform.
In early access, one design partner translated 62 of 62 queries from a batch in a single bulk run. Another team uploaded more than 1,500 alerts at once with help from Datadog Implementation Services on the first pass.
Track your migration over time
A large migration happens in waves: one team, one Splunk app, or one set of critical alerts at a time. Import keeps every upload in a single inventory, so you can see the migration status of each asset without keeping a separate spreadsheet.
For each import, you can see which assets were translated, which were skipped, and which you’ve already published. You can filter by asset type or status to focus on what still needs work.
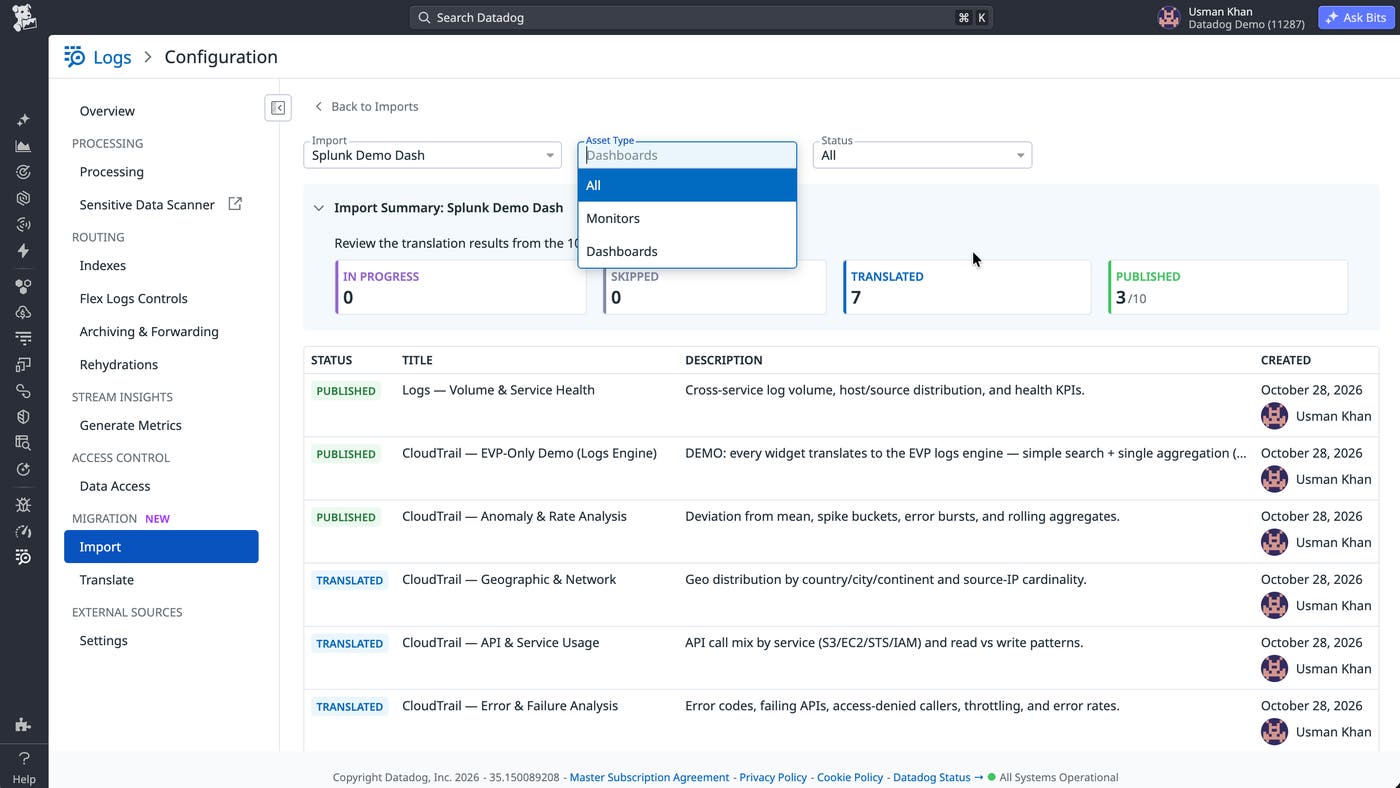
When Datadog can’t translate an asset reliably, it marks the asset as skipped instead of publishing a monitor or widget that might return the wrong results. Assets are usually skipped for a few reasons, such as an SPL command that the tools don’t support yet or a dashboard that depends on Splunk-specific features like summary indexes. You can adjust the SPL and import those assets again, finish the query in Translate, or ask Bits AI to help rewrite it.
Simplify searches with native Datadog features
Translating your existing assets gets your teams working in Datadog quickly. A migration is also a good time to simplify searches that grew in size, scope, and complexity. Several SPL patterns have a more direct equivalent in Datadog:
Search-time field extraction with
rex: Use Tap to Parse to turn values buried in a log message into structured fields in one click, without writing a regular expression.Lookups and subsearches: Use subqueries and Reference Table joins to filter or enrich logs with related events or external metadata, including in log monitors.
Scheduled searches that send results via email: Use scheduled CSV reports to deliver Log Explorer results to email or Slack on a recurring schedule.
Long, multi-stage pipelines: Use Notebooks analysis cells to chain transformations or write SQL when a single log search isn’t enough.
Start migrating your Splunk assets to Datadog
Translate and Import are generally available to Log Management customers in all Datadog sites except US1-FED, at no additional cost. You can check queries against your own logs, translate your full library in bulk, and publish each asset individually or all at once when you’re ready. To get started, see the Query Translation migration documentation. If you’re planning a large migration, your Datadog account team can help.
If you’re new to Datadog, you can sign up for a 14-day free trial to start using Translate and Import.
