
Nicolas Jung
Product Manager

Jana Zweigoron
Product Marketing Manager
Logs are easiest to investigate when the values that matter are already captured as attributes. When those values are buried in a log message, even a straightforward question such as filtering on a status code, graphing the duration of a request, or following a unique transaction across a set of logs requires writing complex regular expressions or Grok patterns.
Restructuring logs at the source is not always practical because they might come from a service that you don’t own, a legacy application that is difficult to change, or a third-party system with a fixed format. Writing and validating the parsing logic yourself takes time, and waiting for help from someone who has specialized knowledge of the log format and parsing syntax can slow the investigation even more.
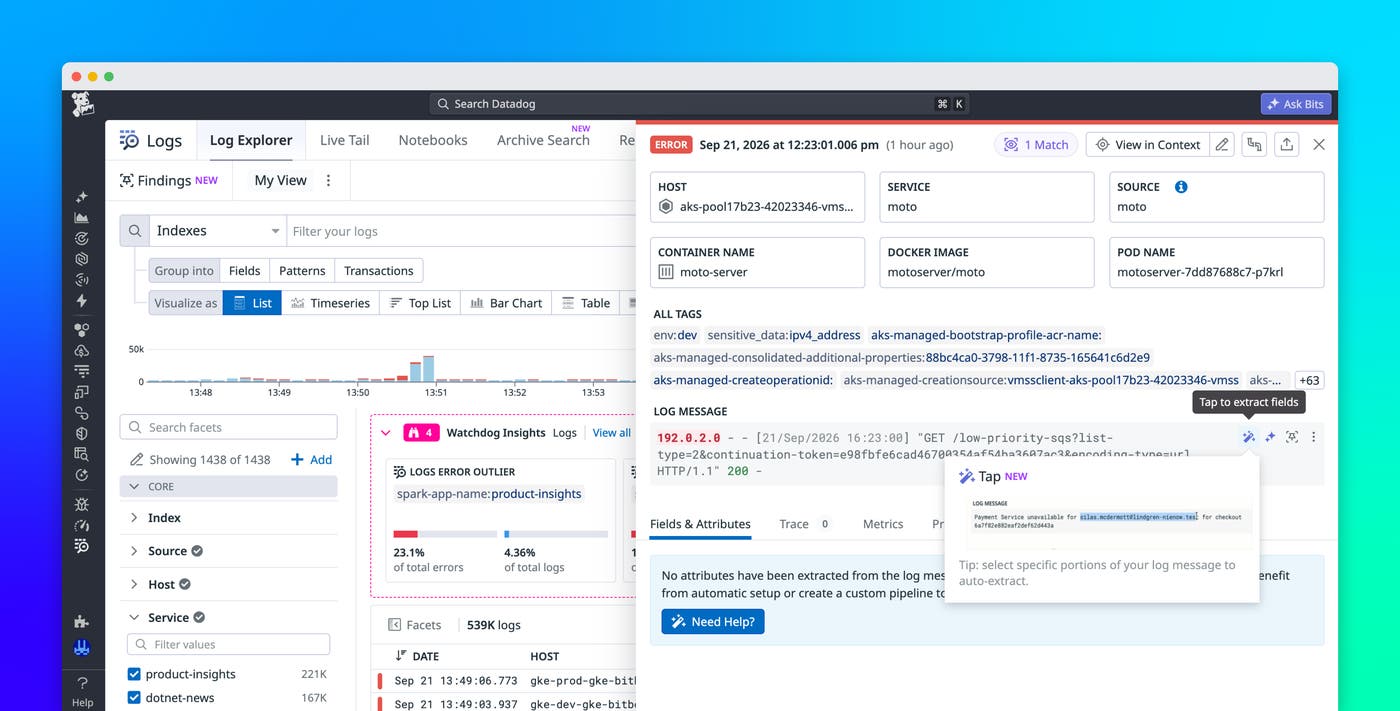
With Datadog’s Tap to Parse, you can turn the information buried in a log message into structured, searchable data in one click, without writing a parsing rule by hand. Tap to Parse is an AI-assisted capability that analyzes sample logs to identify their stable structure, distinguish fields from variable values, and generate a parser that you can review before applying it. You can use Tap to Parse across the log life cycle: at query time in the Log Explorer, at ingestion in Log Pipelines, and before logs leave your environment in Observability Pipelines.
In this post, we’ll show how you can:
Make useful attributes available on future logs with Log Pipelines
Keep logs structured across destinations with Observability Pipelines
Extract values while you investigate in the Log Explorer
Suppose you receive an alert that the error rate for your checkout API is higher than usual. You open the Log Explorer to investigate, filter on error logs, and find that your log messages look like this:
Payment authorization for order 87421 through BlueOakPay failed after 1842 ms: upstream timeout (code 91)
The message contains useful information, but values such as the payment provider, duration, and error code are not available as attributes. You suspect that one of your payment providers might be causing the errors, but you can’t filter or group the logs by provider to confirm it.
To make the payment provider and other values in the checkout logs available for analysis, you can select one of the log events and click Tap to Parse. Datadog automatically generates a parsing rule and previews structured fields such as payment_provider, duration_ms, and error_message. After you apply the rule, those calculated fields become available across similar logs in your current session.
With payment_provider available as a calculated field, you can group the error logs by payment provider. In this example, the aggregation shows that nearly all the errors are associated with BlueOakPay. You can select the BlueOakPay group and open its log events to continue investigating the provider-specific failures.
Make useful attributes available on future logs with Log Pipelines
The calculated fields that you create in the Log Explorer help you answer the immediate question, but they apply only to your current session. If attributes such as the payment provider remain useful after the incident, you can extract them from future logs with a Grok Parser in Log Pipelines.
When you create a Grok Parser in Log Pipelines, Datadog loads samples from logs that match the pipeline filter. You can then click Tap to Parse to generate a Grok rule that extracts the provider, duration, and error code. After you save the processor, Datadog applies the rule to future logs processed by that pipeline.
When you return to the Log Explorer in the checkout example, newly ingested events contain the extracted values as structured attributes. You can group the logs by payment provider, inspect the events associated with any payment provider, and use the same attribute in future searches, dashboards, and monitors.
Keep logs structured across destinations with Observability Pipelines
Many organizations send the same logs to more than one destination. Operational teams might analyze them in Datadog while security or compliance teams retain a copy in a data lake, archive, or SIEM. If each destination parses the messages independently, the same work is repeated and the resulting attributes can differ.
In Observability Pipelines, Tap to Parse helps you structure custom log streams before they leave your environment. The resulting attributes travel with the events sent to each destination, providing a consistent starting point for search and analysis.
For the checkout logs from our payment investigation example, you can extract the payment provider, duration, and error message once, then send the structured events directly to your long-term storage.
Start finding answers in logs faster with Tap to Parse
Tap to Parse helps you extract useful fields from unstructured logs without writing parsing rules by hand. You can use it during investigations in the Log Explorer, for future logs in Log Pipelines, and before logs leave your environment in Observability Pipelines.
Tap to Parse is generally available in the Log Explorer and in Log Pipelines, and available upon request in Observability Pipelines. To get started, see the calculated fields documentation for the Log Explorer, the Grok Parser documentation for Log Pipelines, and the Observability Pipelines documentation.
If you’re new to Datadog, you can sign up for a 14-day free trial to start using Tap to Parse.
