
Eric Metaj
Product Marketing Manager

Sarah Stonehill
Product Manager
Some production bugs don’t show up clearly in logs or traces, and they often cannot be reproduced in a local or staging environment. When developers need more runtime detail, they typically fall back on a familiar but slow workflow: add log lines, open a pull request, wait for review and CI/CD, deploy the change, and wait for the issue to happen again. If the new logs don’t capture the right variable values or execution path, the loop starts over.
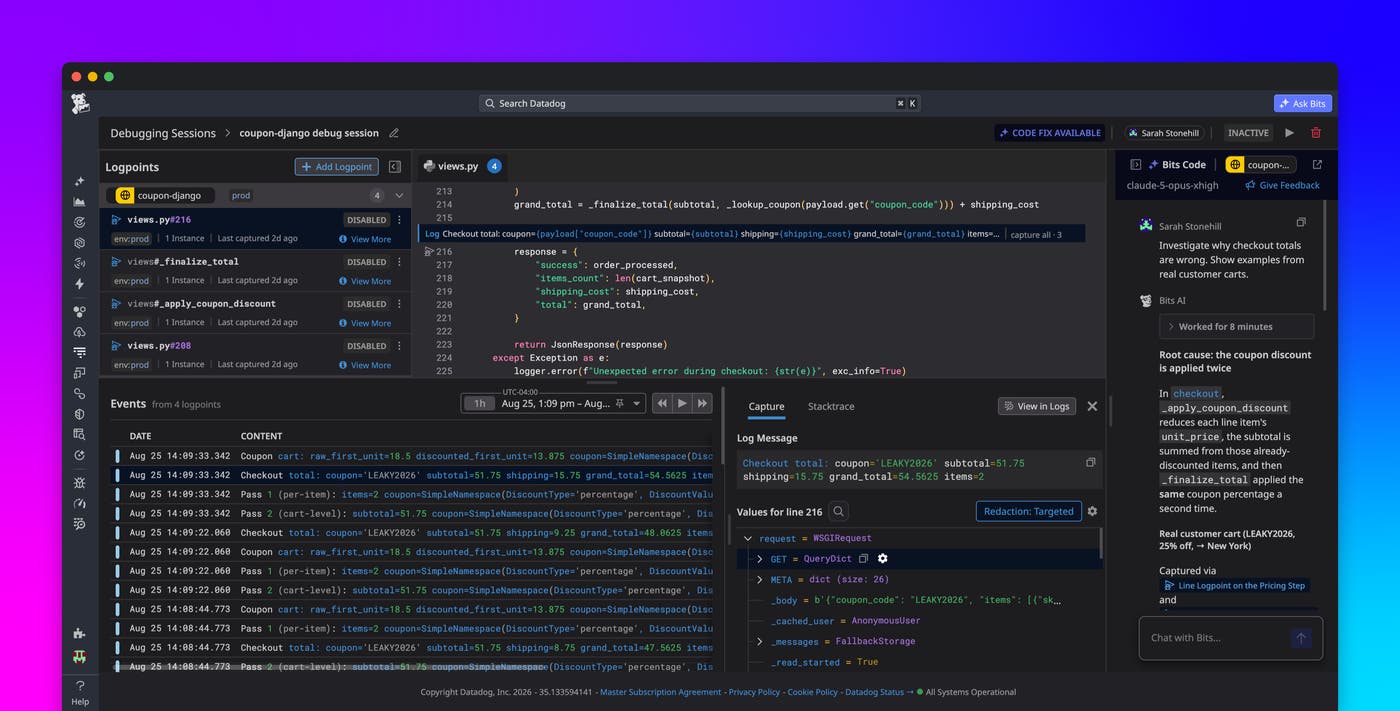
With Live Debugger, teams can investigate running services without changing or redeploying code. This means you can debug directly in production without getting stuck in a redeployment loop. For an even faster debugging workflow, you can describe the issue in plain language, and Bits AI can analyze your linked source code, place non-breaking logpoints, retrieve variable snapshots, interpret the results, and suggest a code fix based on the production data it collected.
In this post, we’ll show how Live Debugger helps you:
Debug code running in production without redeploying
As a developer, you care most about finding where an error is happening and getting the data that produces a fix. That usually requires digging into a running production service you can’t touch, either because every new log line costs a full deploy cycle or because security and compliance posture keeps it closed.
Live Debugger collects data straight from your running application without requiring a restart, redeploy, or code change. Instead of adding temporary instrumentation to your application, you place logpoints on running services that capture diagnostic data while the application continues executing, so you can investigate issues as they happen and skip the rebuild and redeploy loop entirely.
You can inspect variable values, method arguments, and execution context at multiple points in your code as it runs, which lets you follow a request through the path it actually took. Because logpoints attach to the running service rather than to your source, you can reach any line you need, including code inside third-party libraries you don’t control. That matters for the bugs that only appear under production-only conditions, such as a specific request shape, customer configuration, data state, feature flag, or downstream dependency response. When a bug depends on one of those conditions, reproducing it locally can take longer than the fix itself.
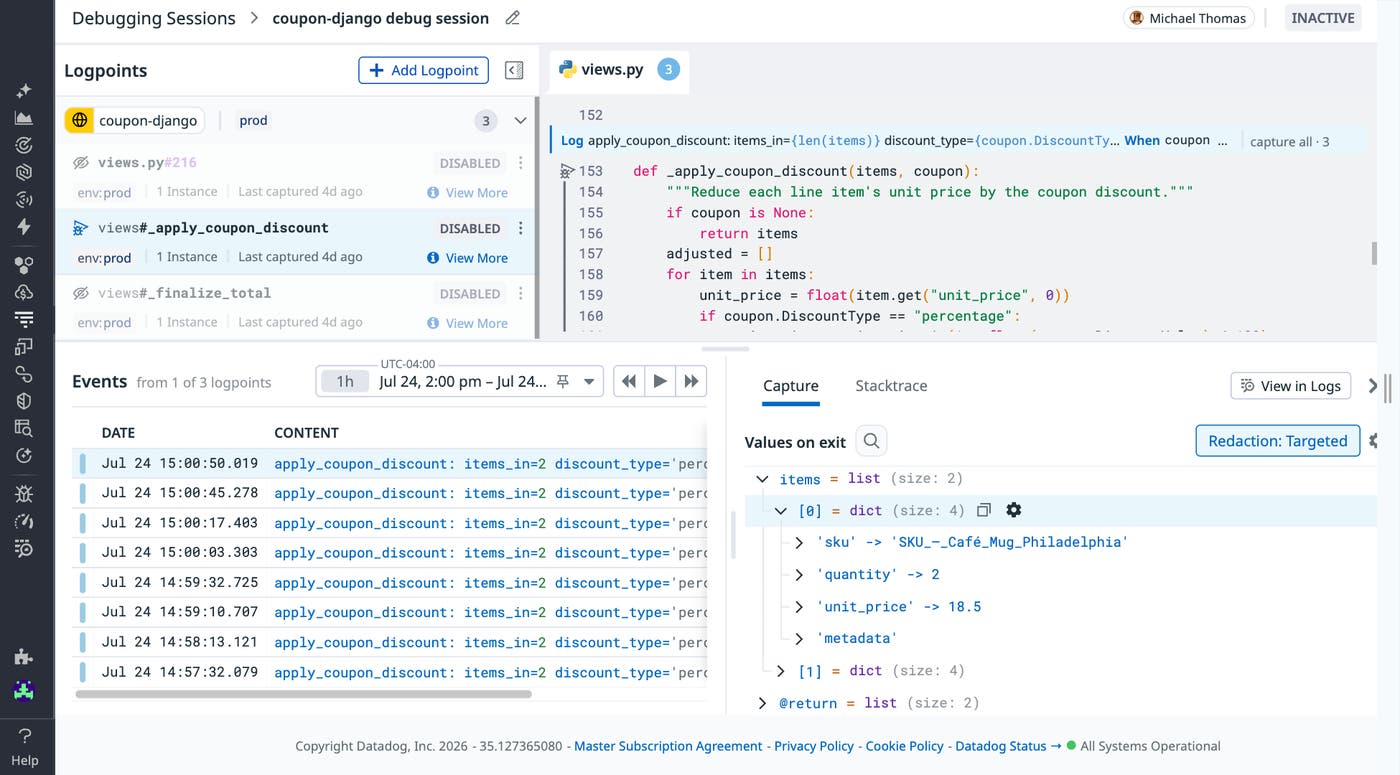
These controls also make live debugging viable for teams whose security or compliance posture has kept production access closed. Built-in scrubbing redacts sensitive data before it leaves the host, and you can configure Sensitive Data Scanner to further identify and redact sensitive values based on regular expressions. Live Debugger also maintains an audit trail of debugging activity, while debug sessions and logpoints expire automatically.
Understand how your system really behaves
The bugs that cost you the most almost never raise an error. Logs and traces capture only what someone instrumented ahead of time, so when a failure falls outside that original instrumentation, you’re left reasoning about it from irrelevant data.
With Live Debugger, captures happen live inside the running service, so the resulting logs and snapshots reflect the real inputs and outputs moving through your application rather than an inference drawn from historical data. You can see why a branch was taken, whether a variable held an unexpected value, or how an input changed shape before it reached a failing function.
Because you choose the exact code locations, you collect targeted data at the point where you need answers instead of widening instrumentation across the whole service and sorting through the result. You can also set conditions on a logpoint so Datadog captures data only when a specific condition is met, which gives you the one case you care about: the single customer ID that reproduces the bug, the request that carries a malformed coupon, or the retry that lands in the wrong branch. This is how you find the silent bugs that never appear in your logs or traces at all.
The same targeting keeps the cost of visibility proportional to the problem. Data capture starts only when an active debug session runs on a service, and logpoints expire after a set period while conditions narrow captures to the cases that matter. You get the runtime detail you need in the middle of an incident without running continuous, granular instrumentation across every service.
Ground your coding agents in real production data
The hardest bugs fall to your most experienced engineers, and every round of hypotheses costs them another set of log lines, reviews, and deploys. Coding agents could take some of that work off their hands, but not while they’re guessing at what production is doing.
Coding agents can read your source code, but they can’t see what’s happening inside a running production service, so they propose fixes from static analysis alone. Live Debugger closes that gap by enabling you to describe an issue in plain language, select the target service and environment, and let the agent run the investigation on your live code. For example, you might ask, “Why are checkout prices with coupons incorrect? Show evidence.”
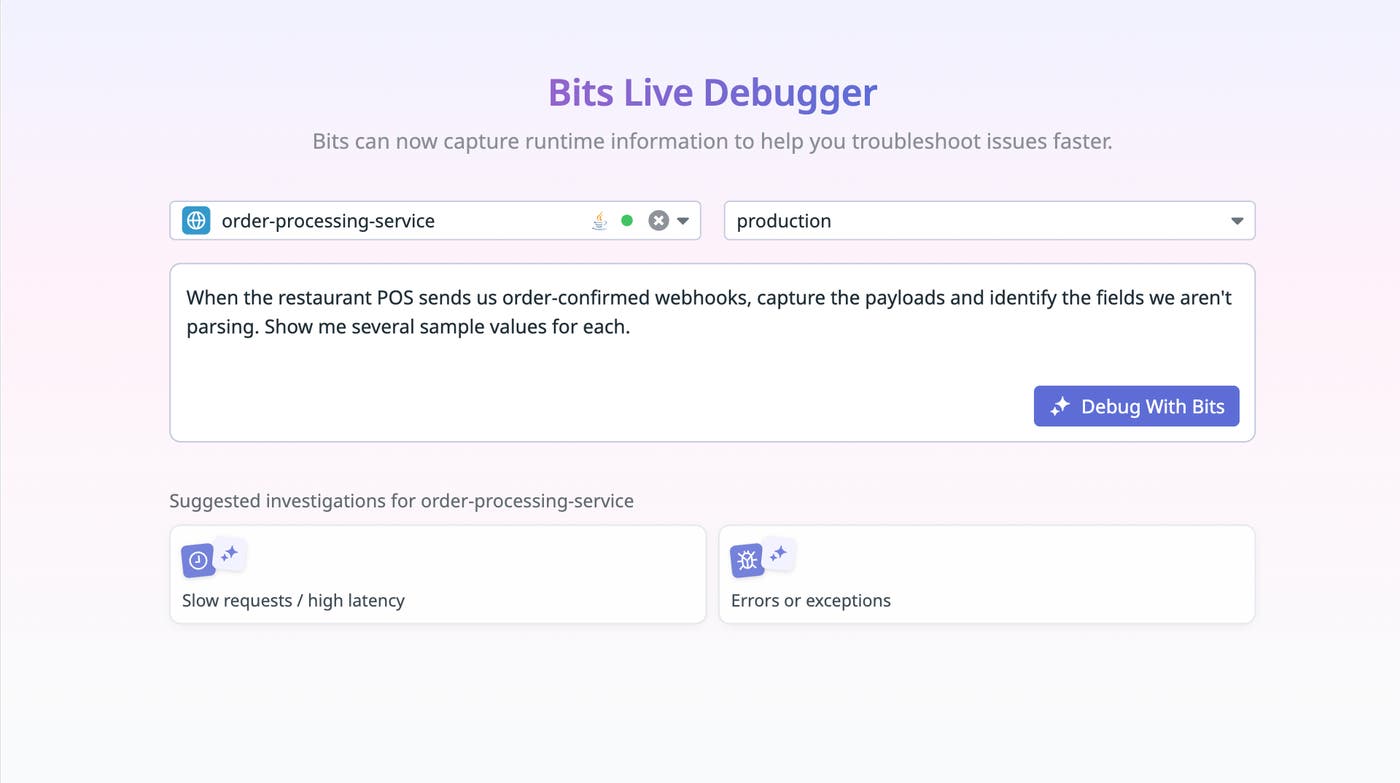
Bits AI uses your linked source code to identify the most relevant code locations. It then places logpoints across them, collects variable snapshots from the running service, and interprets what comes back. This is especially useful when a bug has several plausible causes. A developer would test those hypotheses one at a time, adding and moving log lines through a full review-and-deploy cycle for each round. Bits AI investigates many possible causes at once by instrumenting the relevant code paths in parallel and comparing the evidence, which brings you to a root cause in minutes.
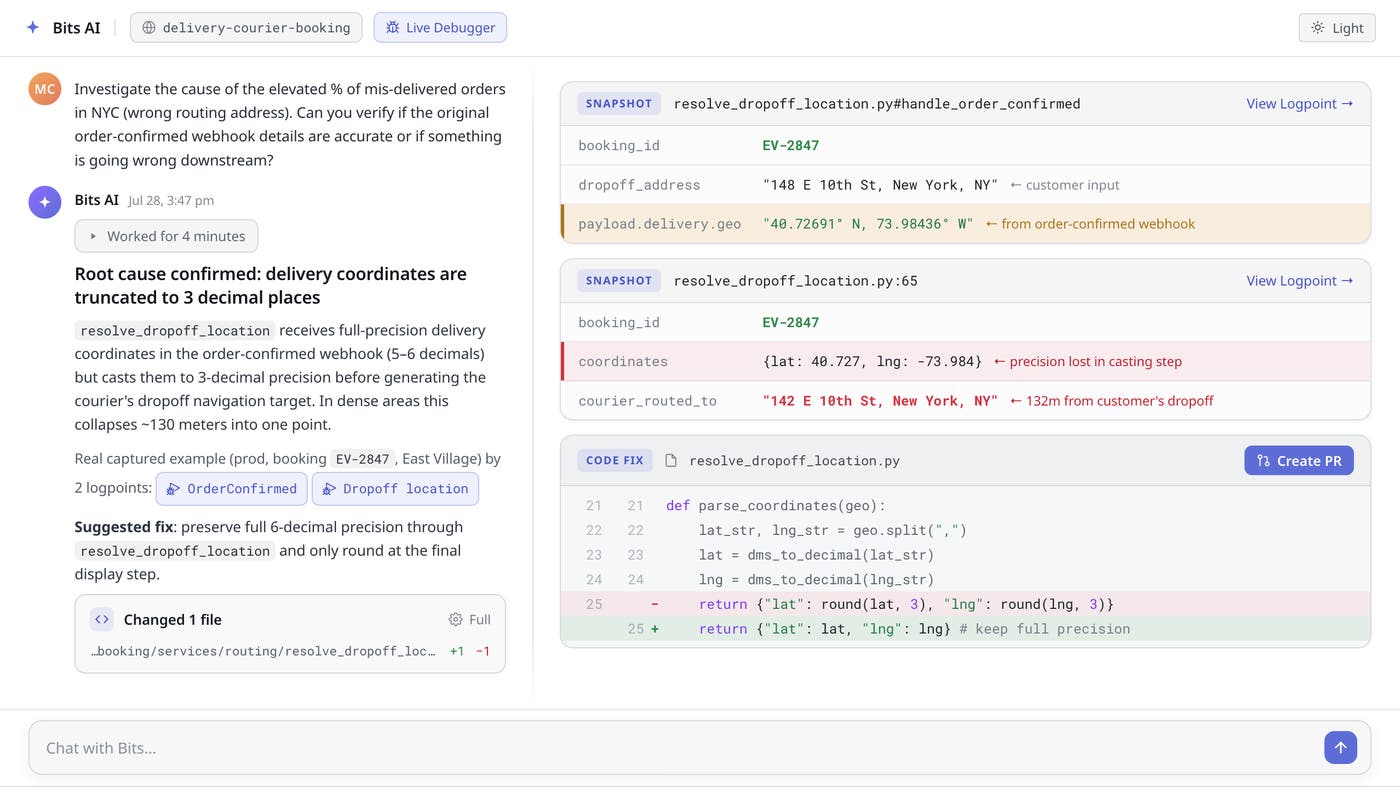
From there, the investigation turns into a ready-to-apply code fix backed by the production behavior the agent observed. The captured evidence travels with the change, so reviewers can see why the fix addresses the bug rather than taking the diff on faith.
Resolve hard production bugs with Live Debugger
Live Debugger helps developers move beyond the slow cycle of adding logs, deploying code, and waiting for a bug to recur. By combining Live Debugger with Bits AI, Datadog can inspect running services, collect real-time runtime evidence, test multiple hypotheses, and propose a fix without requiring a code change or redeployment. The same workflow that is available in the Datadog UI will also soon be available through the Datadog MCP Server, so developers can investigate from the place where they already work.
To get started, sign up for the Bits Live Debugger Preview. You can learn more about using AI with Live Debugger by reading the Bits Live Debugger documentation and the Datadog MCP Server documentation. If you’re new to Datadog, you can sign up for a 14-day free trial to start debugging production issues today.
