
Dan Green
Senior Product Manager

Kai Xin Tai

Brianne Bujnowski
Senior Product Marketing Manager
When we announced Bits Investigation at DASH 2025, we introduced an autonomous SRE agent that investigates alerts the moment they trigger. Bits Investigation reads the same telemetry data as your team, understands your architecture, and follows your runbooks to identify likely root causes before you even open your laptop. It’s your AI teammate that’s always on call.
Now, we’re announcing the next generation of Bits Investigation. It features a faster, more intelligent agent with broader data access and new triage and remediation capabilities. Together, these advancements enable Bits to navigate complex observability environments more effectively, reason across dependencies, and integrate with your existing workflows and tools. The result is an agent that’s more accurate on internal benchmarks and approximately twice as fast.
In this post, we’ll explore how the latest updates to Bits Investigation enable you to:
Troubleshoot your full stack with expanded Datadog data sources
Triage issues and assign them to the right team directly from chat
Accelerate investigations for complex scenarios
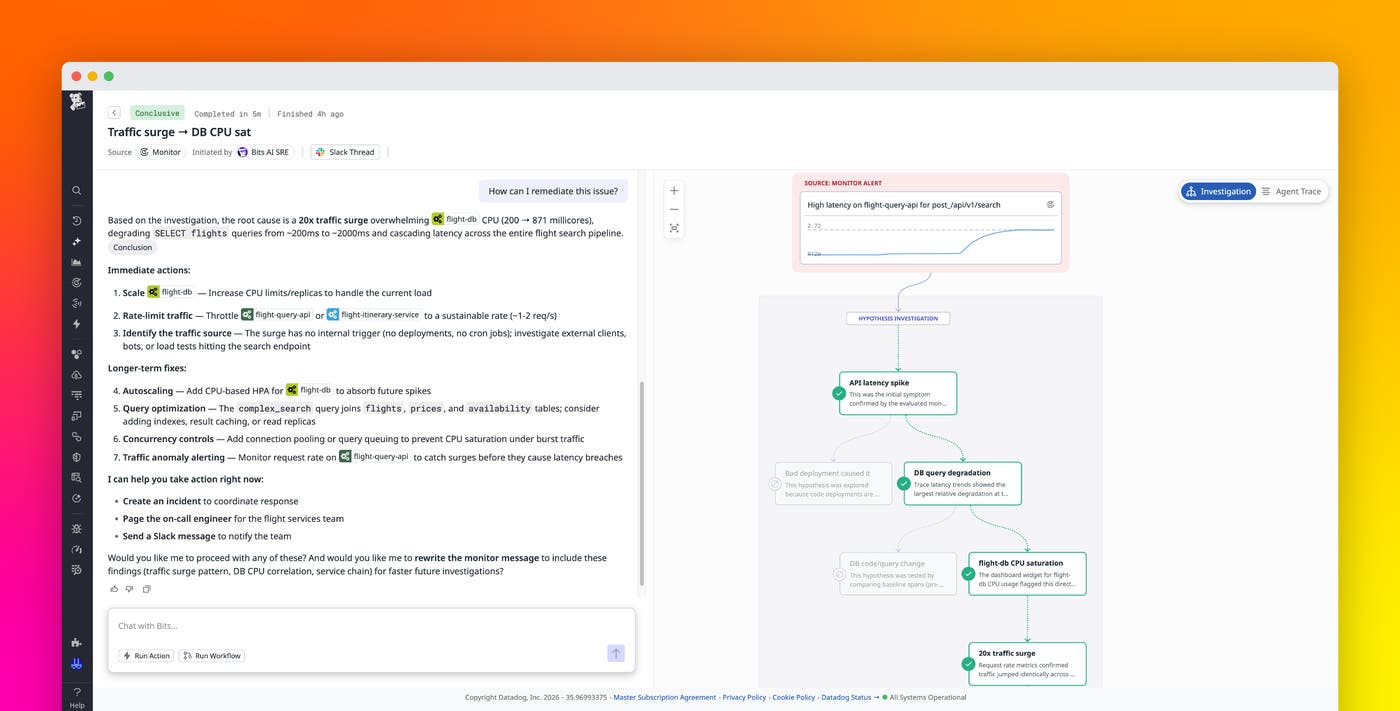
Bits Investigation has a new agent harness (the orchestration layer that manages long-running tasks) and tighter integration with MCP-powered tools. As a result, the agent can plan investigations, evaluate competing hypotheses for root causes, and refine its investigations in real time. Bits Investigation can complete investigations about 2 times faster than before—in approximately 3-4 minutes, depending on complexity.
Bits Investigation can also determine the root cause of system-wide alerts that involve multiple dependencies, including scenarios that were previously out of reach. For example, consider an alert triggered by an increasing message-processing lag in a data pipeline. The Bits Investigation agent first detects from logs that similar alerts had been firing in the days leading up to the incident. Instead of limiting its analysis to a single spike, the agent automatically expands the time range of its metric queries and uncovers a sustained, multi-day increase in lag.
From there, the agent traces the issue to Kubernetes pods that had gone offline and failed to restart due to a configuration error. The root cause would have remained hidden if Bits Investigation hadn’t broadened the scope of analysis and correlated signals across logs, metrics, and infrastructure state.
Troubleshoot your full stack with expanded Datadog data sources
Bits Investigation now has access to a broader set of Datadog data sources, enabling more comprehensive investigations. In addition to metrics, logs, traces, dashboards, and changes, Bits can now analyze source code, events, and data from Real User Monitoring (RUM), Database Monitoring, Network Path, and Continuous Profiler.
Expanded visibility enables Bits Investigation to correlate signals across the full stack. An alert for elevated latency in an API can now be traced through user sessions, backend service dependencies, database queries, and network paths. Instead of analyzing each layer in isolation, the Bits Investigation agent evaluates how user experience, infrastructure performance, and application behavior interact.
With access to cross-domain telemetry data, Bits Investigation can uncover failure modes that span services, user experience, databases, and network layers. This holistic analysis makes it possible to identify root causes in distributed production systems where symptoms appear far from the originating issue.
Understand agent reasoning with the Agent Trace view
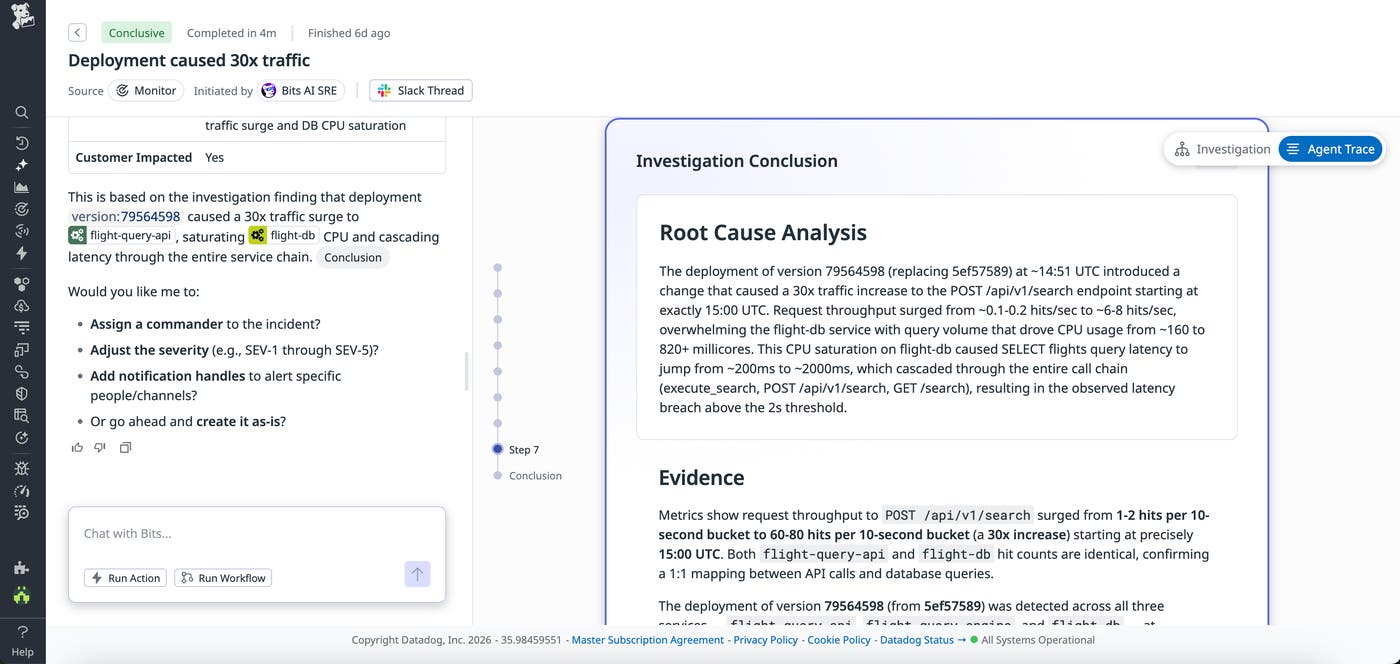
You can now see exactly how a Bits investigation unfolded by using the Agent Trace view. Alongside the existing hypothesis tree, the agent trace presents each step that the Bits Investigation agent took, including the tools it called, the data it queried, and the intermediate analysis it produced.
The Agent Trace view gives teams visibility into how the Bits Investigation agent arrived at its conclusions. You can validate the approach, inspect how hypotheses were formed and eliminated, and diagnose situations where results differ from expectations. For teams that operate in regulated or high-risk environments, this transparency supports internal review processes and builds confidence in autonomous investigations.
Triage issues and assign them to the right team directly from chat
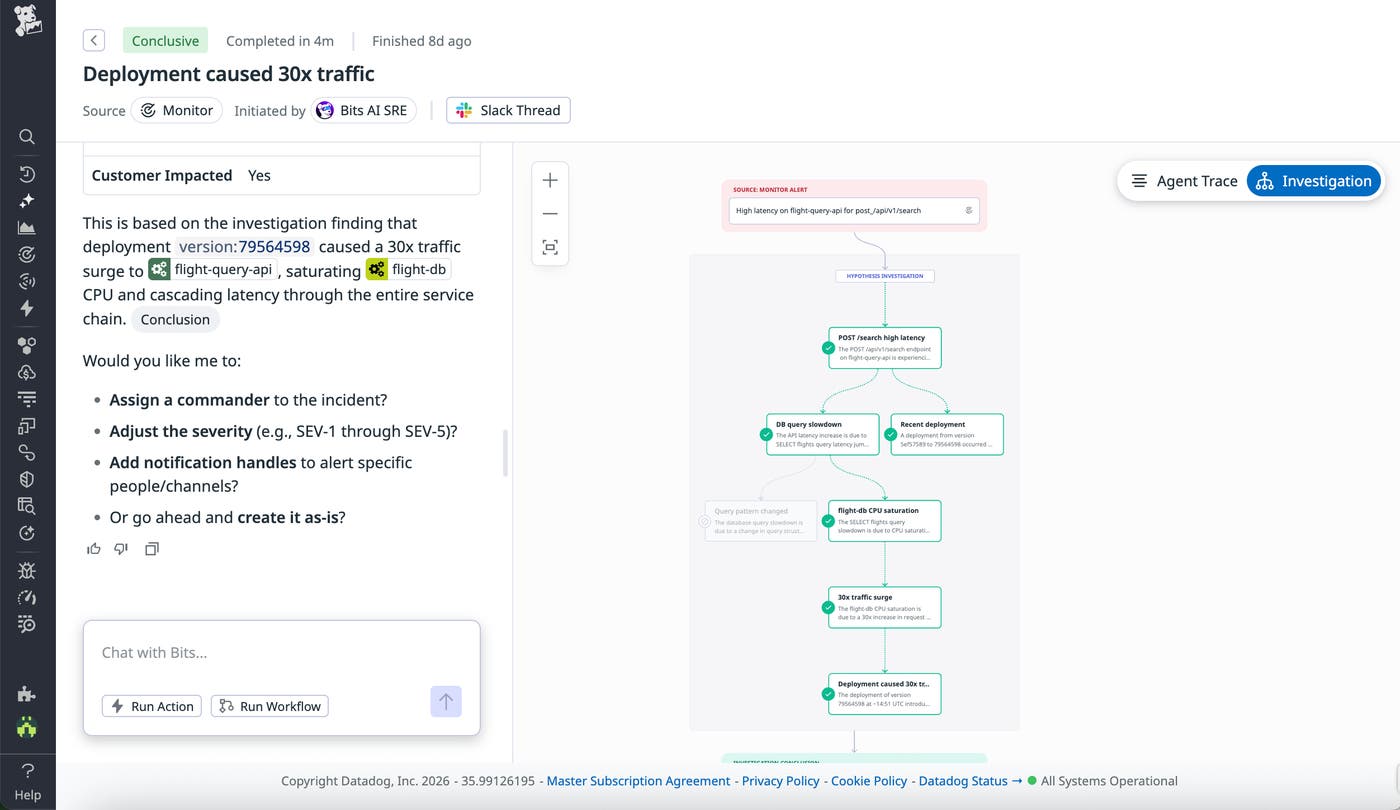
Investigations often stall at the handoff stage, when context must be copied into tickets, chat messages, or incident tools. Bits Investigation now supports direct, human-in-the-loop triage actions from within the chatbot experience. Responders can review conclusions, make decisions, and trigger follow-up actions directly in chat without copying findings into external tools.
The Bits Investigation chatbot can execute seven triage actions, including sending Slack and Microsoft Teams messages, creating incidents and paging appropriate engineers through Datadog Incident Response, creating cases in Datadog Case Management, and generating Jira tickets.
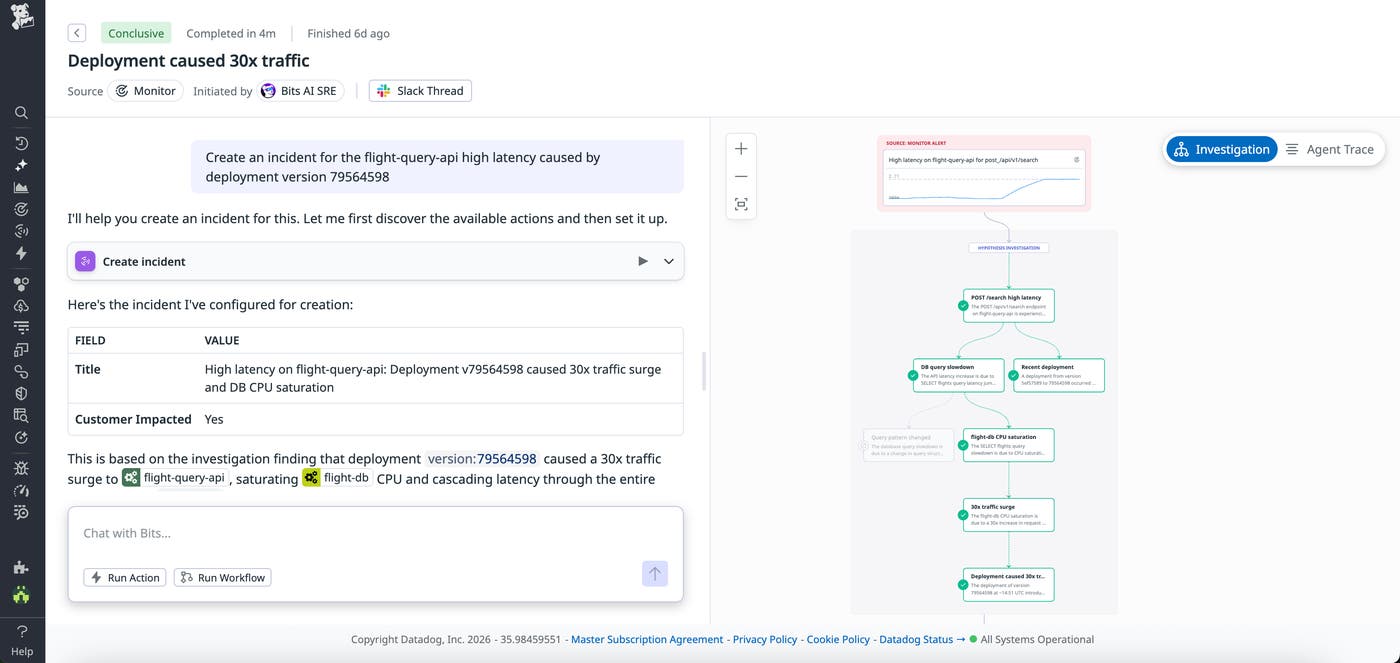
Bits Investigation automatically pulls relevant context from the investigation and your integrations to prefill messages, incident details, and ticket metadata. That context includes affected services, suspected root causes, relevant dashboards, and supporting telemetry data. By moving from investigation to coordinated response within the same interface, teams reduce context switching and shorten their time to action.
Integrate Bits into your existing automations and workflows
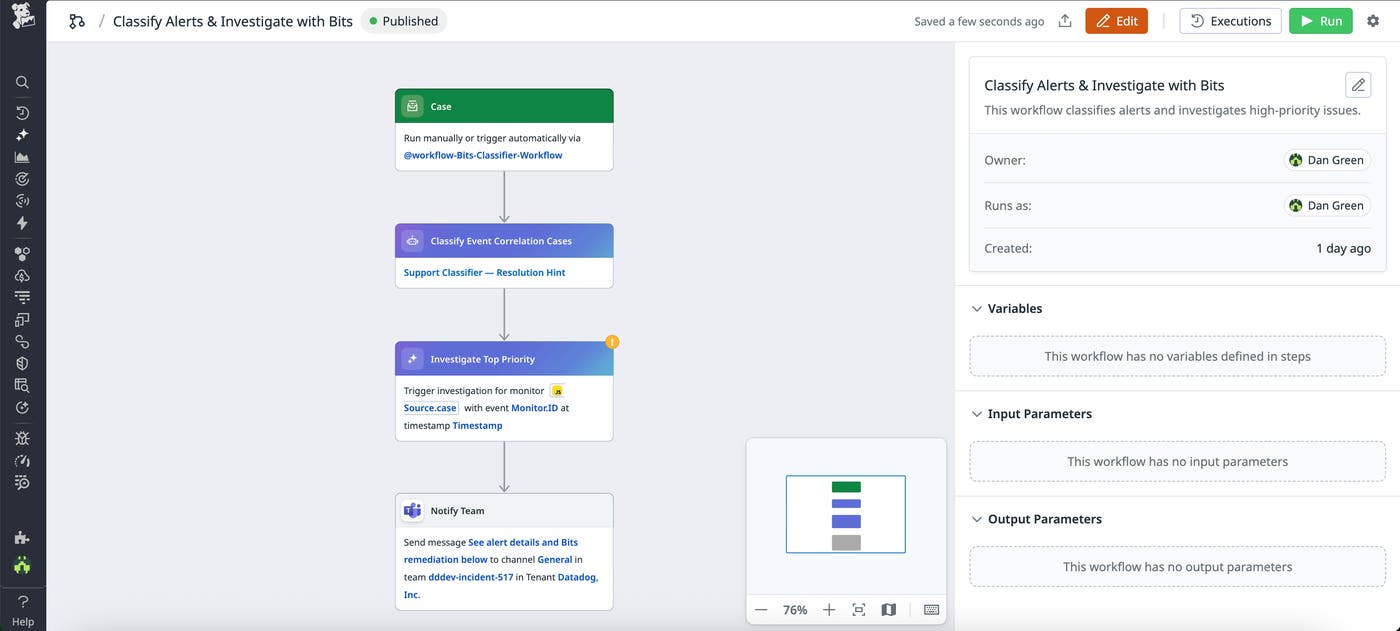
Bits Investigation can now initiate automated remediation within the Datadog platform. Three new Bits Investigation actions are available in the Datadog Action Catalog: Trigger Investigation, Get Investigation, and List Investigation.
These actions make investigations directly usable within workflows, custom agents, and apps. You can begin a new investigation (Trigger Investigation), retrieve and inspect its findings (Get Investigation and List Investigation), and then carry out follow-up steps such as pages, ticket creation, rollbacks, and other remediation workflows.
Sign up for new capabilities in Preview
We’re continuing to expand Bits Investigation and have several new features in Preview, including:
Third-party integrations with tools such as GitHub, ServiceNow, Grafana, Splunk, Dynatrace, and Sentry to pull in telemetry data for root cause analysis
The ability to prompt Bits Investigation to run an investigation without requiring a triggered monitor
A new configuration file named bits.md that you can tailor with team knowledge to instruct Bits Investigation on how to troubleshoot your specific environment
An API to integrate Bits Investigation with your internal tooling and agents
To get early access and provide feedback before general availability, complete the Preview sign-up form. Early feedback helps shape how Bits Investigationoperates.
Accelerate incident response and enhance system reliability with Bits Investigation
The latest updates to Bits Investigation expand its reasoning depth, broaden its data access, and integrate investigations more tightly with triage and automation. With these new capabilities, Bits Investigation can analyze complex, multi-service alerts and help teams resolve issues faster. To learn more, check out the Bits Investigation documentation.
If you’re new to Datadog, you can sign up for a 14-day free trial to get started.
