
Adam Virani
Product Marketing Manager

Sharon Ye
Senior Product Manager
A funnel can tell you that 40% of users dropped off between checkout and payment. What it can’t tell you is what those users did instead, such as return to an earlier form field, leave the flow for a support page, encounter an error, or take another route entirely. Because actions and views between funnel steps don’t affect the conversion calculation, two very different experiences can produce the same funnel result.
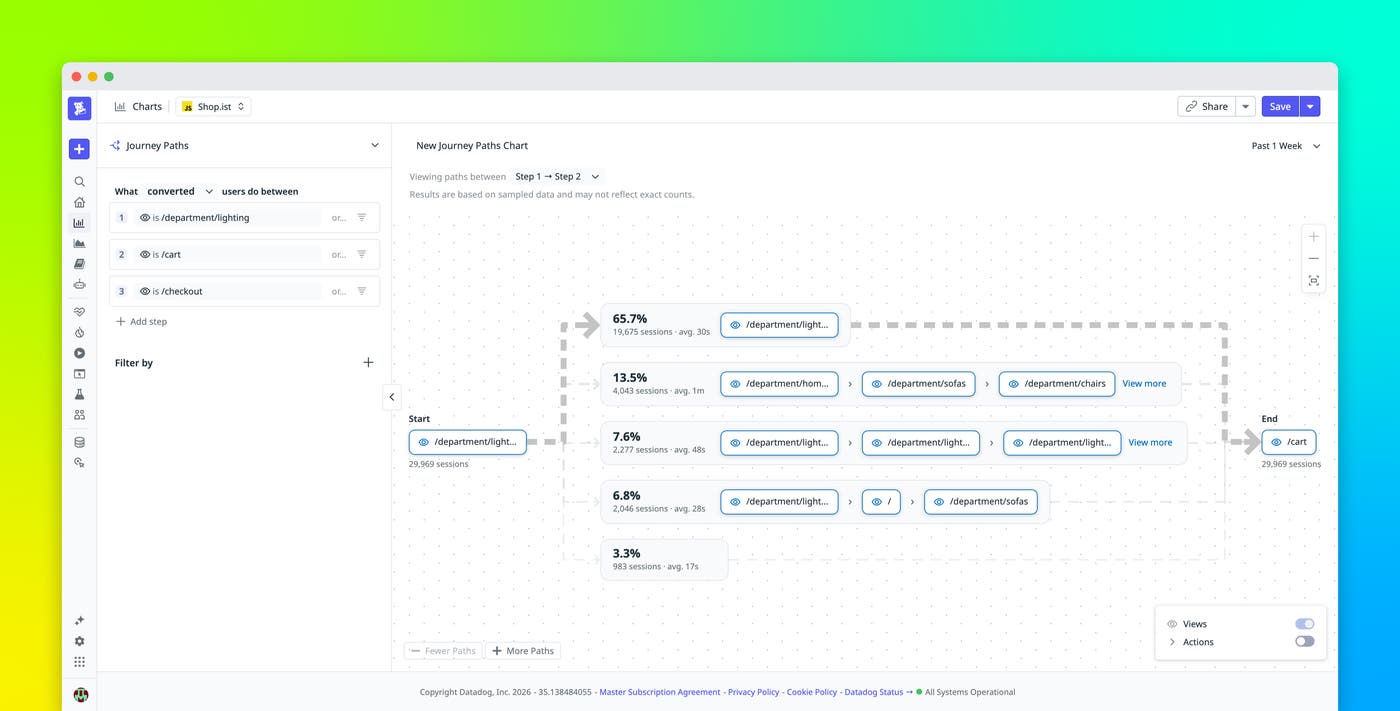
Journey Paths in Datadog Product Analytics helps you understand the behavior behind those numbers. Journey Paths visualizes the sequences of pages and actions that users take through a defined flow, ranks them by frequency, and lets you compare paths for users who converted with paths for users who dropped off. Patterns that once required reviewing individual sessions one at a time become quantified behavioral data.
In this post, we’ll show you how to:
Understand how users convert, not just how many
A successful conversion doesn’t mean that it was efficient. In a multistep checkout, one user might move directly from shipping to billing to payment, while another repeatedly moves between form steps before eventually reaching the same payment event. Both users count as conversions, but their experiences are substantially different.
Converted paths rank the sequences that led users to convert, surfacing differences the conversion rate hides. A repeated back-and-forth pattern can point to confusing form requirements, unclear navigation, or another part of the experience that deserves investigation even though users eventually complete the workflow.
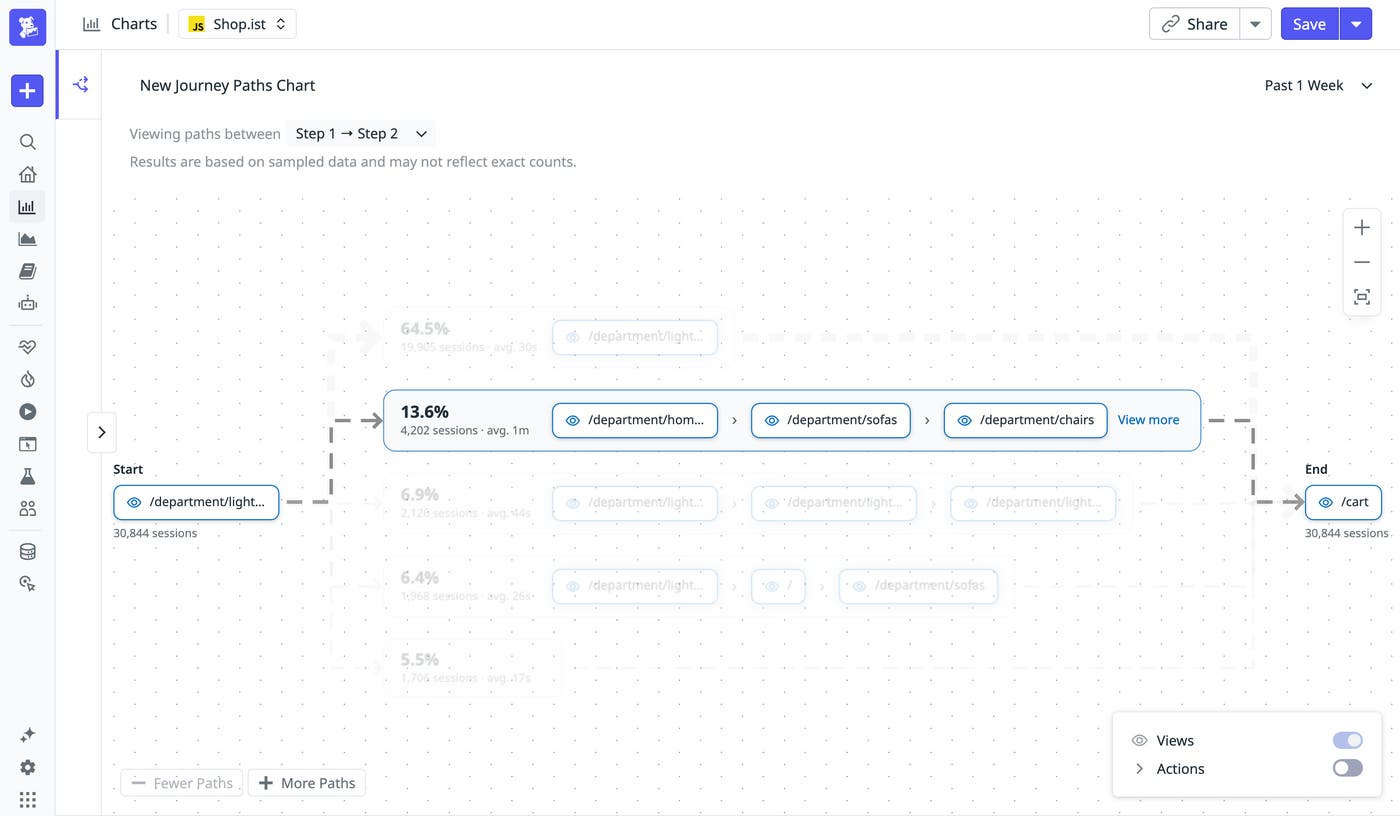
A recurring detour or repeated action might not reduce conversion yet, but it can still increase the time and effort that users spend completing a task. Quantifying that behavior gives product and engineering teams a measurable starting point for deciding where to investigate.
Find the friction behind drop-offs
Dropped-off paths show what users did when they didn’t complete the flow. Instead of stopping at a drop-off percentage, you see the sequences of events associated with that outcome, ranked by frequency.
Two patterns are worth naming: dead ends, where a path stops before users reach the next expected step, and detours, where users leave the intended flow and don’t come back. Because paths are ordered by frequency, you can determine whether one of these behaviors represents a recurring pattern rather than an isolated session.
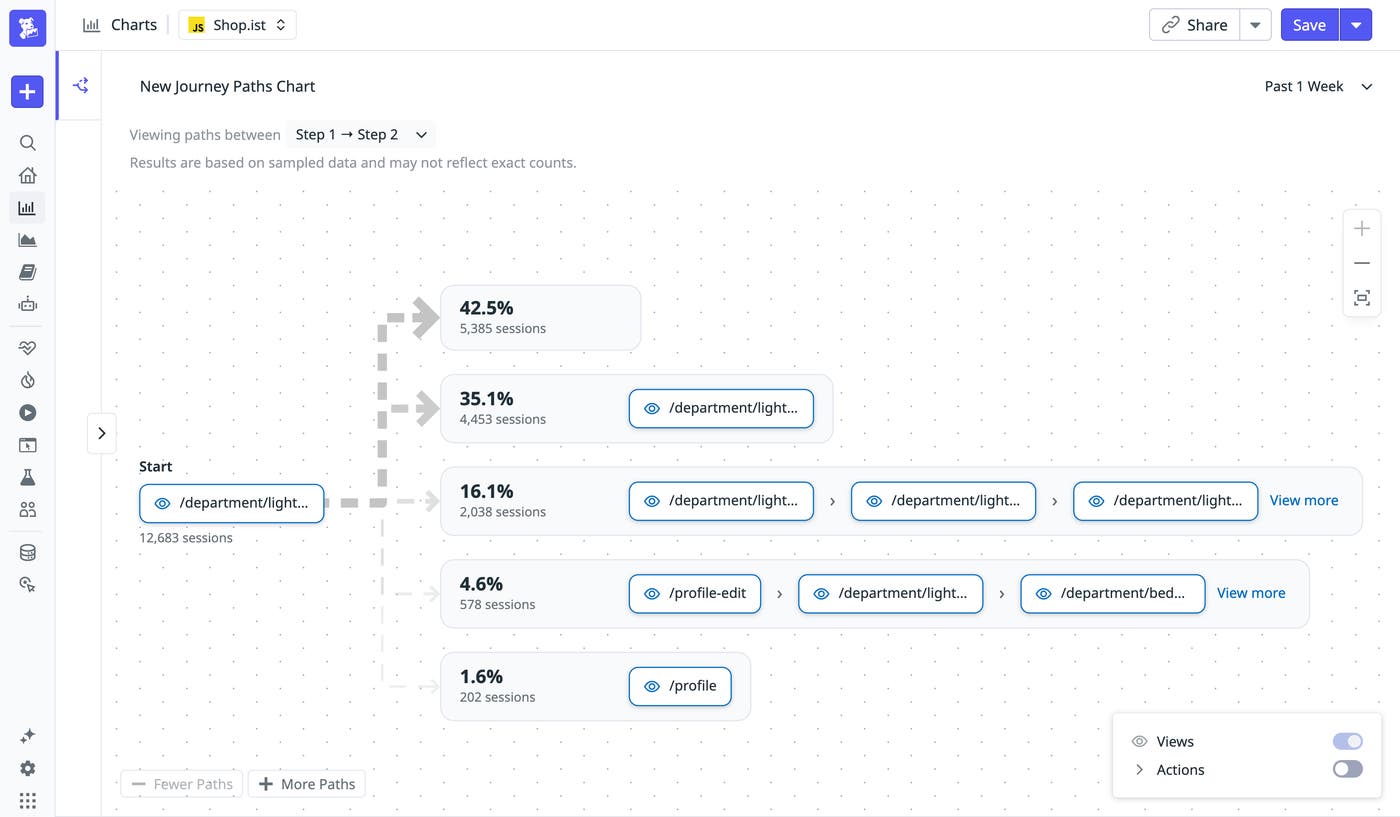
For example, suppose a checkout flow includes a support link to help users who have questions. Funnel analysis shows a large drop-off before payment, while Journey Paths reveals that many of those users clicked the support link and never returned. The link was intended to help users, but the quantified path gives your team a concrete hypothesis to investigate: The support experience may be pulling users away from the task they were trying to complete. Rather than starting with a few replays and trying to infer whether they represent a broader pattern, you can start with the ranked paths and identify behavior that occurs repeatedly across users.
Investigate a path with Conversion Analysis, Session Replay, and RUM
Once you know which sequences correlate with conversion or drop-off, you can investigate which users are associated with those outcomes. The Conversion Analysis panel in Product Analytics funnels uses statistical analysis to rank user attributes and behavioral segments that correlate with conversion or drop-off at a funnel step.
Where a path tells you which sequences users took, Conversion Analysis helps you determine which users are associated with an outcome. For example, if that support-link detour is concentrated among mobile users in one region, that’s a different problem than one affecting everyone. A path that appears primarily for a particular population can point toward a more specific issue than a pattern that occurs broadly across users. You can use that context to narrow the population that you examine before moving into individual sessions.
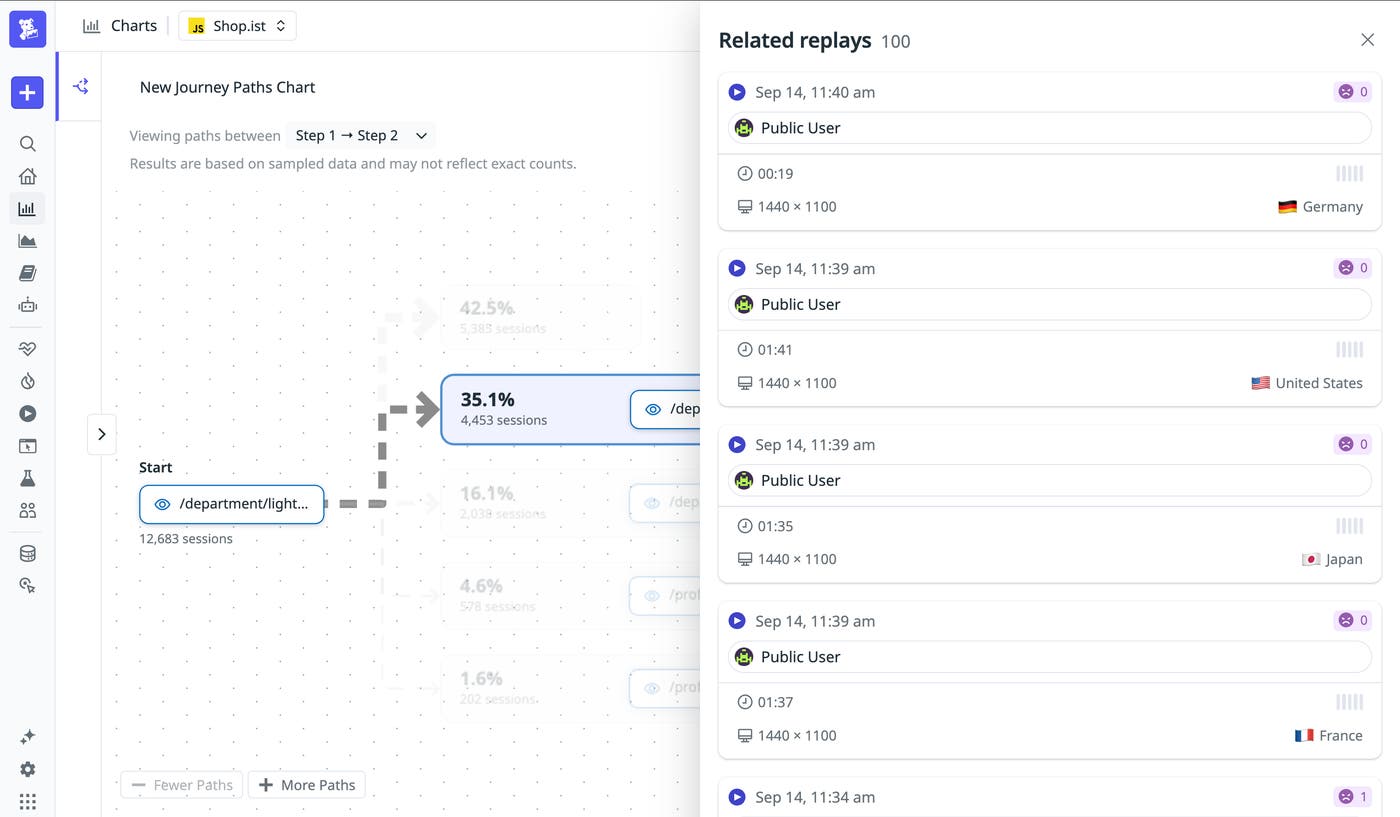
From there, you can pivot to a Session Replay of a real user who took a path. Because you already know the pattern and how common it is, Session Replay becomes the last step rather than the first: You’re confirming what a known behavior looked like on screen instead of hunting for one at random.
Product Analytics also works alongside Real User Monitoring (RUM) so that you can investigate technical conditions around user behavior. For example, if users repeatedly leave a flow at the same point, RUM data can help you examine whether errors, latency, rage clicks, dead clicks, or other experience signals coincide with the behavior. Product Analytics and RUM share the same Browser and Mobile SDKs and configuration, so teams already using RUM don’t need to instrument anything new.
Turn funnel conversions and drop-offs into measurable user behavior
Journey Paths turns a funnel conversion or drop-off from a percentage into a measurable pattern of user behavior. By comparing converted and dropped-off paths, you can find inefficient conversion routes, identify recurring dead ends and detours, and use Conversion Analysis and Session Replay to investigate the users and experiences behind those patterns. And because Journey Paths is its own chart type, you can save it, add it to a dashboard, and keep important journey patterns in front of your team.
Read our Journey Paths documentation to learn how to get started. For more on the surrounding analysis workflow, see the Product Analytics funnel documentation and Product Analytics charts documentation.
If you don’t have a Datadog account, sign up for a free 14-day trial to investigate user journeys with Product Analytics.
