

Candace Shamieh
Technical Content Writer

T Zhang
Senior Software Engineer

Gabriele Baldoni
Software Engineering Lead
A platform engineering team can design robust Golden Paths for agent use yet still be unprepared for what happens after adoption. An agent may authenticate properly, call the correct tools, adhere to approval gates, and complete tasks without incident, but new operational risks arise once multiple teams begin running agents continuously and in parallel.
We’ve encountered these risks firsthand at Datadog. We’re running agentic workflows across the SDLC and have autonomous agents handling operational tasks such as investigation and remediation. To operate resiliently at agent scale, we’ve had to iterate strategically on our platform design.
In this post, we’ll discuss how agent adoption can turn isolated executions into shared platform risk. We’ll use examples from our own systems and share how we’ve addressed capacity constraints, retries, life cycle assumptions, and attribution issues.
We’ll also discuss how platform teams can:
Model how demand accumulates across the agent trajectory
An agent trajectory is the sequence of steps an agent takes to complete a task from start to finish. When operating at agent scale, your capacity planning must account for both the dependencies that the agent uses and how its trajectory consumes them. The platform can only protect the dependencies that are included in the capacity model.
Since model-provider limits are often the most visible constraints, engineering teams can be tempted to design their capacity planning and observability solely around model traffic. In reality, bottlenecks can occur elsewhere, such as in a CI queue or sandbox pool.
For example, let’s say a conversational agent and a background coding agent call the same model provider, use the same tool service, and invoke the same downstream API. While their dependency maps look nearly identical, their capacity profiles are vastly different. The conversational agent holds connections open and requires low-latency tool responses, which makes concurrency and timeout limits important. In contrast, the background agent runs for hours and accumulates queued work, which makes queue depth, worker availability, and recovery behavior most important.
By mapping an agent’s full trajectory, you can avoid treating model traffic as the sole indicator of agent load.
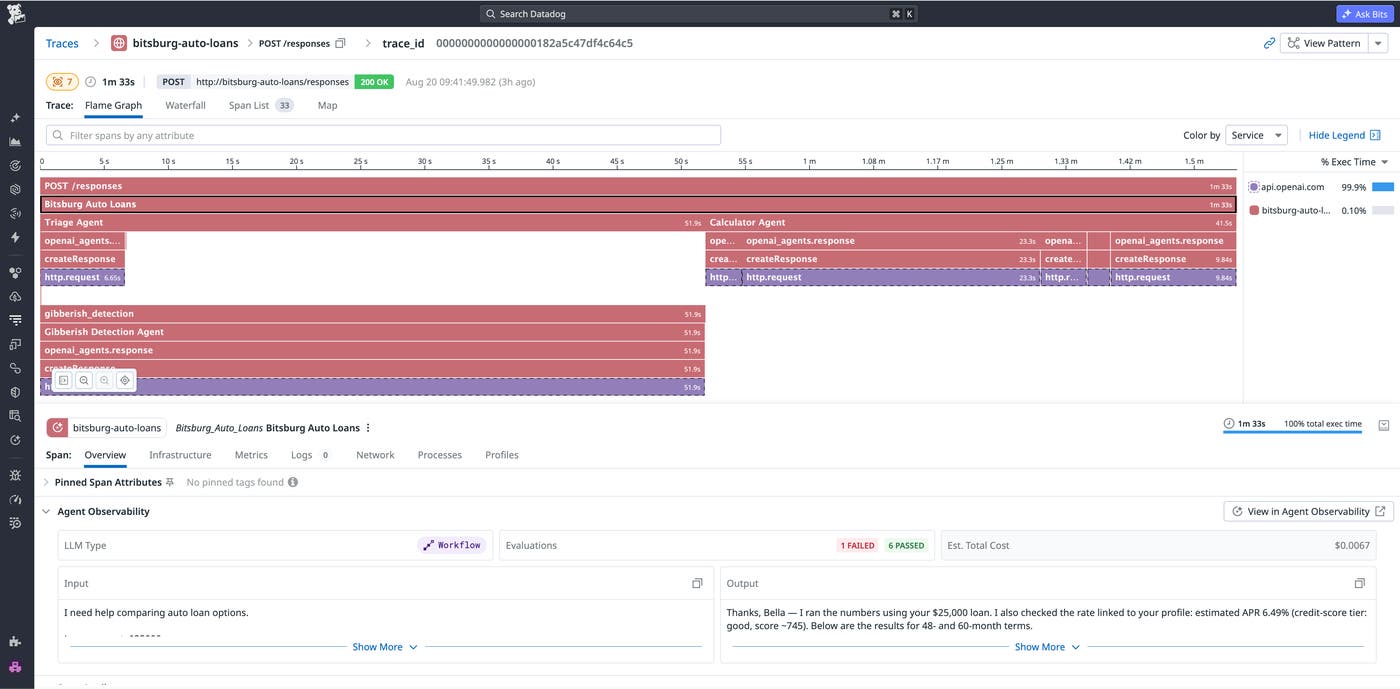
We recommend that the map of your agent trajectory be treated as an inventory. Record each trigger, model request, tool call, queue, CI or workflow job, sandbox operation, downstream API, and final side effect.
Measure each dependency by its limiting constraint
Instead of just monitoring request counts, platform teams should monitor the signals that best represent each dependency’s constraint, including the following:
Request and token throughput, such as requests per minute (RPM) and tokens per minute (TPM)
In-flight concurrency and duration
Queue depth and queue drain time
Tool-call and retry rate or amplification factor
CI worker and sandbox utilization
Remaining provider or downstream API quota headroom
Remaining agent token-budget headroom
Any of these factors can become a constraint, and the limiting resource can shift as teams update models, expand context, or introduce new tools.
Latency is another useful signal for understanding platform health. Although latency isn’t necessarily a limiting constraint, it can still indicate emerging pressure. If a metric like time to first token (TTFT) is increasing, it may mean that an inference API is being overloaded even when request or token throughput remains within configured limits.
By instrumenting capacity signals so they can be broken down by workload and dependency, you can identify which workloads are driving demand, which dependencies are nearing saturation, and which users or products will be impacted first. Only analyzing aggregate totals can make a shared platform seem healthy even when it is under pressure. For example, aggregate capacity signals could obscure a high-volume evaluation workload consuming most of a shared model-provider quota, leaving insufficient headroom for your customer-facing agent.
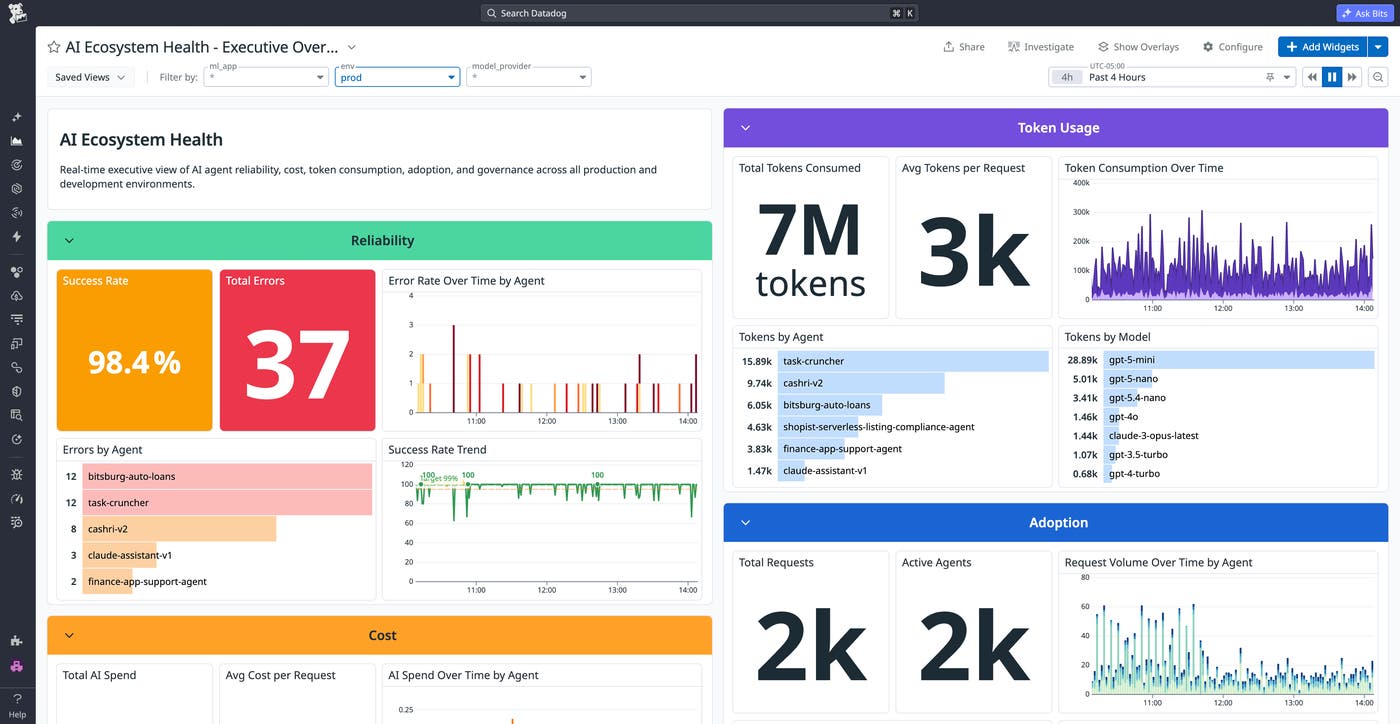
At Datadog, monitoring signals that represent a dependency’s constraints continues to help us make data-informed decisions. When projecting the demand for a high-volume internal coding-agent workload, our engineering team estimated that it would require about 2,000 RPM and 45 billion tokens per day. The RPM was manageable, but the token consumption would have approached an upstream token-throughput limit. The evaluation successfully enabled us to identify a token-throughput constraint before the workload was deployed at scale.
Connect capacity signals to user and product impact
Tracking capacity signals is valuable only when it helps to prevent adverse impact. Some examples include excess token consumption reducing provider headroom, queue growth delaying background investigations, saturated CI capacity postponing changes, and sandbox exhaustion leaving code-executing agents idle.
For each dependency, define the operating threshold and expected impact before exhaustion. This practice will evolve your capacity planning into an operating model that connects capacity signals to user and product consequences.
Once you’ve identified impactful signals, enrich your agent trajectory’s inventory with capacity information. Start with one representative agent workflow and record each dependency, owner, relevant capacity signal, applicable threshold limit, and the user experience that results when the threshold limit is reached.
Here at Datadog, we’ve learned which signals indicate demand for different agent trajectories. As a result, we monitor capacity signals such as queue lag, oldest-event age, worker availability, agent concurrency, and backpressure.
Decide which workloads retain capacity under contention
When a shared dependency becomes constrained, workloads start to compete. Engineering teams are accustomed to solving the resource contention problem, but it intensifies at agent scale as automated workloads run continuously, concurrently, and at machine speed.
To ensure that the highest priority workloads continue to progress, the platform needs to be able to identify who is generating demand. Identifiers enable the platform to apply quotas, priorities, or policies as work passes through gateways, queues, APIs, and enforcement paths. Identifiers also help platform teams differentiate customer-facing traffic from evaluation jobs, assign costs and failures to the correct team, and determine which path to reduce or pause during incidents.
At minimum, requests should have the following identifiers:
Workload
Owner
Environment
Service class
Task or run
Here at Datadog, our internal platform automatically analyzes observability data, including identifiers, for all requests routed through it. Request identifiers enable our teams to isolate demand and apply workload-specific controls.
Allocate capacity based on workload criticality
Once you know who is generating demand, you can use each set of workload requirements to inform how the platform allocates and protects capacity. Different workloads can require distinct quotas, reserved capacity, or other isolation controls. Each workload also has unique requirements for latency, queuing, rejection, and failover, which help determine how isolation controls are configured. For example, customer-facing workloads need reserved capacity, while evaluation runs can pause or reduce concurrency with minimal user impact.
When agents share a constrained dependency, the platform can use workload identity and service class to apply capacity policies based on environment or product criticality. By defining overload behavior before contention arises, you can prevent the noisy neighbor problem, where one workload consumes all available headroom and degrades the experience of others. For each workload type, decide whether it should continue, queue, reduce concurrency, use a fallback, or be rejected once a dependency becomes constrained.
We recommend that you capture these decisions in a workload-class policy. List the workloads that share each constrained dependency, classify them by criticality, and document the owner, expected demand, required protection, and permitted behavior during overload.
At Datadog, we first introduced source-specific limits to prevent concurrent evaluation workloads from consuming the entire shared quota. Now, we further isolate evaluation traffic by routing it through a separate provider account. For example, we have an Anthropic account for production requests that is completely separate from the Anthropic account for evaluation requests. We take an even more granular approach in our production accounts, using rate-limiting buckets to protect customer-facing traffic from other production traffic.
Alert before capacity constraints force a response
By setting preemptive alerts at both the warning and critical thresholds for provider headroom, traffic growth, queue drain time, and other capacity signals, you give yourself the time needed to intervene before callers receive a 429 error or jobs time out.
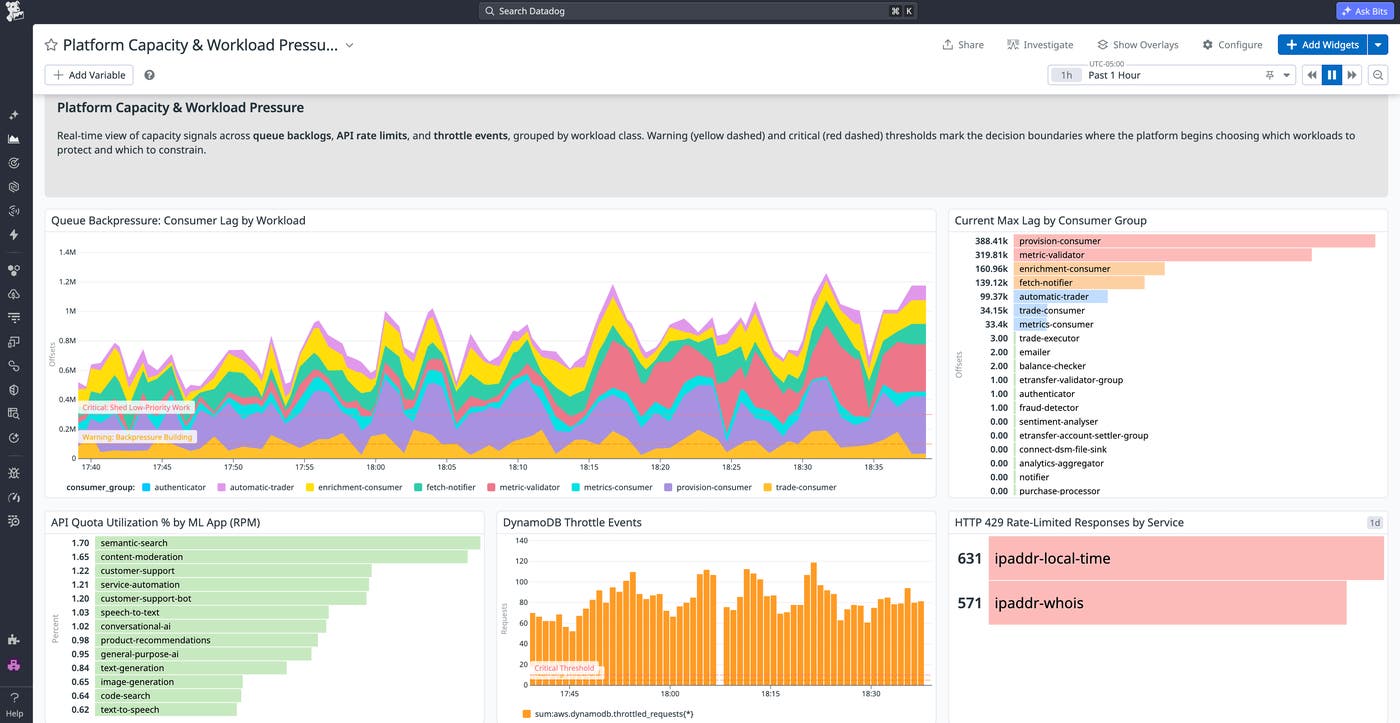
If you create a workload-class policy, your platform can appropriately respond to a triggered signal. The policy provides platform teams with a predefined basis for deciding which workloads to protect, throttle, queue, or pause.
Here at Datadog, we take workload ownership a step further by associating applications that use AI with their responsible teams. By making ownership machine-readable, platform systems can programmatically route notifications or other actions to the appropriate team whenever a workload requires attention.
Prevent recovery behavior from amplifying contention
A constrained dependency can become an incident when retries, concurrency, or service life cycle defaults prevent the system from recovering. Agent clients and harnesses should recognize 429 responses, respect Retry-After headers, and use exponential backoff with jitter for transient failures. They also need to differentiate between retryable and non-retryable errors.
Repeating non-retryable requests causes unnecessary demand, which is further exacerbated with parallel agent trajectories. For example, 10 agents making 3 attempts each results in 30 executions, even before considering tool-call fan-out. If each attempt triggers multiple APIs or CI jobs, downstream work increases faster than the number of agent runs.
Bound recovery at both the trajectory and service levels
Your retry budget should bound how much recovery work a single agent trajectory can generate. When an agent’s trajectory reaches its attempt, time, or cost limit, require it to enter a terminal state. An autonomous loop without a defined endpoint increases demand, cost, and risk of outage.
Setting only trajectory-level limits won’t adequately protect shared dependencies. Even if the trajectory stays within its own budget, concurrent retries across multiple callers can still overwhelm the service. We recommend using service-level controls such as bounded concurrency, queues, circuit breakers, or overload signaling to limit aggregate demand when a dependency is under pressure.
We recommend encoding trajectory- and service-level recovery rules in a failure and recovery contract. Clarify which errors are retryable, the retry budget and terminal state for an individual trajectory, the concurrency or overload limits, and what should happen if either limit is reached.
Design timeouts and recovery around request life cycles
Agent workloads frequently involve long-lived requests. Platform teams should set layer-specific timeouts for connection setup, streaming or tool activity, individual workflow steps, and the complete run. A timeout suitable for connection setup may not fit a streamed response, a long-running tool call, or a workflow that pauses for approval.
Deployment behavior follows the same life cycle. During rolling deployments, services should stop accepting new work, let in-flight requests finish, and maintain streaming connections when required by the protocol or workload. The process should also specify actions after an interruption. Some operations can be retried from the start, while others should resume from a checkpoint; irreversible steps may need to terminate and escalate instead of repeating silently.
At Datadog, we decided to update our timeout configuration when AI Gateway, our internal-facing service that acts as a proxy for LLM providers, used a 5-second graceful shutdown default. To resolve this issue, we increased the shutdown window to 60 seconds, which allowed p99 in-flight requests to complete with headroom during rolling deployments.
Preserve control across agent execution boundaries
Each autonomous workload should use a non-human or delegated identity that can be traced to its source, task, initiating user or service, and permission scope. Short-lived or workload-bound credentials clarify these relationships more effectively than shared, indefinite keys. They also limit potential damage from exposed credentials and help incident responders distinguish between separate runs. We recommend generating stable workload and task or run identifiers when an execution begins, then propagating them through request metadata, queues, tool calls, logs, traces, and audit events.
Ensure that identity is retained even in failed trajectories. When a rate limiter, policy check, or gateway rejects a request before tracing middleware completes, the information in the rejected requests is often critical for investigations. For example, during an AI Gateway traffic spike at Datadog, some spans were tagged with an unknown calling source, effectively delaying issue resolution. In response, we updated the rejection telemetry data to retain the calling source for the 429 responses that occur before requests reach endpoint handlers. Observability is incomplete if identity is lost at the point of enforcement.
Connect agent execution to downstream audit events
We recommend correlating the initiating task and agent trajectory with downstream API calls, configuration changes, and resource events. Stable identifiers that are propagated across these systems support investigations from intent through execution and resulting effects.
Preserve the action and target resource, authorization or approval used, final outcome, and correlation identifiers that connect execution telemetry data to downstream audit events. Instead of storing a hidden chain-of-thought, preserve the task, application-supplied context, actions exposed by the application, and the subsequent platform events.
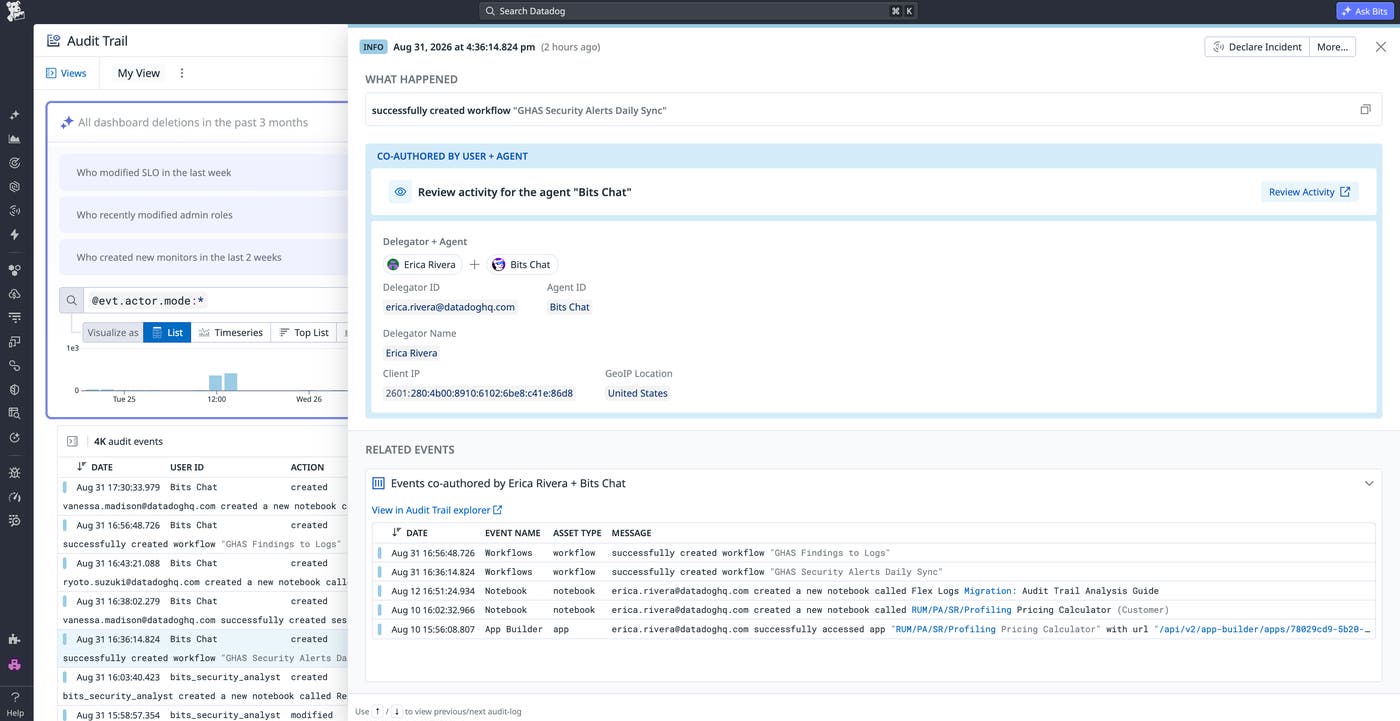
If you’re using Datadog, Agent Observability tracks agent execution and tool use, Application Performance Monitoring (APM) links activity to downstream services, and Audit Trail records configuration and resource changes.
Use workload identity to enforce limits and approvals
Shared platforms can use the same task and workload identity propagated for observability to enforce allow and deny rules, rate and resource limits, and human approval requirements at the gateway or action boundary. Requests that violate policy should be rejected before reaching sensitive systems, and the response should clearly identify it as a non-retryable failure so that a guardrail doesn’t trigger another automated loop.
We recommend that you formalize identity, propagation, and audit requirements in an evidence contract. Define which identifiers every agent run must generate, where they must be propagated, which downstream actions must produce audit events, and which fields responders need to connect a task to its resulting effects.
Key takeaways for operating shared platforms at agent scale
A well-behaved agent doesn’t guarantee a well-behaved platform. As adoption grows, reliability depends on how aggregate agent demand interacts with shared dependencies. The platform must protect critical workloads during contention and keep recovery behavior bounded when dependencies are under pressure. Platform teams can prepare by modeling demand across the full agent trajectory and defining workload-specific policies for capacity, overload and recovery, while preserving identity as agent work crosses system boundaries.
Learn more about how Datadog can help you turn agent-scale demand from an emergent platform risk into something you can observe, control, and operate by visiting our Agent Observability documentation. To start mapping your agent trajectory, sign up for a 14-day free trial.
