Evan Mouzakitis
This post is the third part of a 4-part series on OpenStack Nova monitoring. Part 1 explores the key metrics available from Nova, Part 2 is about collecting those metrics on an ad hoc basis, and Part 4 explores how Lithium monitors OpenStack.
In this post of the OpenStack series, we show you how to monitor OpenStack with Datadog.
To get the most out of your OpenStack monitoring, you need a way to correlate what’s happening in OpenStack with what’s happening in the rest of your infrastructure. OpenStack deployments often rely on additional software packages not included in the OpenStack codebase itself, including MySQL, RabbitMQ, Memcached, HAProxy, and Pacemaker. A comprehensive monitoring implementation includes all the layers of your deployment, not just the metrics emitted by OpenStack itself.
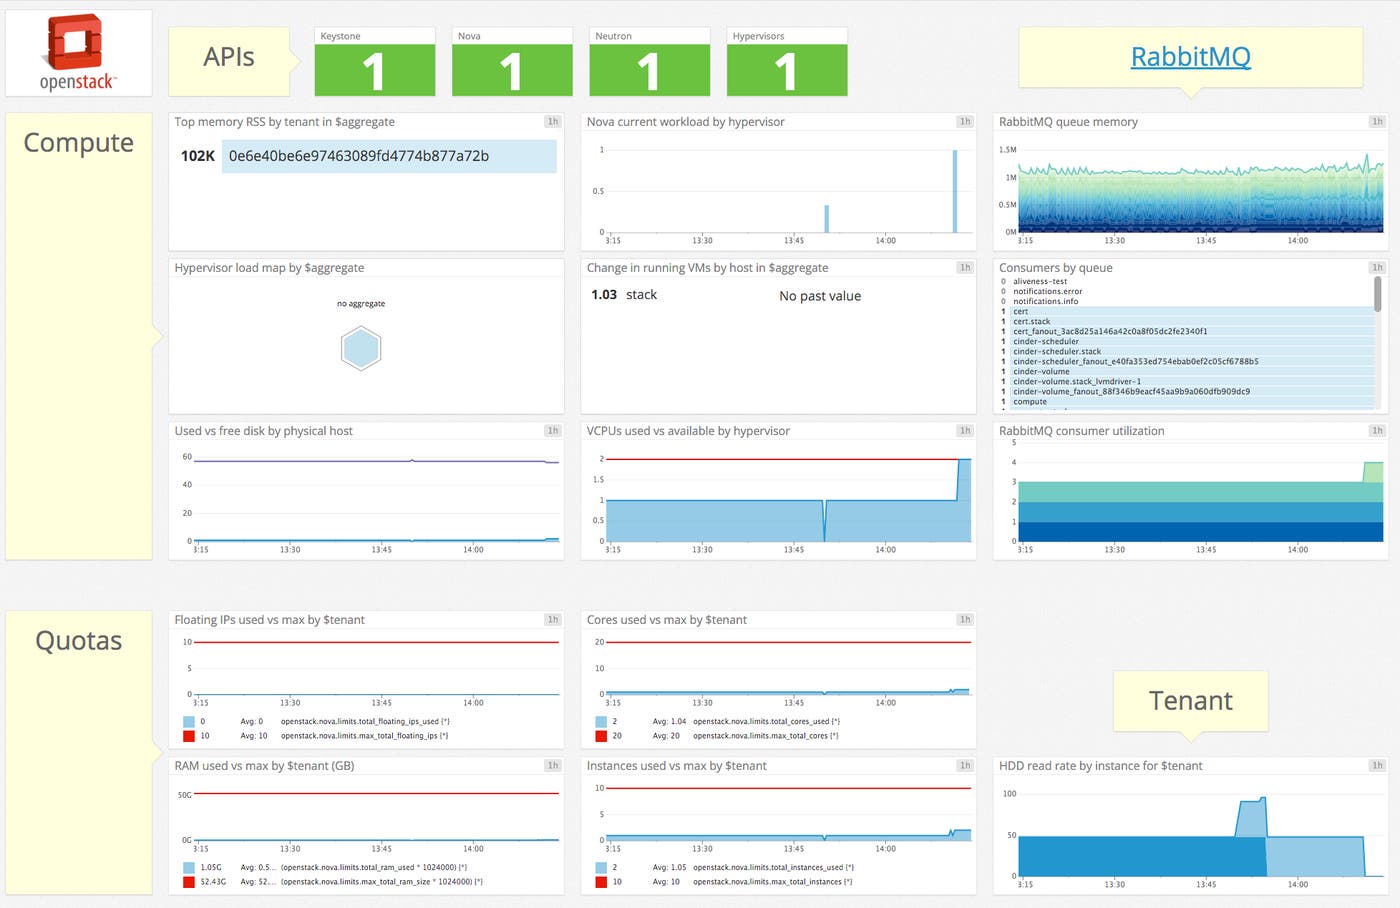
With Datadog, you can collect OpenStack metrics for visualization, alerting, full-infrastructure correlation, and more. Datadog will automatically collect the key metrics discussed in parts one and two of this series, and make them available in a template dashboard, as seen below.

If you’re not a Datadog customer but want to follow along, you can get a free trial.
Configuring OpenStack
Getting the Datadog Agent and OpenStack to talk with each other takes about five minutes. To start, the Datadog Agent will need its own role and user. Run the following series of commands, in order, on your Keystone (identity) server:
-
openstack role create datadog_monitoring -
openstack user create datadog --password my_password --project my_project_name -
openstack role add datadog_monitoring --project my_project_name --user datadog
Be sure to change my_password and my_project before running the commands.
Once you’ve created the user and role, the next step is to apply the privileges needed to collect metrics, which entails modifying three configuration files.
Nova
First, open Nova’s policy file, found at /etc/nova/policy.json. Edit the following permissions, adding role:datadog_monitoring:
- "compute_extension:aggregates" : "role:datadog_monitoring",- "compute_extension:hypervisors" : "role:datadog_monitoring",- "compute_extension:server_diagnostics" : "role:datadog_monitoring",- "compute_extension:v3:os-hypervisors" : "role:datadog_monitoring",- "compute_extension:v3:os-server-diagnostics" : "role:datadog_monitoring",- "compute_extension:availability_zone:detail" : "role:datadog_monitoring",- "compute_extension:v3:availability_zone:detail" : "role:datadog_monitoring",- "compute_extension:used_limits_for_admin" : "role:datadog_monitoring",- "os_compute_api:os-aggregates:index" : "role:datadog_monitoring",- "os_compute_api:os-aggregates:show" : "role:datadog_monitoring",- "os_compute_api:os-hypervisors" : "role:datadog_monitoring",- "os_compute_api:os-hypervisors:discoverable" : "role:datadog_monitoring",- "os_compute_api:os-server-diagnostics" : "role:datadog_monitoring",- "os_compute_api:os-used-limits" : "role:datadog_monitoring"If permissions are already set to a particular rule or role, you can add the new role by appending or role:datadog_monitoring, like so:
"compute_extension:aggregates": "rule:admin_api" becomes "compute_extension:aggregates": "rule:admin_api or role:datadog_monitoring"
Save and close the file.
Neutron
Neutron is nice and easy, with only one modification needed. Open its policy.json (usually found in /etc/neutron) and add role:datadog_monitoring to "get_network". Then, save and close the file.
Keystone
Last but not least, you need to configure Keystone so the Agent can access the tenant list. Add role:datadog_monitoring to the following directives in Keystone’s policy.json (usually found in /etc/keystone):
- "identity:get_project" : "role:datadog_monitoring",- "identity:list_projects" : "role:datadog_monitoring"Save and close the file.
You may need to restart your Keystone, Neutron and Nova API services to ensure the policy changes are applied.
Install the Datadog Agent
The Datadog Agent is open source software that collects and reports metrics from all of your hosts and services so you can view, monitor, and correlate them on the Datadog platform. Installing the Agent usually requires just a single command.
Installation instructions are platform-dependent and can be found here.
As soon as the Datadog Agent is up and running, you should see your host begin to report its system metrics in your Datadog account.

Configuring the Agent
With the necessary OpenStack policy changes in place, it is time to configure the Agent to connect to your Keystone server.
The location of the Agent configuration directory varies by OS, find it for your platform here. In the configuration directory you will find a sample OpenStack configuration file named openstack.yaml.example. Copy this file to openstack.yaml, and open it for editing.
Navigate to the keystone_server_url line. Update the URL with the URL of your Keystone server, including the port (usually 5000).
Next, under instances, change project id to the project ID that corresponds to the project associated with the datadog user. To get the project ID, navigate to <yourHorizonserver>/identity. See below for an example:
instances: - name: instance_1 # A required unique identifier for this instance
# The authorization scope that will be used to request a token from Identity API v3 # The auth scope must resolve to 1 of the following structures: # {'project': {'name': 'my_project', 'domain': 'my_domain} OR {'project': {'id': 'my_project_id'}} auth_scope: project: id: b9d363ac9a5b4cceae228e03639357aeFinally, you need to modify the authentication credentials to match the user and role created earlier. Navigate to the # User credentials section and make the following changes:
# User credentials # Password authentication is the only auth method supported right now # User expects username, password, and user domain id
# `user` should resolve to a structure like {'password': 'my_password', 'name': 'my_name', 'domain': {'id': 'my_domain_id'}} user: password: my_password name: datadog domain: id: defaultSave and close openstack.yaml.
Integrating RabbitMQ with Datadog
Getting metrics from RabbitMQ requires fewer steps than OpenStack.
Start by running the following command to install the management plugin for RabbitMQ: rabbitmq-plugins enable rabbitmq_management.
This will create a web UI for RabbitMQ on port 15672, and it will expose an HTTP API, which the Datadog Agent uses to collect metrics.
Once the plugin is enabled, restart RabbitMQ for the changes to take effect:
service rabbitmq-server restart.
Next, navigate to the Agent configuration directory again. Find the sample RabbitMQ config file named rabbitmq.yaml.example and copy it to rabbitmq.yaml. Open it and navigate to the instances: section:
instances: - rabbitmq_api_url: http://localhost:15672/api/ rabbitmq_user: guest # defaults to 'guest' rabbitmq_pass: guest # defaults to 'guest'Update the rabbitmq_user, rabbitmq_pass, and rabbitmq_api_url fields appropriately, then save and close the file.
After making the appropriate changes to both yaml files, restart the Agent. The command varies by platform. For Debian/Ubuntu: sudo /etc/init.d/datadog-agent restart
Verify the configuration
With the configuration changes in place, it’s time to see if everything is properly integrated. Execute the Datadog info command. On Debian/Ubuntu, run sudo /etc/init.d/datadog-agent info
For other platforms, find the specific command here.
If the configuration is correct, you will see a section like the one below in the info output:
Checks====== [...]
openstack --------- - instance #0 [OK] - Collected 74 metrics, 0 events & 6 service checksThe snippet above shows six service checks in addition to the collected metrics. For OpenStack, the service checks report the availability of your Nova, Neutron, and Keystone APIs as well as checks for individual hypervisors and networks.
You should also see something like the following for RabbitMQ:
rabbitmq -------- - instance #0 [OK] - Collected 609 metrics, 0 events & 1 service checkEnable the integration
Finally, click the OpenStack Install Integration button inside your Datadog account. The button is located under the Configuration tab in the OpenStack integration settings.

Since the Agent automatically queries RabbitMQ via its API endpoint, you don’t need to enable the RabbitMQ integration in your Datadog account.
Show me the metrics!
Once the Agent begins reporting OpenStack metrics, you will see an OpenStack dashboard among your list of available dashboards in Datadog.
The default OpenStack dashboard displays the key metrics to watch highlighted in our introduction to Nova monitoring.
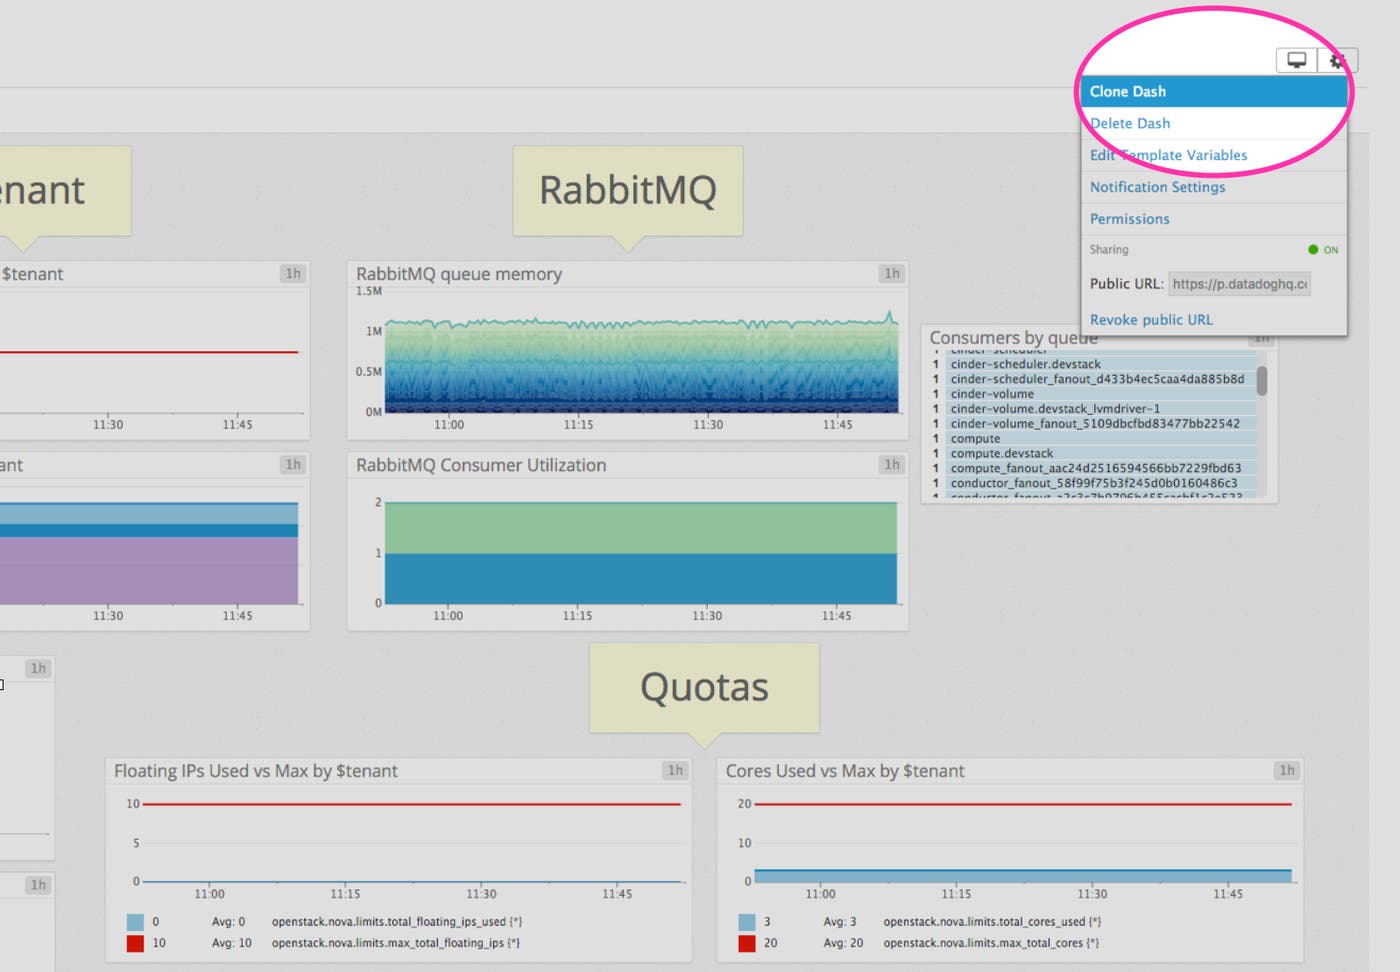
You can easily create a tailored dashboard to monitor your OpenStack as well as your entire stack by adding additional graphs and metrics from your other systems. For example, you might want to graph Nova metrics alongside metrics from your Redis databases, or alongside host-level metrics such as network traffic. To start building a custom dashboard, clone the default OpenStack dashboard by clicking on the gear in the upper right of the dashboard and selecting Clone Dash.

Diagnosing and Alerting
Systematically collecting monitoring data serves two broad purposes: alerting operators in real-time to issues as they develop (alerting), and helping to identify the root cause of a problem (diagnosing). A full-featured monitoring solution does both. With Datadog, you get actionable alerts in real-time, so you can respond to issues as they emerge, plus the high-resolution metrics and historical perspective that you need to dive deep into diagnosing the root cause of an issue.
Alerting on Nova metrics
Once Datadog is capturing and visualizing your metrics, you will likely want to set up some alerts to be automatically notified of potential issues. You can set up an alert to notify you of API availability issues, for example.
Datadog can monitor individual hypervisors, instances, containers, services, and processes—or virtually any combination thereof. For instance, you can monitor all of your Nova nodes, or all hosts in a certain availability zone, or a single key metric being reported by all hosts corresponding to a specific tag.
Conclusion
In this post we’ve walked you through integrating OpenStack Nova and RabbitMQ with Datadog to visualize your key metrics and notify the right team whenever your infrastructure shows signs of trouble.
If you’ve followed along using your own Datadog account, you should now have improved visibility into what’s happening in your environment, as well as the ability to create automated alerts tailored to your infrastructure, usage patterns, and the metrics that are most valuable to your organization.
If you don’t yet have a Datadog account, you can sign up for a free trial and start monitoring OpenStack Nova right away.
Source Markdown for this post is available on GitHub. Questions, corrections, additions, etc.? Please let us know.


