Alexis Lê-Quôc
This post is part of a series on effective monitoring. Be sure to check out the rest of the series: Collecting the right data and Investigating performance issues.
Automated alerts are essential to monitoring. They allow you to spot problems anywhere in your infrastructure, so that you can rapidly identify their causes and minimize service degradation and disruption. To reference a companion post, if metrics and other measurements facilitate observability, then alerts draw human attention to the particular systems that require observation, inspection, and intervention.
But alerts aren’t always as effective as they could be. In particular, real problems are often lost in a sea of noisy alarms. This article describes a simple approach to effective alerting, regardless of the scale of the systems involved. In short:
- Alert liberally; page judiciously
- Page on symptoms, rather than causes
This series of articles comes out of our experience monitoring large-scale infrastructure for our customers. It also draws on the work of Brendan Gregg, Rob Ewaschuk, and Baron Schwartz.
When to alert someone (or no one)

An alert should communicate something specific about your systems in plain language: “Two Cassandra nodes are down” or “90% of all web requests are taking more than 0.5s to process and respond.” Automating alerts across as many of your systems as possible allows you to respond quickly to issues and provide better service, and it also saves time by freeing you from continual manual inspection of metrics.
Levels of alerting urgency
Not all alerts carry the same degree of urgency. Some require immediate human intervention, some require eventual human intervention, and some point to areas where attention may be needed in the future. All alerts should, at a minimum, be logged to a central location for easy correlation with other metrics and events.
Alerts as records (low severity)
Many alerts will not be associated with a service problem, so a human may never even need to be aware of them. For instance, when a data store that supports a user-facing service starts serving queries much slower than usual, but not slow enough to make an appreciable difference in the overall service’s response time, that should generate a low-urgency alert that is recorded in your monitoring system for future reference or investigation but does not interrupt anyone’s work. After all, transient issues that could be to blame, such as network congestion, often go away on their own. But should the service start returning a large number of timeouts, that alert-based data will provide invaluable context for your investigation.
Alerts as notifications (moderate severity)
The next tier of alerting urgency is for issues that do require intervention, but not right away. Perhaps the data store is running low on disk space and should be scaled out in the next several days. Sending an email and/or posting a notification in the service owner’s chat room is a perfect way to deliver these alerts—both message types are highly visible, but they won’t wake anyone in the middle of the night or disrupt an engineer’s flow.
Alerts as pages (high severity)
The most urgent alerts should receive special treatment and be escalated to a page (as in “pager”) to urgently request human attention. Response times for your web application, for instance, should have an internal SLA that is at least as aggressive as your strictest customer-facing SLA. Any instance of response times exceeding your internal SLA would warrant immediate attention, whatever the hour.

When to let a sleeping engineer lie
Whenever you consider setting an alert, ask yourself three questions to determine the alert’s level of urgency and how it should be handled:
- Is this issue real? It may seem obvious, but if the issue is not real, it usually should not generate an alert. The examples below can trigger alerts but probably are not symptomatic of real problems. Alerting—or, worse, paging—on occurrences such as these contributes to alert fatigue and can cause more serious issues to be ignored:
- Metrics in a test environment are out of bounds- A single server is doing its work very slowly, but it is part of a cluster with fast-failover to other machines, and it reboots periodically anyway- Planned upgrades are causing large numbers of machines to report as offlineIf the issue is indeed **real**, it should generate an alert. Even if the alert is not linked to a notification, it should be recorded within your monitoring system for later analysis and correlation.-
Does this issue require attention? If you can reasonably automate a response to an issue, you should consider doing so. There is a very real cost to calling someone away from work, sleep, or personal time. If the issue is real and it requires attention, it should generate an alert that notifies someone who can investigate and fix the problem. At minimum, the notification should be sent via email, chat or a ticketing system so that the recipients can prioritize their response.
-
Is this issue urgent? Not all issues are emergencies. For example, perhaps a moderately higher than normal percentage of system responses have been very slow, or perhaps a slightly elevated share of queries are returning stale data. Both issues may need to be addressed soon, but not at 4:00 A.M. If, on the other hand, a key system stops doing its work at an acceptable rate, an engineer should take a look immediately. If the symptom is real and it requires attention and it is urgent, it should generate a page.

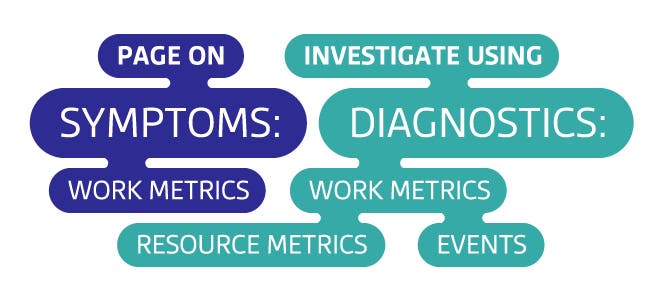
Page on symptoms
Pages deserve special mention: they are extremely effective for delivering information, but they can be quite disruptive if overused, or if they are linked to poorly designed alerts. In general, a page is the most appropriate kind of alert when the system you are responsible for stops doing useful work with acceptable throughput, latency, or error rates. Those are the sort of problems that you want to know about immediately.
The fact that your system stopped doing useful work is a symptom —that is, it is a manifestation of an issue that may have any number of different causes. For example: if your website has been responding very slowly for the last three minutes, that is a symptom. Possible causes include high database latency, failed application servers, Memcached being down, high load, and so on. Whenever possible, build your pages around symptoms rather than causes. See our companion article on data collection for a metric framework that helps to separate symptoms from causes.
Paging on symptoms surfaces real, oftentimes user-facing problems, rather than hypothetical or internal problems. Contrast paging on a symptom, such as slow website responses, with paging on potential causes of the symptom, such as high load on your web servers. Your users will not know or care about server load if the website is still responding quickly, and your engineers will resent being bothered for something that is only internally noticeable and that may revert to normal levels without intervention.
Durable alert definitions
Another good reason to page on symptoms is that symptom-triggered alerts tend to be durable. This means that regardless of how underlying system architectures may change, if the system stops doing work as well as it should, you will get an appropriate page even without updating your alert definitions.

Exception to the rule: Early warning signs
It is sometimes necessary to call human attention to a small handful of metrics even when the system is performing adequately. Early warning metrics reflect an unacceptably high probability that serious symptoms will soon develop and require immediate intervention.
Disk space is a classic example. Unlike running out of free memory or CPU, when you run out of disk space, the system will not likely recover, and you probably will have only a few seconds before your system hard stops. Of course, if you can notify someone with plenty of lead time, then there is no need to wake anyone in the middle of the night. Better yet, you can anticipate some situations when disk space will run low and build automated remediation based on the data you can afford to erase, such as logs or data that exists somewhere else.
Conclusion: Get serious about symptoms
- Send a page only when symptoms of urgent problems in your system’s
work are detected, or if a critical and finite resource limit is
about to be reached. - Set up your monitoring system to record alerts whenever it detects
real issues in your infrastructure, even if those issues have not
yet affected overall performance.
We would like to hear about your experiences as you apply this framework to your own monitoring practice. If it is working well, please let us know on Twitter! Questions, corrections, additions, complaints, etc? Please let us know on GitHub.


