
Evan Mouzakitis
This post is Part 1 of a 4-part series about monitoring OpenStack Nova. Part 2 is about collecting operational data from Nova, Part 3 details how to monitor Nova with Datadog, and Part 4 explores how Lithium monitors OpenStack.
The 30,000-foot view
OpenStack is an open source cloud-computing software platform. It is primarily deployed as infrastructure-as-a-service and can be likened to a version of Amazon Web Services that can be hosted anywhere. Originally developed as a joint project between Rackspace and NASA, OpenStack is about five years old and has a large number of high-profile corporate supporters, including Google, Hewlett-Packard, Comcast, IBM, and Intel.
OpenStack is an ambitious project with the goal of providing an open, self-hostable alternative to cloud providers like AWS, Azure, DigitalOcean, and Joyent. It features a modular architecture with a current list of 16 services, including meta-services like Ceilometer, OpenStack’s billing/telemetry module.
In this series of posts, we will dive into Nova, the OpenStack Compute module, and explain its key metrics and other useful data points:
- Hypervisor metrics report work performed by hypervisors, for example the number of running VMs, or load on the hypervisor itself.
- Nova server metrics report some information about servers, such as disk read requests per second.
- Tenant metrics report resources used or available to a group of users, for example total number of cores.
- Message queue metrics reflect the state of the internal message-passing queue, for example its size.
- Notifications report discrete events such as when a new compute instance is created.
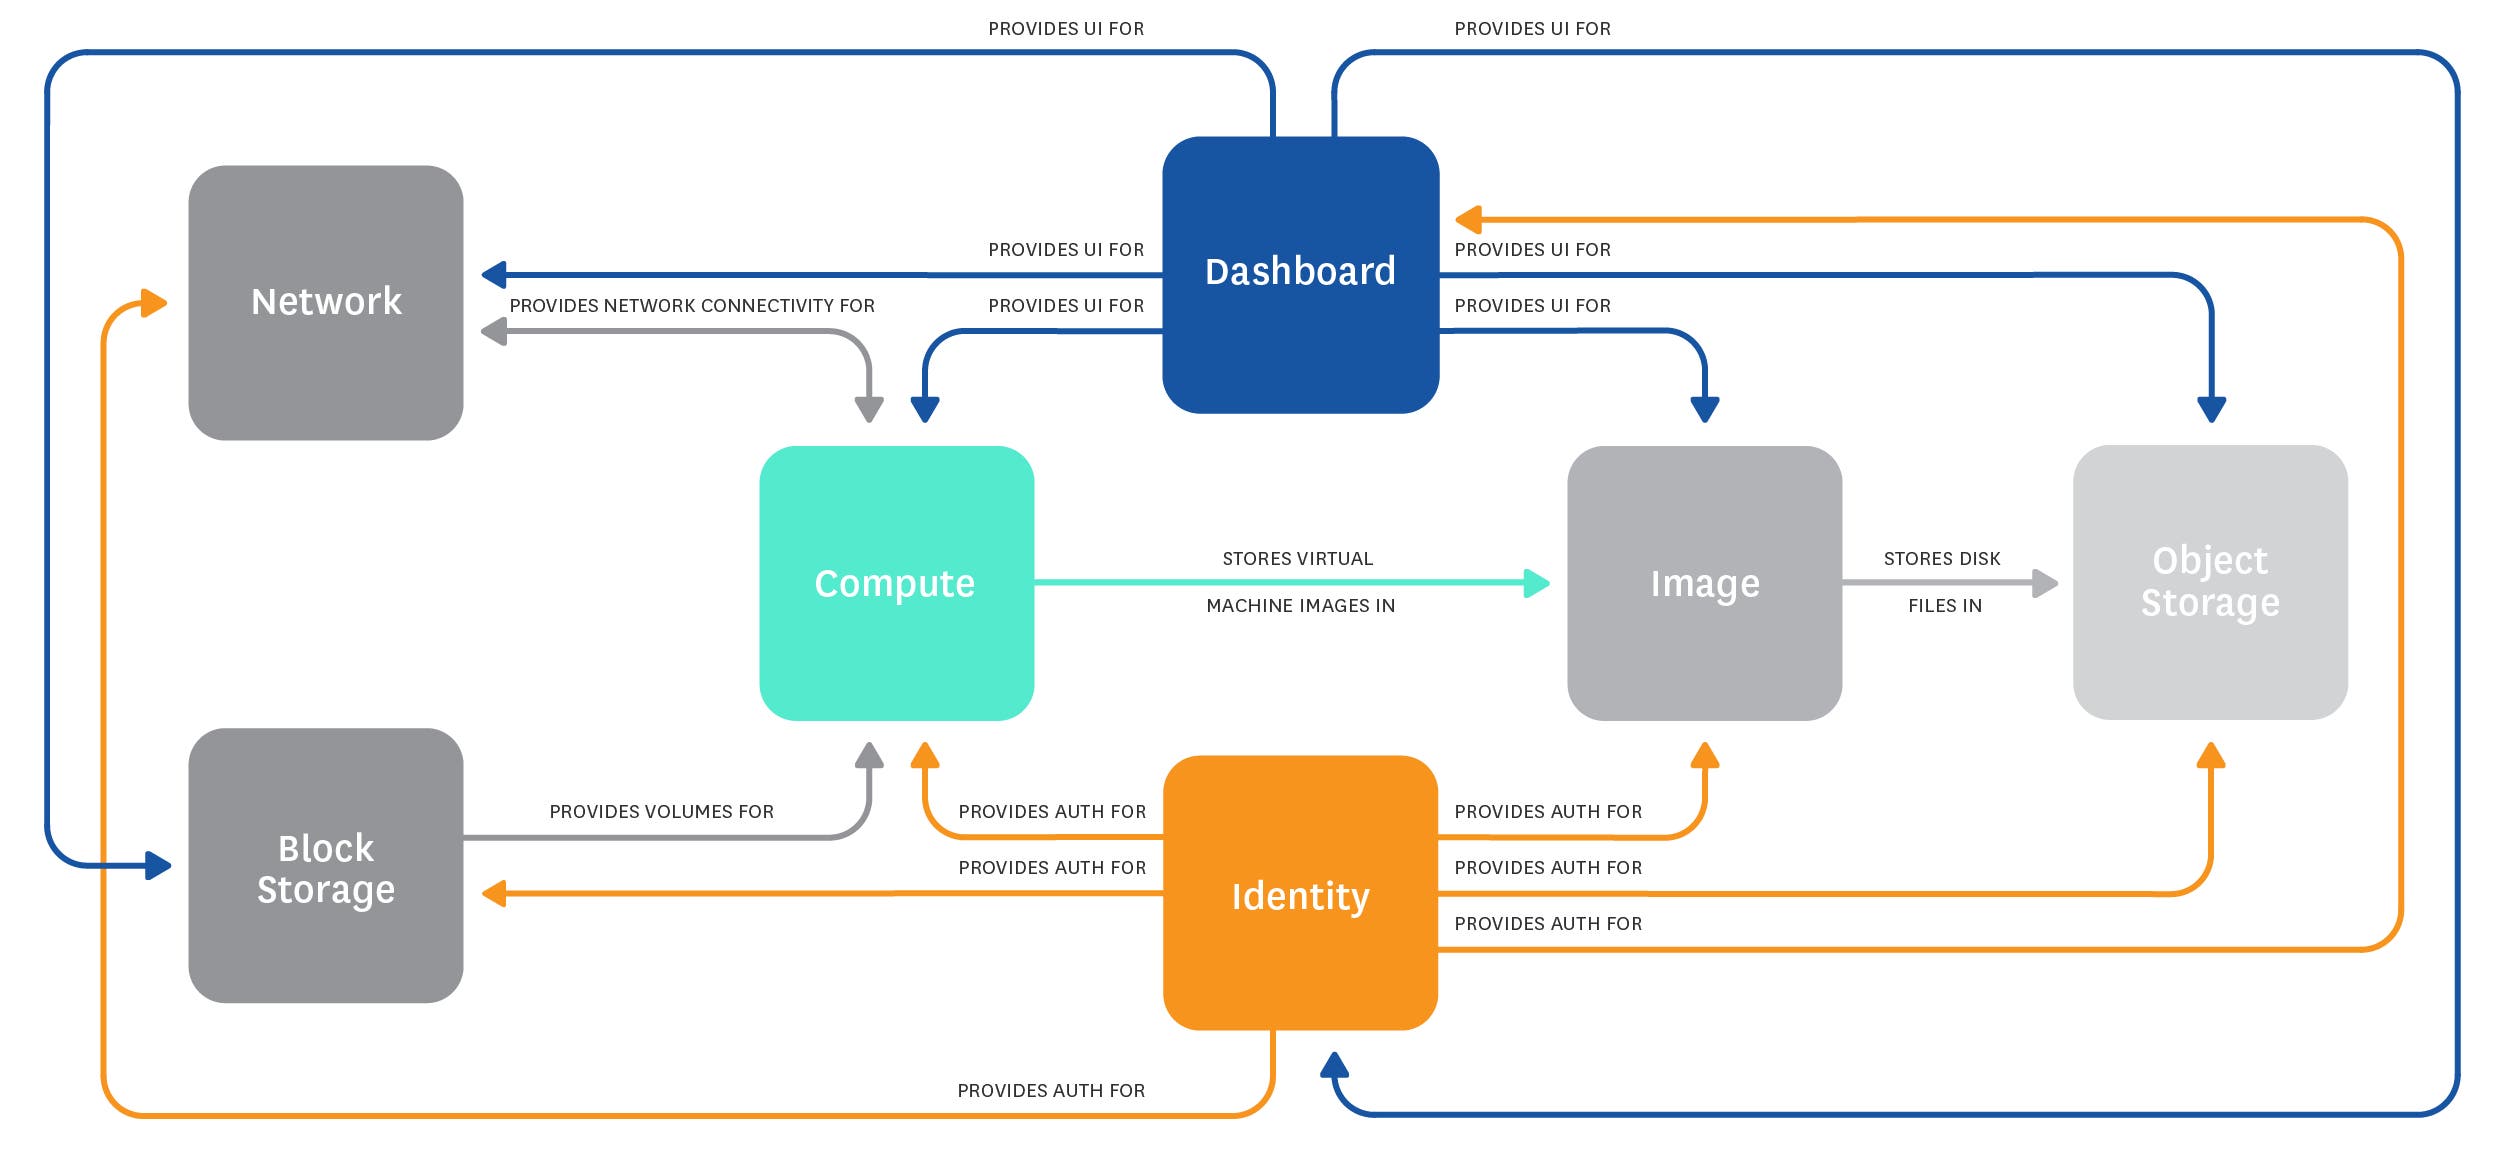
A note on terminology: The OpenStack project uses the terms project and tenant interchangeably to refer to a group of users. In this post, we will use the term tenant for clarity.
What Nova does
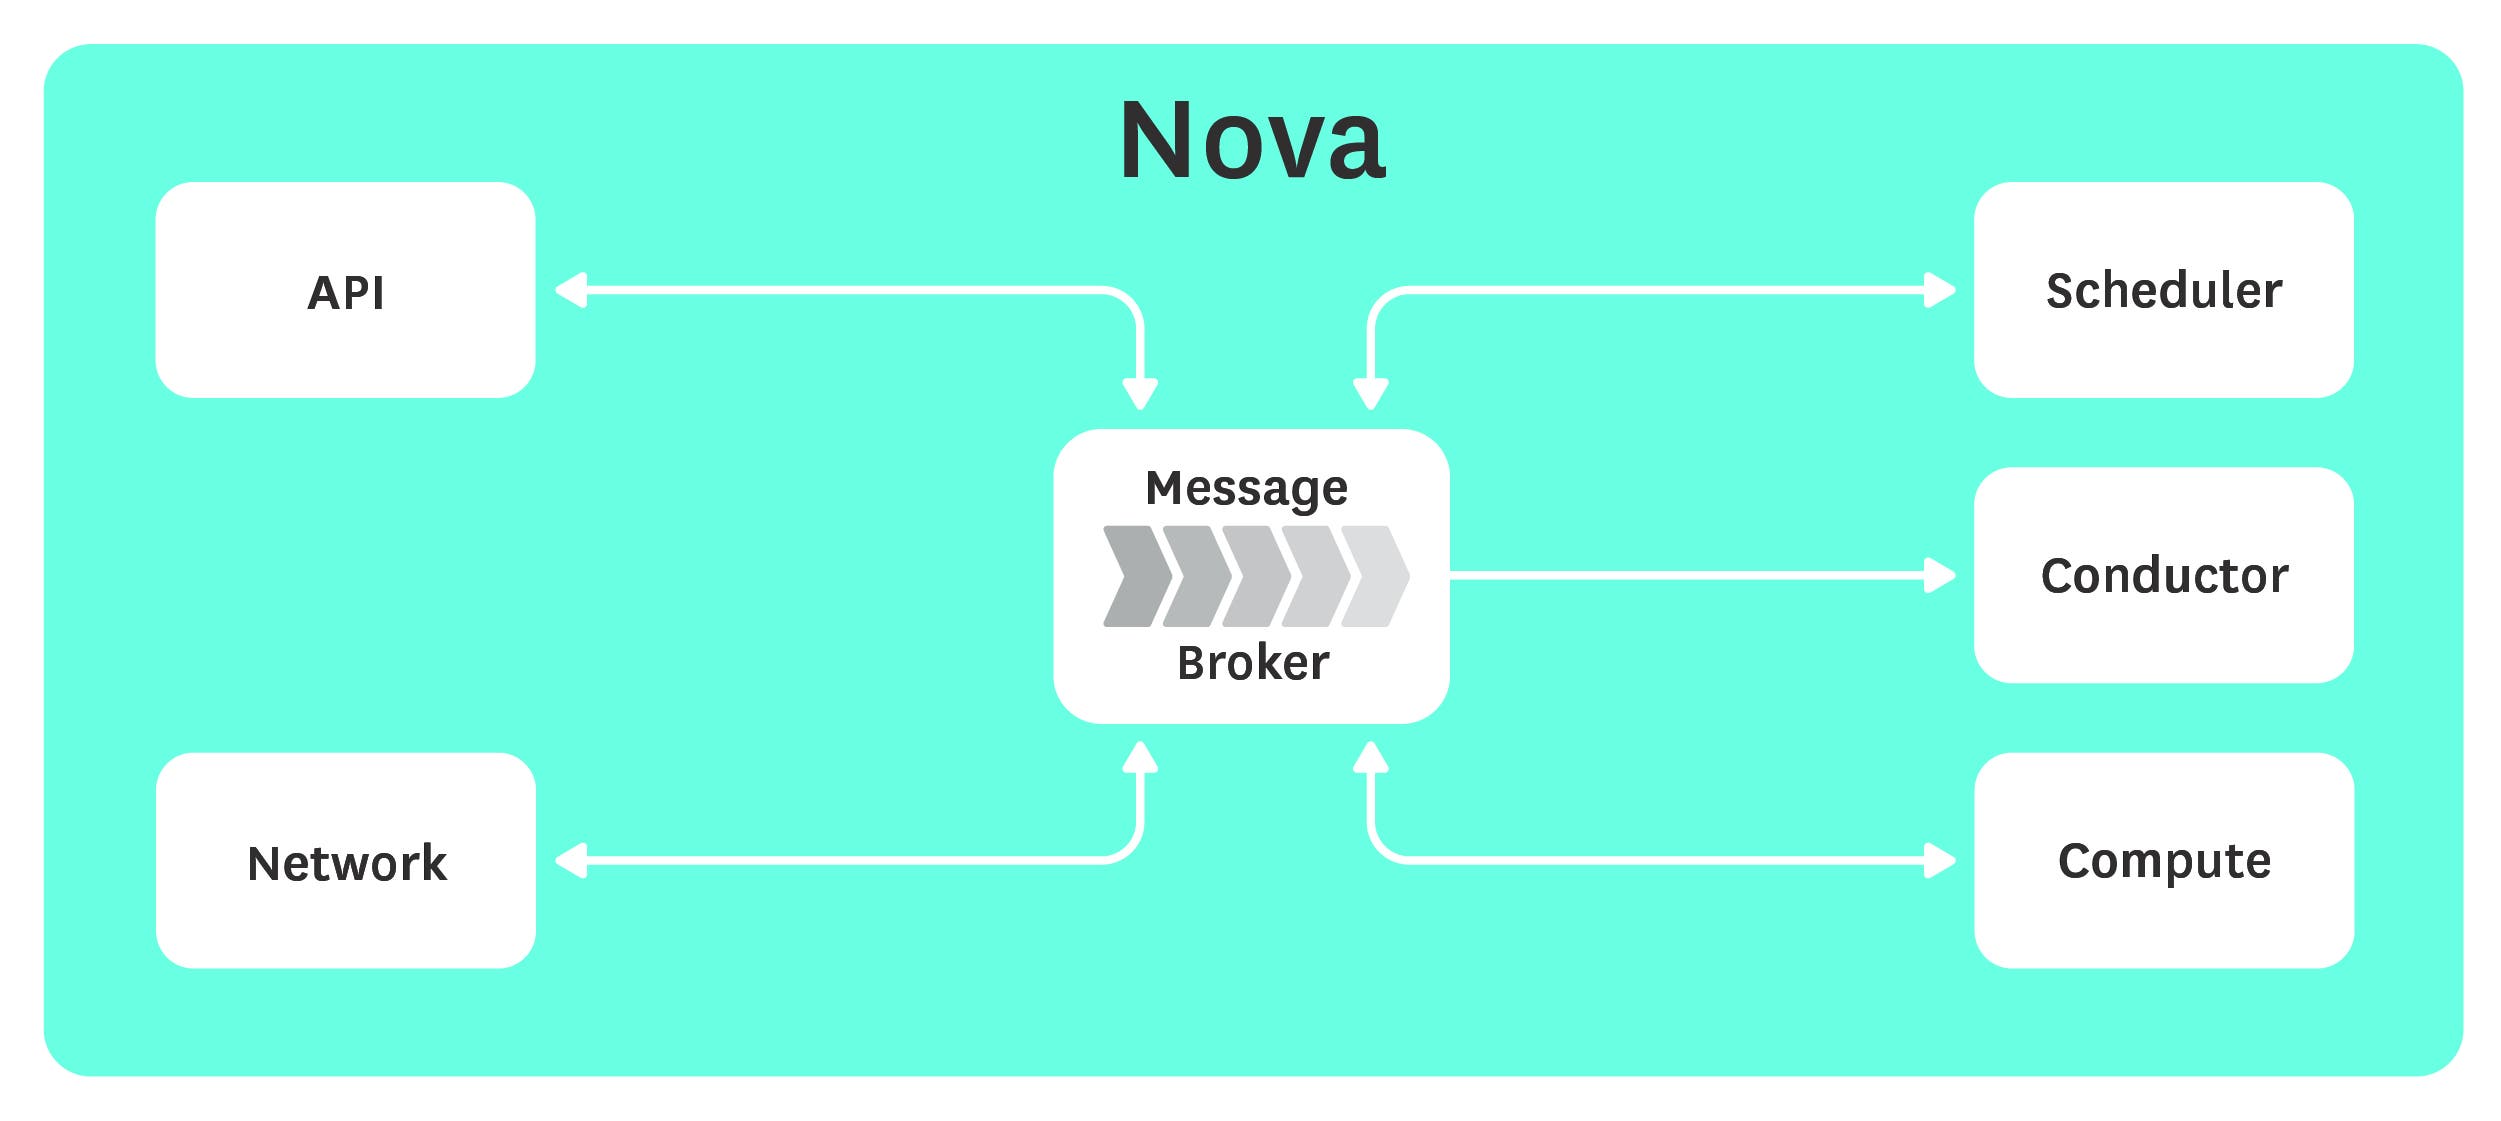
The core of the OpenStack project lies in the Compute module, known as Nova. Nova is responsible for the provisioning and management of virtual machines. It features full support for KVM and QEMU out of the box, with partial support for other hypervisors including VMWare, Xen, and Hyper-V.
If you’re already familiar with Amazon Web Services, Nova is compatible with EC2 and S3 APIs, easing the migration of applications and decreasing development times for those already using AWS.
Key Nova metrics and events
Nova metrics can be logically grouped into three categories: hypervisor metrics, tenant metrics and nova server metrics. Hypervisor metrics give a clear view of the work performed by your hypervisors, nova server metrics give you a window into your virtual machine instances, and tenant metrics provide detailed information about user resource usage.
Though OpenStack’s modules expose many metrics, correlation of these built-in metrics with other information sources is essential to really understand what’s happening inside OpenStack. For example, because OpenStack uses RabbitMQ under the hood, no monitoring solution would be complete without integrating RabbitMQ metrics as well.
Combining metrics from various systems in addition to log file data and OpenStack notifications will really help pull back the curtain so you can observe what’s actually going on in your deployment.
Hypervisor metrics
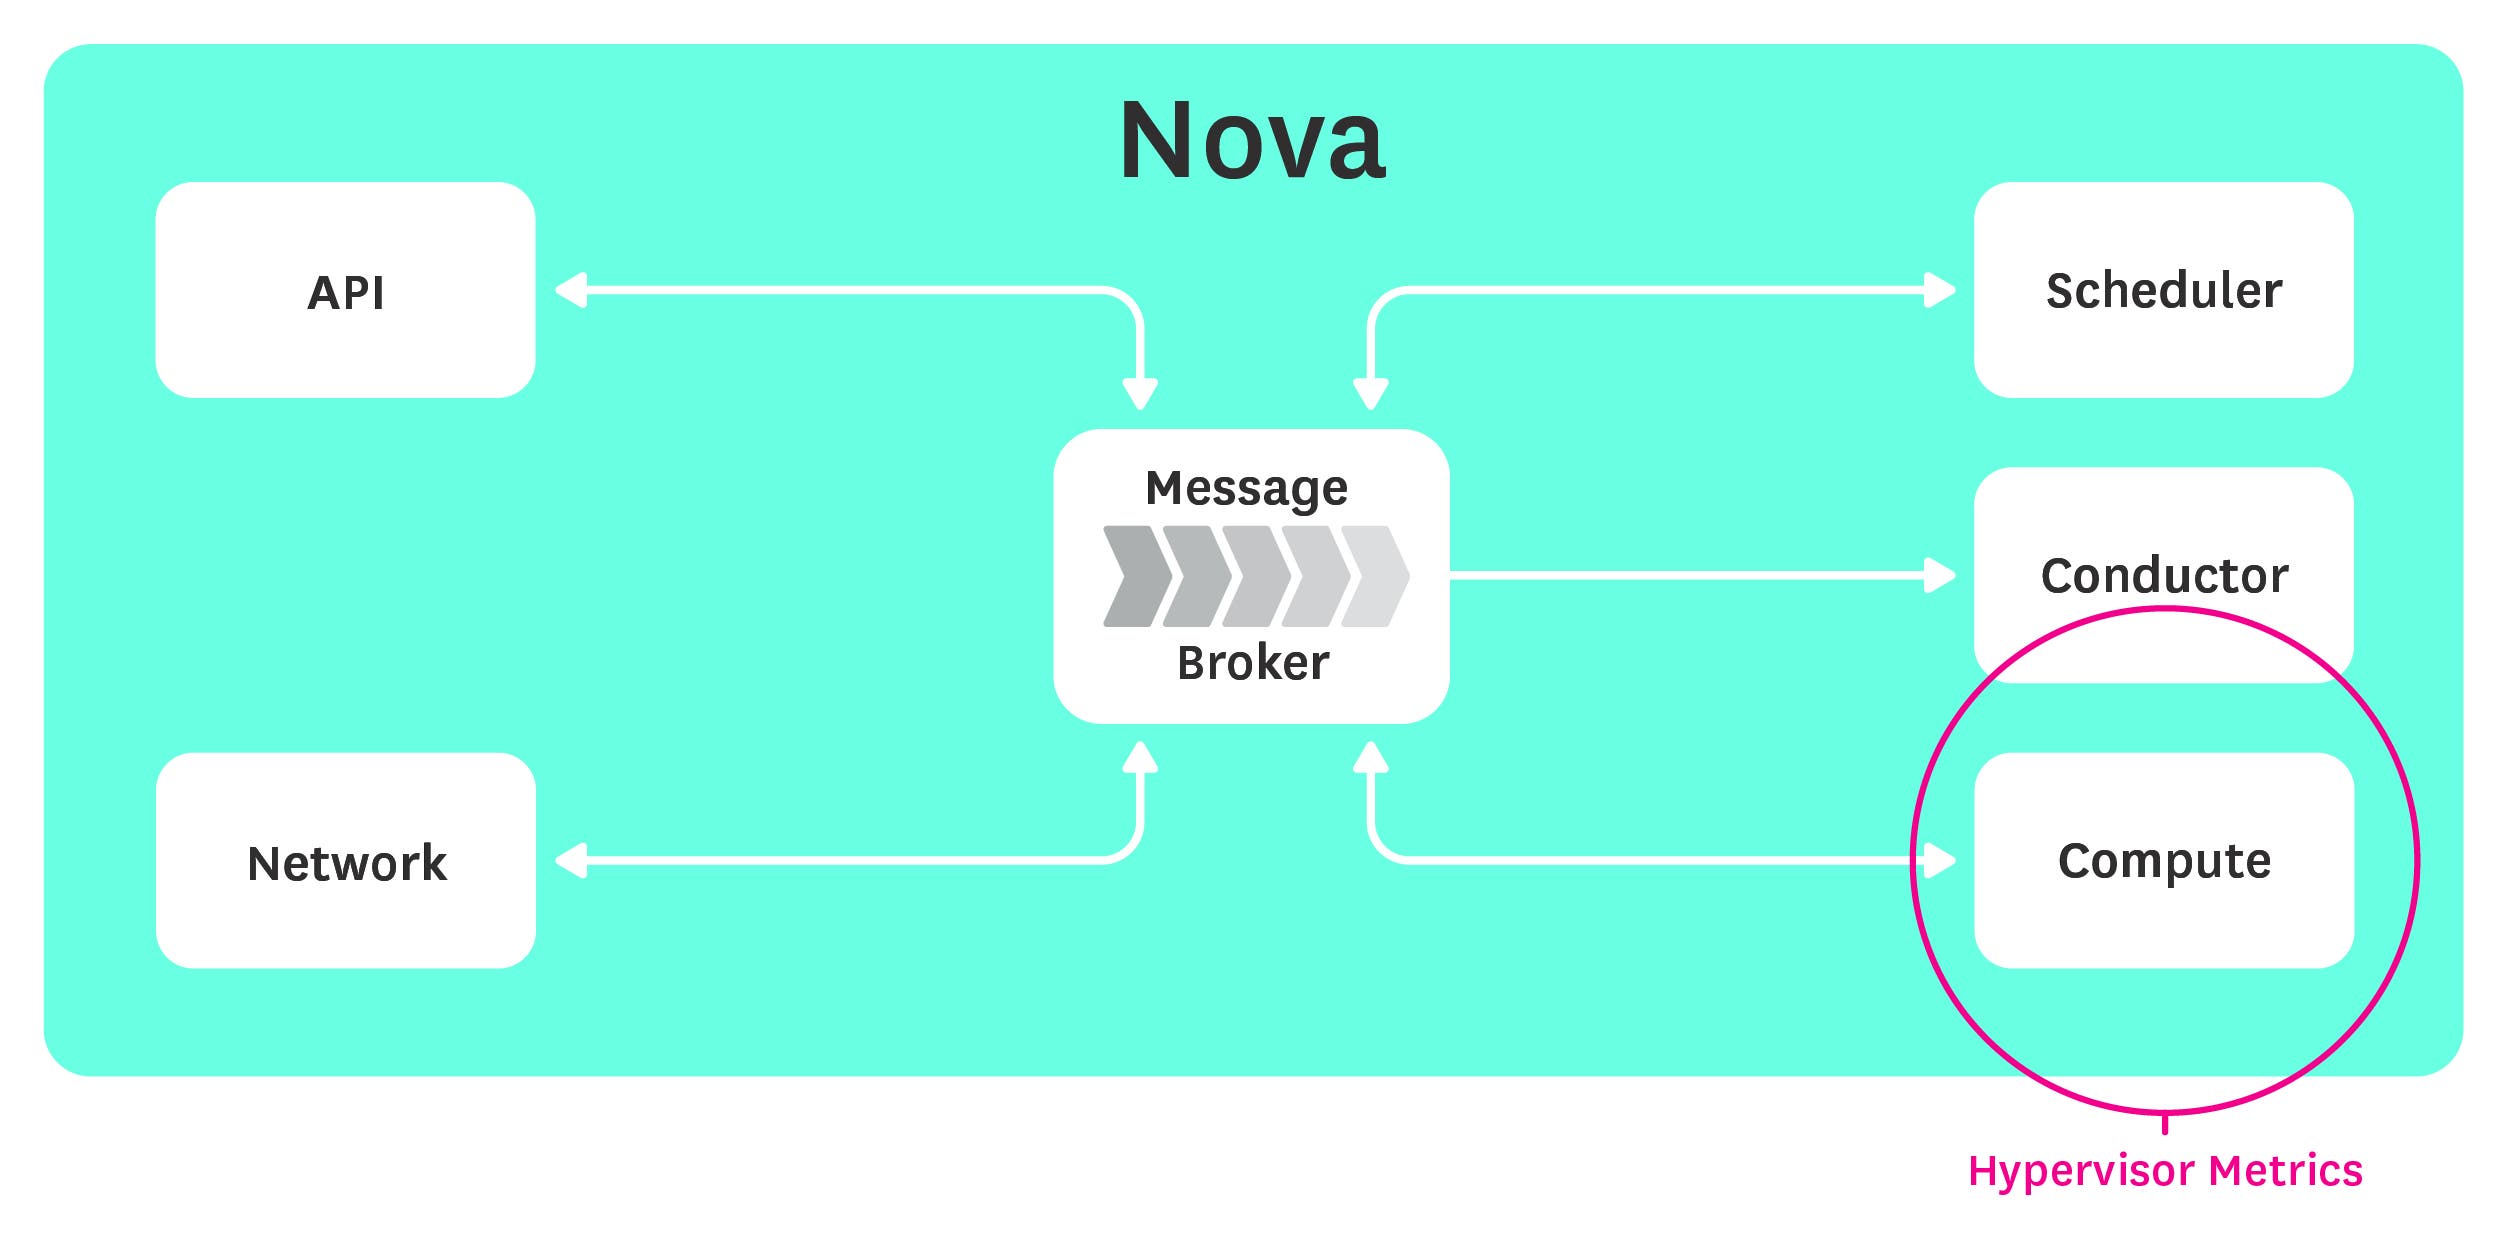
The hypervisor initiates and oversees the operation of virtual machines. Failure of this critical piece of software will cause tenants to experience issues provisioning and performing other operations on their virtual machines, so monitoring the hypervisor is crucial.
Though a number of hypervisor metrics are available, the following subset gives a good idea of what your hypervisors are doing under the hood:
| Name | Description | Metric Type |
|---|---|---|
| hypervisor_load | System load | Resource: Utilization |
| current_workload | Count of all currently active hypervisor tasks | Resource: Utilization |
| hypervisor_up | Count of all active hypervisors | Resource: Availability |
| running_vms | Total number of running virtual machines | Resource: Utilization |
| vcpus_available | Total number of available CPUs | Resource: Utilization |
| free_disk_gb | Free hard drive space in GB | Resource: Utilization |
| free_ram_mb | Amount of memory (in MB) available | Resource: Utilization |
hypervisor_load: Hypervisor load represents the system load over the last minute for a given hypervisor. Extended periods of high hypervisor load could degrade performance and slow down hypervisor operations. If you have busy VMs, expect this metric to rise.

current_workload: The current workload metric is a count of all the currently active hypervisor operations: Build, Snapshot, Migrate, and Resize. Unless you are using OpenStack’s Shared File Systems service, the VMs and hypervisor all share the same I/O resources, so an extended period of high hypervisor workload could lead to I/O bottlenecks, with your instances competing for disk access. This metric, coupled with hypervisor load, gives you a direct view of the work your hypervisor is performing.
running_vms: OpenStack exposes the number of virtual machines currently running, which can be aggregated by host. The maximum number of VMs running at any point in time is bound by available CPU and memory resources. This metric, along with the current workload and hypervisor load, should give you all the information you need to ensure a fair distribution of load across your cluster of compute nodes.
How you monitor the running_vms metric largely depends on your use case—if you are using OpenStack to run critical infrastructure on a constant number of nodes, changes in running VMs are similar to physical hosts going down; you would want to be aware of either event so you can react accordingly. If on the other hand your infrastructure is more dynamic, you may not care about the comings and goings of individual hosts as long as you have enough capacity to keep all your services running smoothly.

vcpus_available: Each hypervisor reports the current number of CPUs allocated and the maximum number available. Using these two metrics, you can compute the number of CPUs currently available.
In a production environment with fairly predictable workloads, adding and removing resources from the computation pool should be an anticipated event. In that case, you would want to monitor and possibly alert on any changes to your number of available VCPUs. In other cases, such as using OpenStack as a development environment, tracking this metric is less important.
Setups with a diminishing number of available CPU resources could benefit from the provisioning of additional Compute hosts. A general awareness of available resources can let you scale your deployment before an increase in demand makes it a necessity. If you are constantly bumping into the resource ceiling, it’s time for more machines.
free_disk_gb: This metric reports the amount of disk space (in gigabytes) currently available for allocation, aggregated by physical host. Maintaining ample disk space is critical, because the hypervisor will be unable to spawn new virtual machines if there isn’t enough available space.
By tracking your free_disk_gb, you can migrate overly large instances to other physical hosts, should space become scarce. You will definitely want to be alerted to diminishing disk space so you can take action and prevent hypervisor errors due to insufficient resources.
free_ram_mb: Memory, like disk space, is an important resource. Without sufficient memory, the hypervisor will be unable to spawn new instances or resize instances to larger flavors. Ensuring adequate memory is essential—insufficient memory will result in hypervisor errors and confused users.
Like free_disk_gb, you will want to be alerted to diminishing memory so you can take appropriate action, whether that means migrating instances or provisioning additional compute nodes.
Nova server metrics
Computing nodes generally constitute the majority of nodes in an OpenStack deployment. The Nova server metrics group provides information on individual instances operating on computation nodes. Monitoring individual Nova servers helps you to ensure that load is being distributed evenly and to avoid the noisy neighbor problem. However, to gain the most visibility into your instances, including the full suite of OS and system metrics, installing a monitoring agent is essential.
| Name | Description | Metric Type |
|---|---|---|
| hdd_read_req | Number of read requests per second | Work: Throughput |
hdd_read_req: In a virtual environment, RAM size is often a limiting constraint on running processes. Monitoring the number of hard drive requests per second can give you an idea of work being performed within virtual machines on your Nova node. Spikes in this metric indicate that a virtual machine may have low RAM, causing it to thrash the disk with constant memory paging. At the very least, awareness of high read rates can inform troubleshooting when diagnosing performance issues within your Nova cluster.
Tenant metrics
Tenant metrics are primarily focused on resource usage. Remember, tenants are just groups of users. In OpenStack, each tenant is allotted a specific amount of resources, subject to a quota. Monitoring these metrics allows you to fully exploit the available resources and can help inform requests for quota increases should the need arise.
| Name | Description | Metric Type |
|---|---|---|
| total_cores_used | Total cores currently in use by tenant | Resource: Utilization |
| max_total_cores | Maximum number of cores allocated to tenant | Resource: Utilization |
| total_instances_used | Total number of instances owned by tenant | Resource: Utilization |
| max_total_instances | Maximum number of instances allocated to tenant | Resource: Utilization |
total_cores_used and max_total_cores: Each tenant has a maximum number of resources allocated, set by a quota. Tracking your per-tenant core usage means you won’t unwittingly bump against that quota-imposed ceiling. Graphing this metric alongside the max_total_cores metric will give you an immediate view into your resource consumption over time and help you determine if additional resources are required by your tenant.
total_instances_used and max_total_instances: Similar to physical resources, the number of instances per tenant is also capped by a quota. Each VM you spin up consumes another instance, and each instance size uses a different number of resources. When setting quotas for internal use, you should keep in mind the projected number of instances you plan to run, as well as the anticipated sizes of those instances.
RabbitMQ metrics
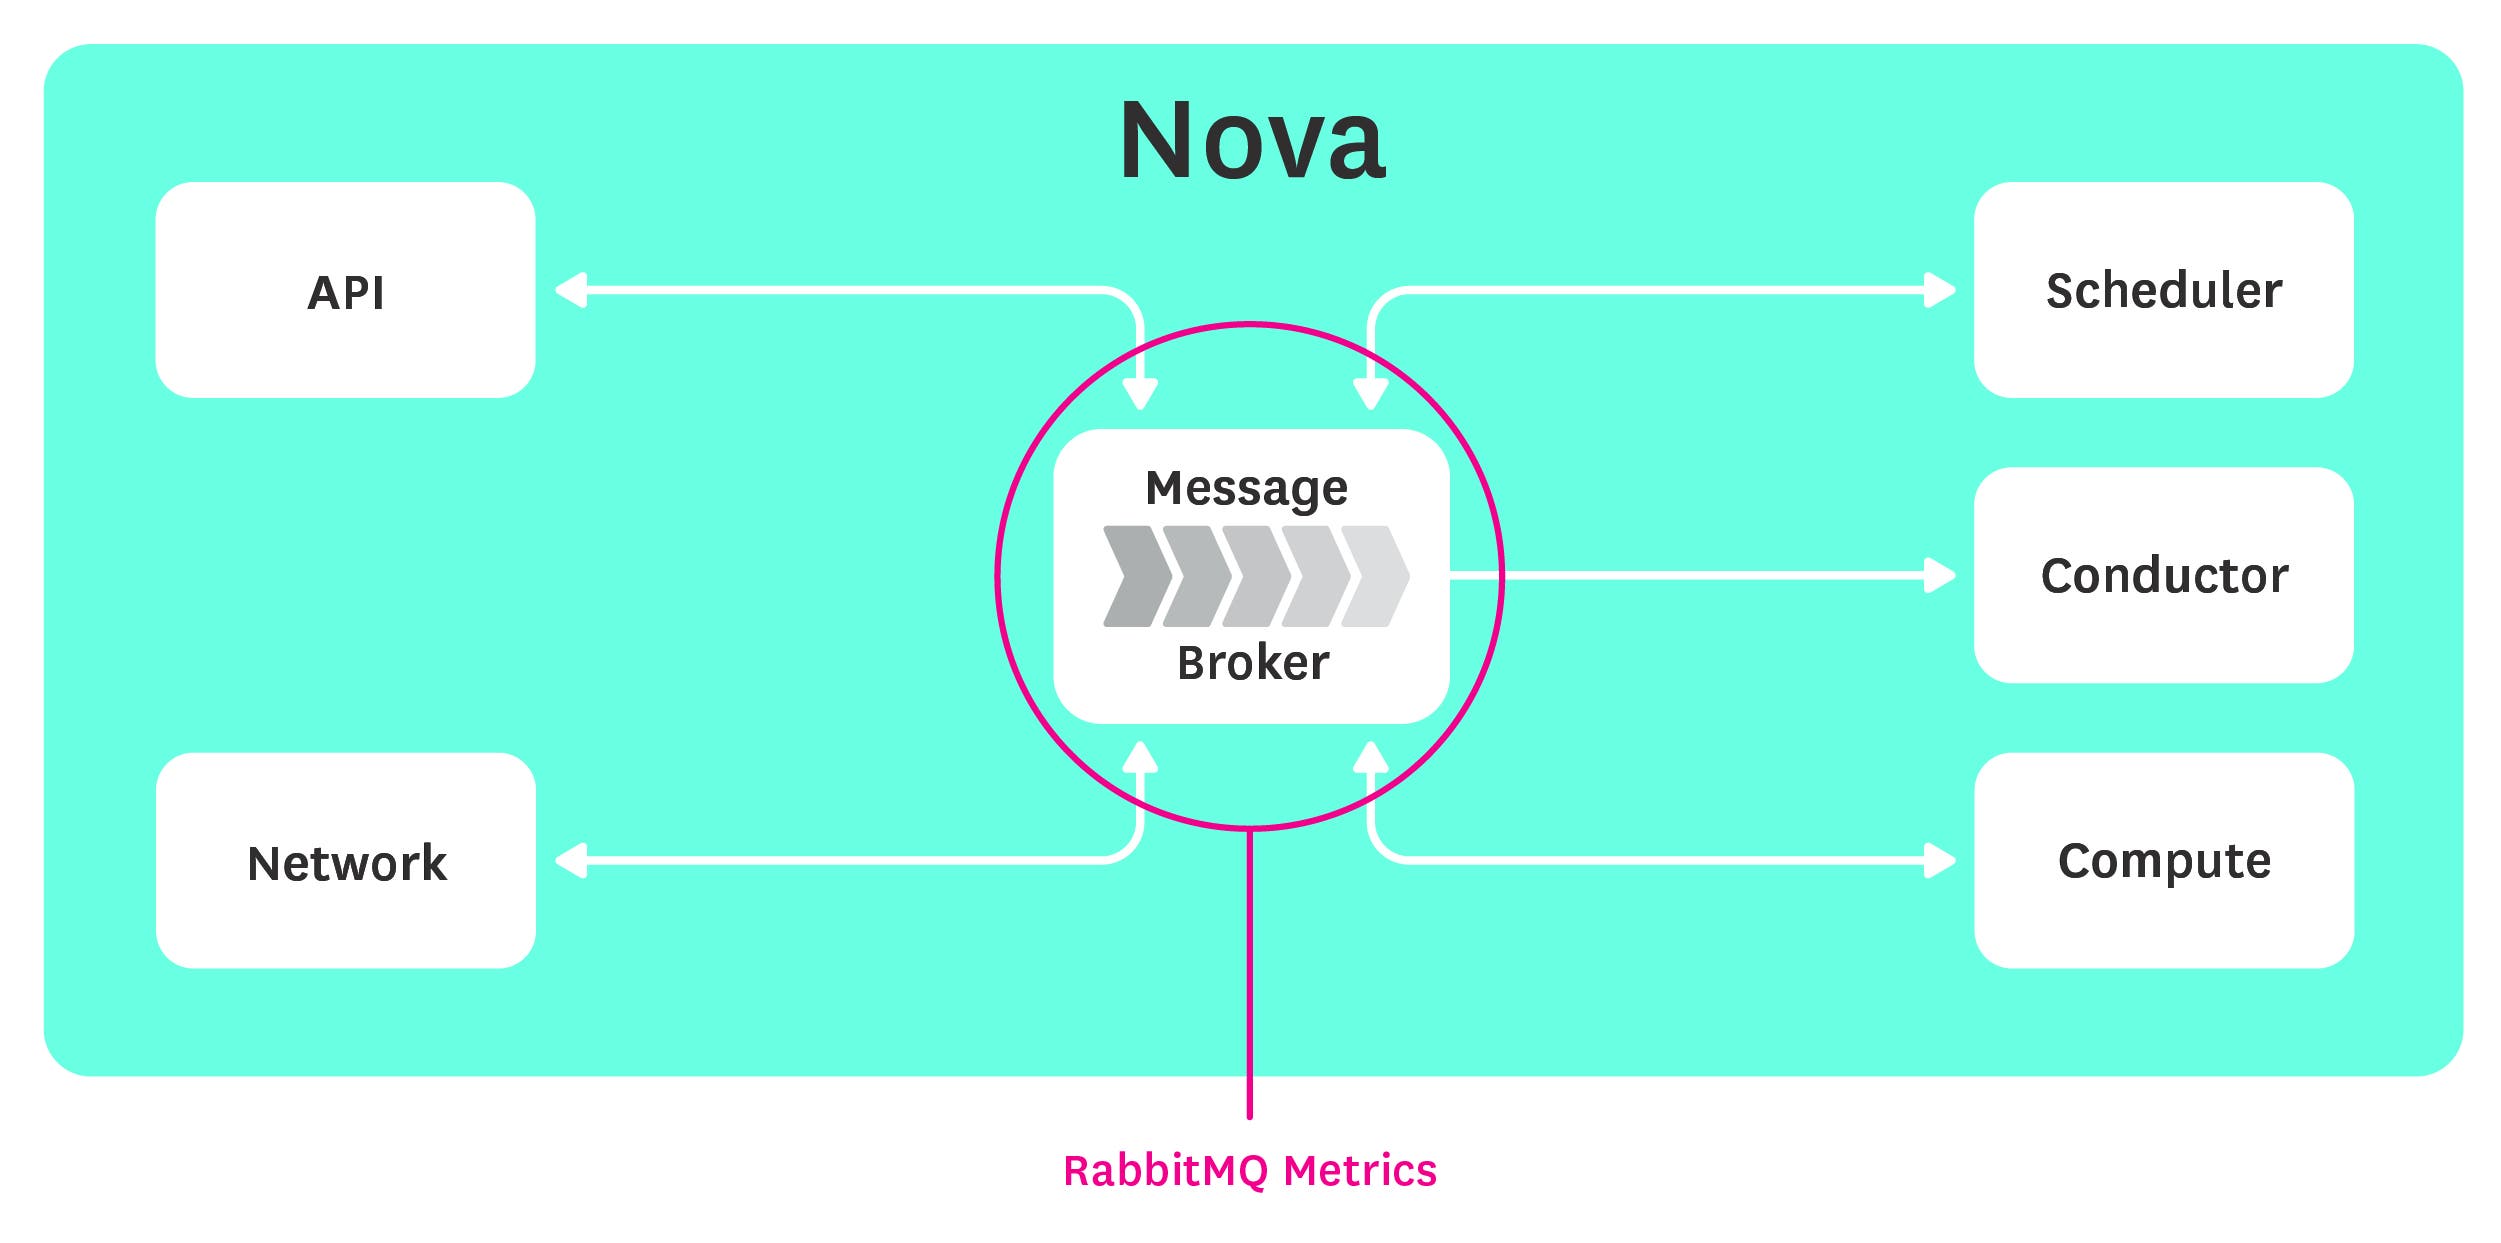
What’s RabbitMQ got to do with OpenStack Nova? RabbitMQ is one of several options for OpenStack’s message-passing pipeline and is used by default. Nova components use RabbitMQ for both remote procedure calls (RPCs) and for internal communication.
RabbitMQ serves both as a synchronous and asynchronous communications channel, and failure of this component will disrupt operations across your deployment. Monitoring RabbitMQ is essential if you want the full picture of your OpenStack environment.
At the very least, you will want to keep an eye on the following RabbitMQ metrics:
| Name | Description | Metric Type |
|---|---|---|
| consumer_utilisation | The proportion of time a queue’s consumers can take new messages | Resource: Utilization |
| memory | Current size of queue in bytes | Resource: Utilization |
| count | Number of active queues (computed) | Resource: Utilization |
| consumers | Number of consumers per queue | Resource: Utilization |
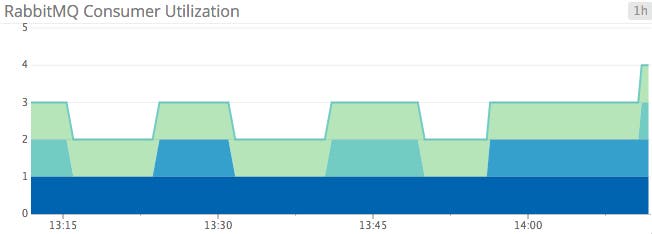
consumer_utilisation: Introduced in RabbitMQ 3.3, this metric (the spelling of which follows the rules of British English) reports on the utilization of each queue, represented as a percentage. Ideally, this metric will be 100 percent for each queue, meaning consumers get messages as quickly as they are published.
A couple of factors can contribute to degraded consumer utilization: network congestion and prefetching. A slow network translates to an inhibited ability for consumers to get new messages from publishers. Prefetching is the number of messages a consumer can receive while processing the current message. A low prefetch setting could keep consumers from taking in new messages while processing older ones. If you are seeing low consumer utilization for extended periods of time, and your prefetch settings are reasonably high, the problem most likely lies in the network.

memory: Like most in-memory message queues, RabbitMQ will begin swapping to disk under memory pressure. In addition to increased latency caused by disk paging, RabbitMQ will preemptively throttle message producers when memory consumption reaches a predefined threshold (40 percent of system RAM by default). Although not often an issue, a significant spike in queue memory could point to a large backlog of unreceived (“ready”) messages, or worse. A protracted period of excessive memory consumption could cause performance issues as well.
count: Queue count represents the current number of RabbitMQ queues. You can compute this metric by counting the number of queues listed by RabbitMQ. A count of zero queues means there is a serious error in your RabbitMQ deployment, necessitating further investigation. Setting up an alert on this metric is a great idea—zero queues means zero messages being passed.
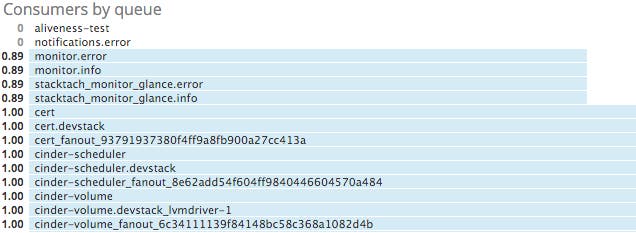
consumers: Similar to the queue count metric, your number of consumers should usually be non-zero for a given queue. Zero consumers means that producers are sending out messages into the void. Depending on your RabbitMQ configuration, those messages could be lost forever.
Generally speaking, there are only a handful of queues that may have zero consumers under normal circumstances: aliveness-test, notifications.info, and notifications.error.
Aliveness-test is a queue for monitoring tools to use. A producer typically creates and consumes a message in this queue to ensure RabbitMQ is operating correctly. Notifications.error and notifications.info are notifications with an associated log level priority. Notifications.error is the error notification message queue, and notifications.info is the queue for informational messages.
Additionally, if you have an OpenStack monitoring tool such as Stacktach in place, you may see a number of consumer-less queues beginning with monitor if your monitoring tool is not actively consuming messages from those queues.
Read more about collecting emitted notifications in part two of this series. Beyond the above queues listed, if your consumer count drops to zero for an extended period of time, you probably want to be alerted.
Notifications
Nova reports certain discrete events via notifications. Because the majority of work performed by Nova is through asynchronous calls, wherein a user initiates an operation and does not receive a response until the operation is complete, listening in on emitted events is necessary to see the full picture at a given point in time.
Furthermore, handling notifications is the only way to get information on the throughput of work done by the hypervisor.
Though Nova emits notifications on about 80 events, the following table lists a number of useful notifications to listen for. The name in the table corresponds to the event_type field included in the notification payload.
| Name | Description | Metric Type |
|---|---|---|
| compute.instance.create.[start/end] | Signals the beginning or end of an instance creation event | Event: Scaling |
| compute.instance.delete.[start/end] | Signals the beginning or end of an instance deletion operation | Event: Scaling |
| compute.instance.resize.prep.start | Signals the beginning of a resize operation | Event: Scaling |
| compute.instance.resize.confirm.end | Signals the end of a successful resize operation | Event: Scaling |
For most events, correlating the start and end notifications and their associated timestamps will give you the execution time for hypervisor operations. Some operations, like resizing an instance, perform preparation and sanity checks before and after the action, so you will need to take these events into account as well to get an accurate sense of performance.
Conclusion
In this post we’ve outlined some of the most useful metrics and notifications you can monitor to keep tabs on your Nova computing cluster. If you’re just getting started with OpenStack, monitoring the metrics and events listed below will provide good visibility into the health and performance of your deployment:
- hypervisor_load
- running_vms
- free_disk_gb
- free_ram_mb
- queue memory
- queue consumers
- consumer_utilisation
In the future, you may recognize additional OpenStack metrics that are particularly relevant to your own infrastructure and use cases. Of course, what you monitor will depend on both the tools you have and the OpenStack components you are using. See the companion post for step-by-step instructions on collecting Nova and RabbitMQ metrics.
Source Markdown for this post is available on GitHub. Questions, corrections, additions, etc.? Please let us know.


