Evan Mouzakitis
OpenStack, the open-source cloud-computing software platform, is primarily deployed as infrastructure-as-a-service; it can be likened to a version of Amazon Web Services that can be hosted anywhere. Developed as a joint project between Rackspace and NASA, OpenStack is about five years old and has a large number of high-profile supporters, including Google, Hewlett-Packard, IBM, and Intel.
OpenStack is an ambitious project with the goal of providing an open alternative to cloud providers like AWS, Azure, DigitalOcean, Joyent, etc. It features a modular architecture with a current list of 16 services, even incorporating OpenStack meta-services like Ceilometer, OpenStack’s billing/telemetry module.
As of version 5.6.1 of the Datadog Agent, you can access a number of metrics emitted by Nova (OpenStack’s computing controller) and Neutron (OpenStack’s network management module).

Compute (Nova)
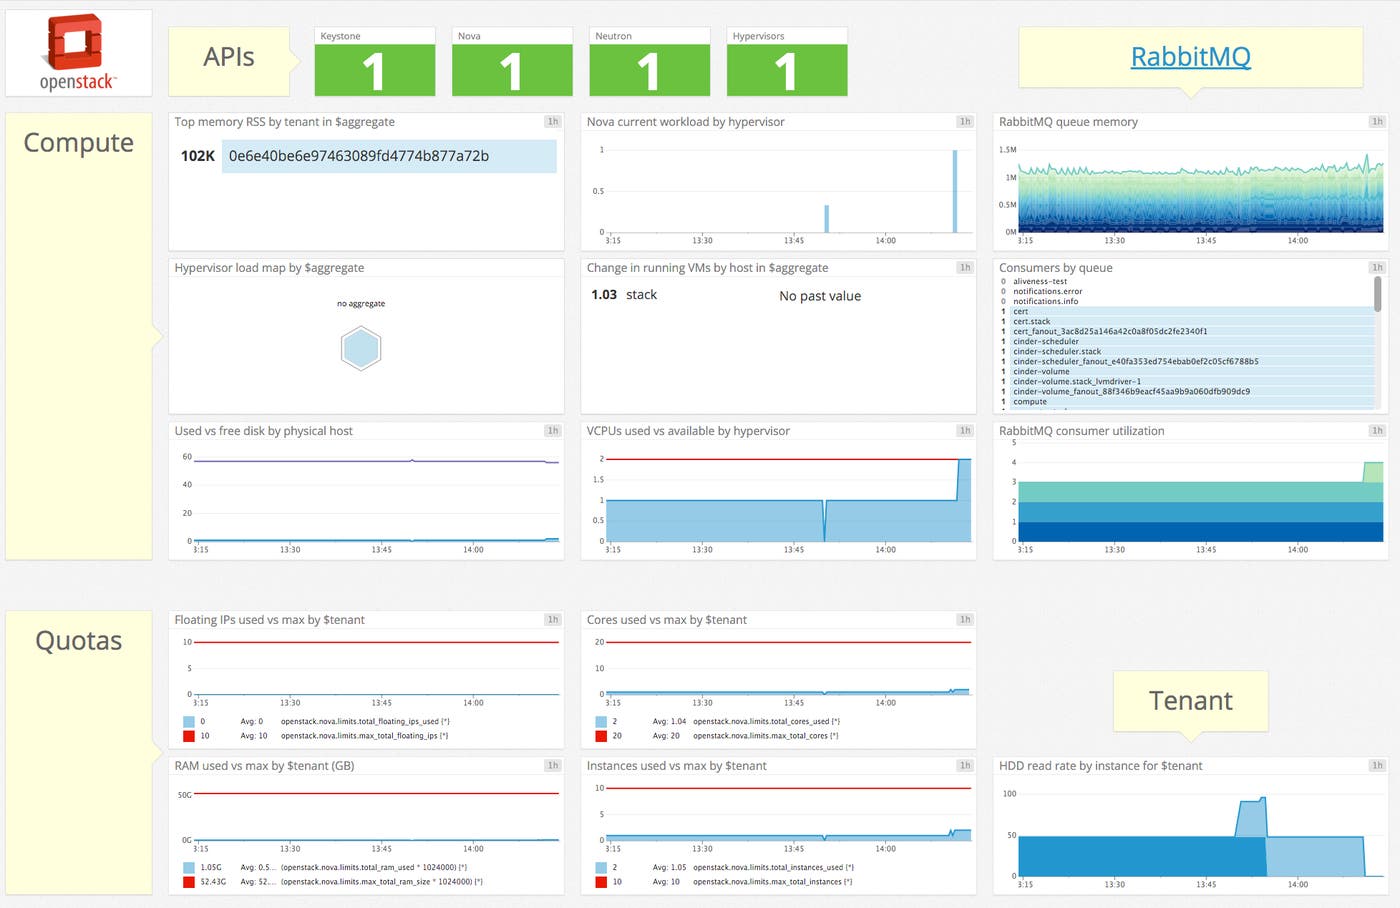
Nova is the computational module of OpenStack, accounting for the majority of nodes in a typical OpenStack deployment. Datadog's OpenStack integration gives immediate, in-depth visibility into this critical component of your infrastructure, including:
current workload (a count of all the Build, Snapshot, Migration, and Resize operations currently active)
number of virtual machines and instances running
hypervisor metrics
project/tenant metrics like image, personality, and security group information
In addition to higher-level metrics, you also get typical host-level performance statistics, like CPU and RAM usage.
No longer a black box, with the Datadog OpenStack integration you have access to the metrics you need to better coordinate load across your Nova cluster and properly tune your nodes.
Network fabric and identity management (Neutron and Keystone)
Neutron is OpenStack’s network fabric controller. It was created with the goal of simplifying OpenStack network configuration.
Keystone can be likened to Amazon’s IAM service, providing an identity management and access control layer.
Datadog’s integration currently provides up/down information on the status of both these mission-critical services. But this is only the beginning—there is much more to come.
All your metrics, in one place
With this integration, you get all the power of Datadog applied to your OpenStack deployment. In addition to collecting, visualizing, and aggregating metrics that are specific to OpenStack, Datadog can also correlate metrics with other systems or software in your stack, alert on abnormal application behavior, automatically detect outliers, and more.
Try it today
If you are already a Datadog customer, you can get up and running right away by enabling the OpenStack integration and configuring the necessary policy changes. If not, try it out today with a two-week free trial.
Learn about OpenStack monitoring
Our three-part series about OpenStack monitoring is a great resource for anyone looking to learn about the most important OpenStack metrics and events.
More on the way!
Our engineers are continually working on new features and integrations with other OpenStack modules to enhance your infrastructure monitoring. There’s more to come, so stay tuned!

