Maxim Brown
Datadog’s AWS integration lets you connect CloudWatch to Datadog in order to automatically collect metrics from multiple AWS services—including EBS. Datadog’s more than 1,000 integrations let you correlate AWS metrics with those from other services in your environment. And your data will be accessible for 15 months at full granularity.
For even greater visibility into your Amazon EBS volumes and your entire infrastructure, you can install the Datadog Agent on your instances. This enables you to gather system-level metrics from your volumes, including disk usage, at 15-second resolution. And with Datadog APM and the addition of logging, installing the Datadog Agent provides a fully unified monitoring platform.
Monitoring Amazon EBS volumes with Datadog
There are two ways to start using Datadog to monitor your EBS volumes. You can enable the AWS integration to automatically pull in all metrics outlined in the first part of this series, or you can install Datadog’s Agent on your EC2 instances to collect detailed metrics from your volumes, applications, and infrastructure.
These approaches can be used in a complementary fashion. The AWS integration allows you to pull the full suite of AWS metrics into Datadog immediately, whereas the Agent allows you to monitor your applications and infrastructure with greater detail and depth.
Enable the AWS integration
The fastest way to start monitoring EBS metrics in Datadog is to enable the AWS integration. This lets Datadog collect metrics from EBS and the rest of the AWS platform via the CloudWatch API without needing to install anything on your instances.
Activating the integration requires correctly delegating AWS IAM roles and giving the Datadog role read-only access. Once you’ve set up the Datadog role within AWS and connected it to your Datadog account, you will start to see EBS metrics (as well as metrics for EC2 and any other AWS services you are monitoring with Datadog) flowing into Datadog. You can then visualize and monitor them on your dashboards.

You can create fully customized dashboards that meet your specific monitoring needs. For instance, you can view your EBS metrics alongside data from EC2 or other AWS services. You can also bring in application performance metrics to correlate throughput, errors, and latency with key resource metrics from the volumes those applications rely on.
Deploying the Agent
The Datadog Agent is open source software that can collect and forward metrics, logs, and request traces from your instances.
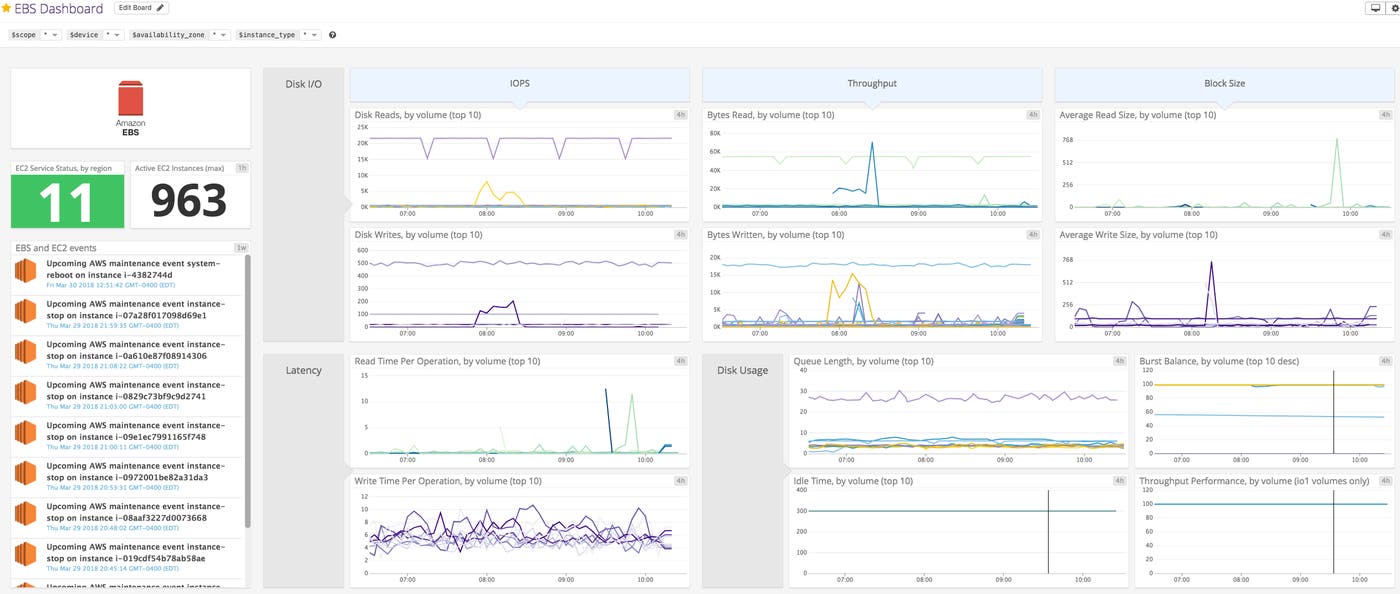
Visualize and alert on key metrics from all your EBS volumes with Datadog.
Once the Agent is installed on an instance, it will automatically report system-level metrics for that instance and any EBS volumes that are mounted to it. You can also enable integrations for any supported applications and services that are running on your instances to begin collecting metrics specific to those technologies.
Installing the Agent
The Agent is installed on the root volume of an instance. On most platforms this can be done with just a one-line command. For example, to install the Agent on an instance running Amazon Linux, simply use the following:
DD_API_KEY=<API_KEY> DD_AGENT_MAJOR_VERSION=7 bash -c "$(curl -L https://raw.githubusercontent.com/DataDog/datadog-agent/master/cmd/agent/install_script.sh)"You should then see your instance reporting metrics in your Datadog account. You can also quickly and easily automate deployment of the Agent across your entire infrastructure with popular configuration management tools like Chef, Puppet, and Ansible, or to your container fleet via Docker or Kubernetes. See the Datadog Agent documentation for more information.
The screenshot below shows a default host dashboard for an EC2 instance with the Agent installed. You can see that both CloudWatch EC2 and EBS metrics are automatically gathered. In addition, Datadog’s system check collects instance- and volume-level metrics that are not automatically available through CloudWatch, such as disk usage.

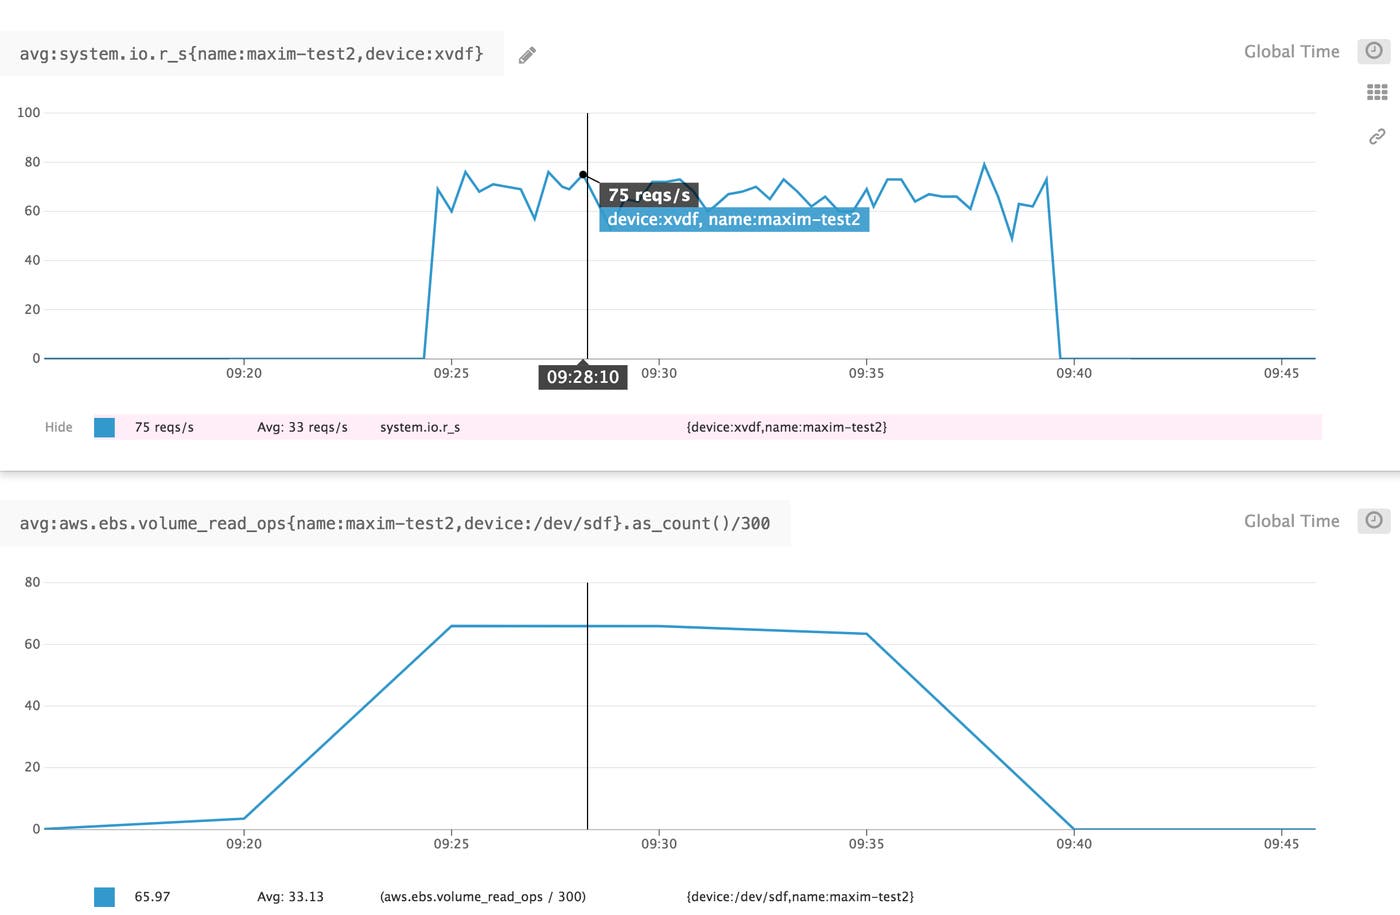
Compared to monitoring only the metrics that CloudWatch reports, installing the Agent provides a number of benefits. You can view many of the same disk I/O metrics that are collected by CloudWatch, but the Agent collects them at 15-second intervals, providing much higher resolution. For example, the screenshot below compares the number of read operations reported by the Agent’s system check (top) with that reported by the EBS integration (bottom) for the same volume.

Besides the difference in granularity, note that the volume or device name is different. This is because the Agent is reporting from within the instance and will report any mounted volume names as they are identified by the kernel’s block device driver, which may be different than how CloudWatch lists them. In this case, the device name sdf reported by CloudWatch is labeled as xvdf by the system check. See more information about device naming here. In Datadog, tags make it easy to see that each device name comes from the same source. Here, both are identified by the same host name.
Getting the Agent to work for you
Installing the Agent also enables you to begin tracing requests with Datadog APM after instrumenting your applications. With Datadog Agent versions 6 and later, you can take advantage of Datadog log management to collect logs from the applications and technologies running on your EC2 instances and attached volumes. This includes custom log collection as well as logs from Datadog’s integrations with popular technologies like Apache, NGINX, HAProxy, IIS, Java, and MongoDB. With combined aggregation of metrics, distributed request traces, and logs, Datadog provides a unified platform for full visibility into your infrastructure.
If you are running containers on your instances, Datadog’s Live Container view gives you complete coverage of your fleet, with metrics reported at two-second resolution. And Live Process monitoring means you have the same level of visibility into all processes running across your entire distributed architecture.
Slicing and dicing Amazon EBS volumes with tags
All of your monitored EBS volumes will be attached to an EC2 instance as either a root volume or a mounted device. So being able to filter to show the EBS metrics for a particular set of instances can help isolate the source of a problem. Tags enable you to easily slice your hosts and drill down into particular problem areas in your infrastructure.
In addition to any custom tags you add to the instance, Datadog imports all of CloudWatch’s EC2-specific dimensions—such as InstanceType and ImageId—as default tags. Datadog automatically collects metrics from instances across all regions, so region and availability-zone are also imported as tags attached to all of your instances, along with other EC2 metadata such as name, security-group, and, if the instance is part of an ECS group, the ECS cluster name.
Advanced alerting
Once Datadog is gathering your EBS metrics and events, you can easily set up alerts for any potential issues. Tag-based alerting allows you to monitor large groups of EC2 instances and their attached EBS volumes, without having to update your alerting rules as your infrastructure changes. Tags let you filter or scope your alerts to specific instance groups and automatically monitor new instances that include the tag. For example, you may want to create an alert that monitors disk read operations averaged by device for all EBS volumes attached to instances with a certain role. If disk read levels increase and trigger the alert, you can be notified and take action, like booting up new instances to shoulder the load.
You can also create alerts based on events from AWS. As discussed in part one, it is important to monitor events to head off potential availability or performance issues, or to be notified if you need to migrate important data from a soon-to-be-terminated instance. Datadog can alert your team, for example, if more than a set number of instances in a single availability zone are scheduled for maintenance.
Datadog alerts allow you to move beyond monitoring based on fixed thresholds to effectively identify issues in dynamic environments. With sophisticated alerting features like anomaly and outlier detection, Datadog can automatically notify you of unexpected instance behavior. And forecasting lets you stay ahead of future problems in your infrastructure and applications. For example, you might want to create a forecast alert for a volume’s burst balance that will notify you ahead of time if the balance is predicted to cross a certain threshold. This can give you time to investigate if there is some kind of problem, or to scale your volumes up to accomodate a rise in resource demand before you experience any sort of performance throttling from an exhausted burst bucket.

Getting started
In this post, we’ve walked you through integrating Amazon EC2 and EBS with Datadog so you can visualize and alert on key metrics from all your volumes. Monitoring your instances and any attached EBS volumes with Datadog gives you critical visibility into what’s happening in your core application infrastructure, and the rich suite of Datadog integrations with other applications and services means you can get a complete view of your entire environment.
If you don’t yet have a Datadog account, you can sign up for a free 14-day trial and start monitoring your cloud infrastructure, your applications, and your services today.
Source Markdown for this post is available on GitHub. Questions, corrections, additions, etc.? Please let us know.


