John Matson
We are excited to announce that log management is now generally available in Datadog. You can now enrich, monitor, and analyze logs from all your systems for troubleshooting, auditing, visualization, and alerting.
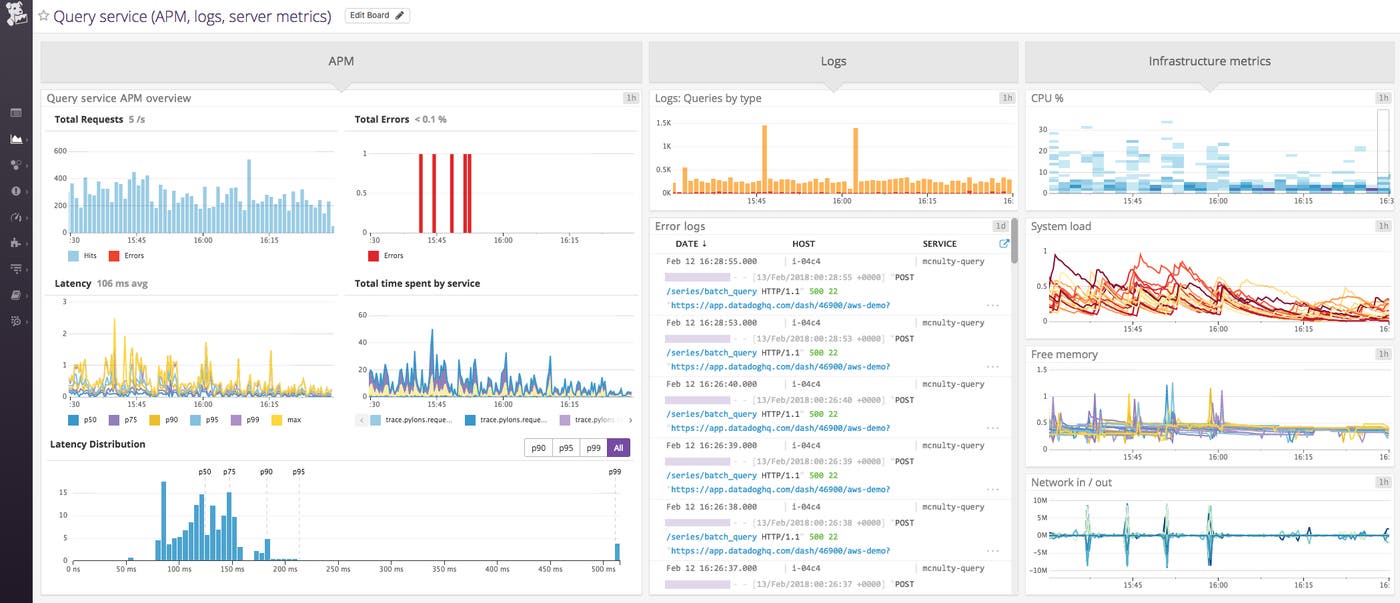
Datadog log management becomes even more powerful when you unite the three pillars of observability—metrics, tracing, and logs—in one integrated platform. With this addition, you can now visualize all your data in comprehensive dashboards, build alerts that trigger on data from any source, and pivot smoothly between views for rapid troubleshooting. Exploring and correlating your monitoring data without the friction of switching contexts is especially important during critical outages, when every minute is valuable.
Unifying the three pillars of observability
Whatever the source—logs, request traces, or metrics—Datadog automatically collects and tags data from all your tools, platforms, and services. With this automatic correlation and grouping of data, the Datadog user interface allows you to move seamlessly and quickly between related sources of monitoring data without switching tools. For instance, in a click you can jump from a timeseries graph of metrics to a time-scoped set of logs from the same segment of your infrastructure. Similarly, you can put your logs in a broader context of utilization or performance by pivoting from any log entry to a dashboard of resource metrics from the host, or to distributed tracing and APM for the service.
Unify your logs, metrics, and distributed traces with Datadog log management.
Open-ended integrations
With the addition of log management, many of the Datadog monitoring integrations will start collecting and enriching log data without the need for external log processors, parsing rules, etc. At the time of GA this list includes technologies such as Apache, NGINX, Docker, HAProxy, MySQL, PostgreSQL, MongoDB, Varnish, Java, Python, C#, Node.js, Ruby, Go, AWS CloudTrail, AWS ELB, AWS ALB, Amazon RDS, Amazon SNS, and AWS Lambda.
Once you set up an integration to send logs, Datadog automatically incorporates key attributes about your logs as facets, which allow you to search, filter, and aggregate your data. Some examples of facets include HTTP status codes for your web logs so you can quickly drill down to errors, or security groups for your CloudTrail logs so you can see who did what, and when.
And if you’re already using a log processor or collector such as rsyslog, Fluentd, Logstash, or syslog-ng, Datadog can collect logs from your existing tools.
Log-management pipelines

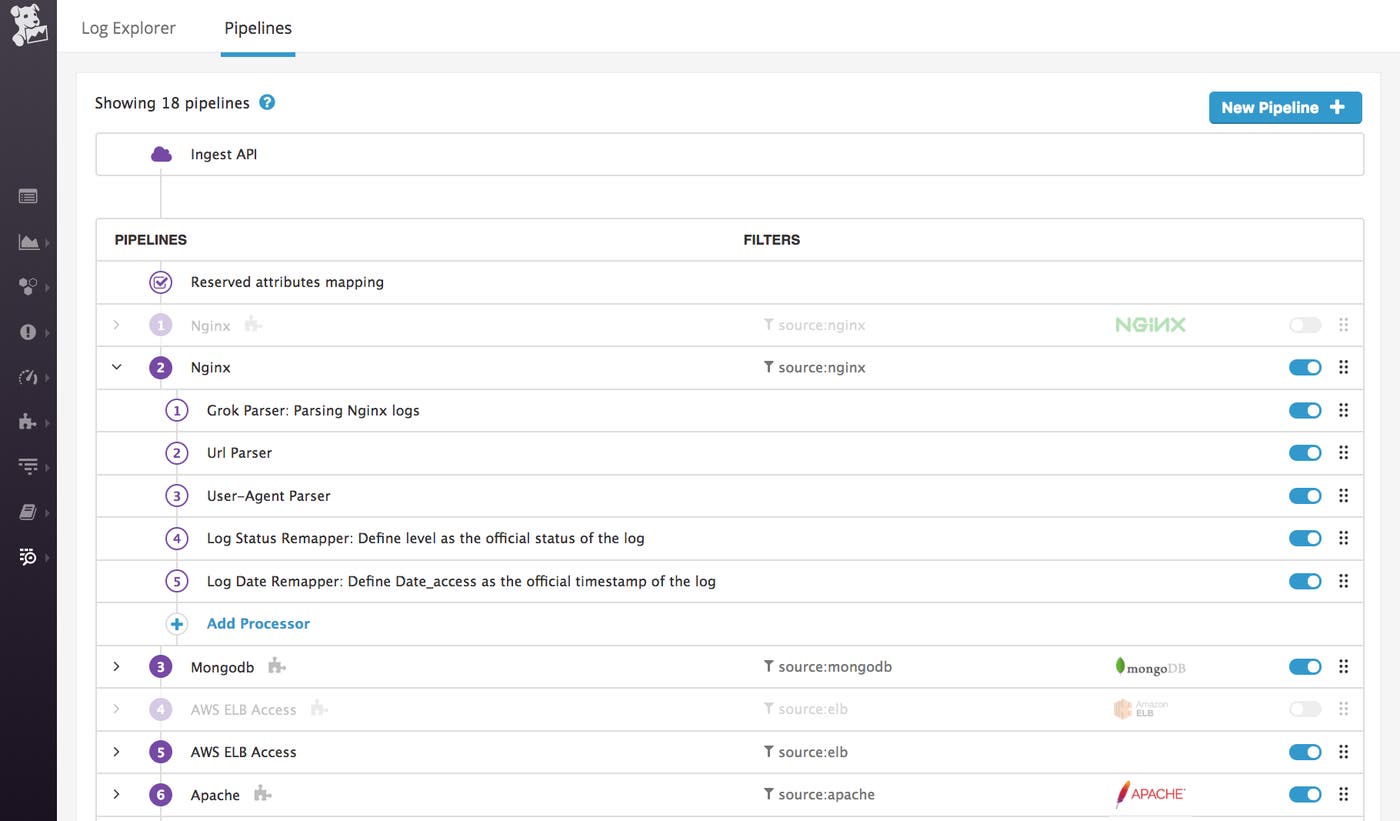
Whether your logs come from a built-in integration or a custom service, they pass through customizable processing and analytics pipelines that parse and enrich your logs. On the Pipelines page, you can apply filters, then define a series of processing steps that extract meaningful information or attributes from semi-structured text. Those attributes can then be used to filter or aggregate your data for visualization, alerting, and faceted search.
Visualizing and alerting on log data

You can add filtered log streams or graphs of log analytics to your Datadog dashboards, so you can view log data alongside relevant metrics from the infrastructure and service-level data from Datadog APM.
You can also build alerts that evaluate the contents of your logs—so you can get notified whenever a particular exception occurs in unacceptable numbers, or when the number of suspicious login attempts suddenly spikes. As with all Datadog alerts, you can notify individuals or teams via services like Slack, PagerDuty, or OpsGenie, or you can create tickets in workflow systems like JIRA or ServiceNow.
Explore your logs
The Log Explorer page makes it easy and intuitive to navigate your data for troubleshooting or open-ended exploration. You can quickly filter your logs and drill down to any part of your infrastructure or applications using faceted or full-text search. You can then export any query from the Log Explorer to the Monitors UI to build alerting rules around incoming log data.
Analyze your logs
The Log Explorer also features an analytics view that enables you to graph trends in your logs. So you can break down your logs by attributes such as status (error, warn, info), then drill through to see the actual log messages for any errors, or visualize the 95th percentile response times of each of your HTTP servers.
Get started
To unify your logs, metrics, and distributed request traces in one platform, try Datadog log management today. And if you're not yet using Datadog, you can sign up for a free trial here.

