David M. Lentz
Datadog’s AWS integration brings you deep visibility into key AWS services like EC2 and Lambda. We’re excited to announce that we’ve simplified the process for installing the AWS integration. If you’re not already monitoring AWS with Datadog, or if you need to monitor additional AWS accounts, our 1-click integration lets you get started in minutes.
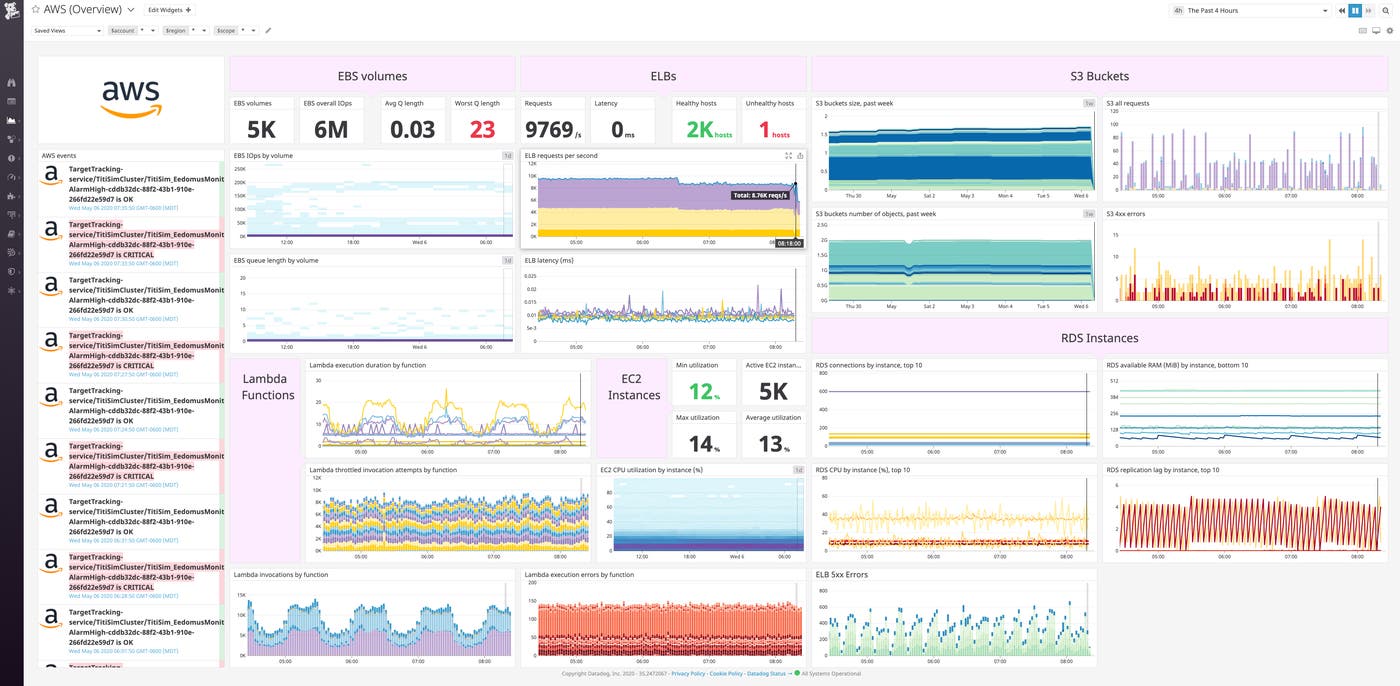
To configure Datadog to monitor AWS, you need to create an IAM role and an associated policy, associate that role with an external AWS account, and deploy a Lambda function. The new 1-click installation automates this configuration using CloudFormation, so you can quickly start to gather metrics, logs, and traces from your AWS services.
Serverless visibility with the Datadog Forwarder
AWS Lambda makes serverless functions easy to deploy and update. Now, our AWS 1-click integration makes them easy to monitor by automatically including the Datadog Forwarder. The Datadog Forwarder is a Lambda function that brings your serverless metrics, logs, and traces into Datadog so you can explore, analyze, and alert on them.
Datadog collects standard Lambda metrics like invocation count, error rates, and total execution time. You can also collect custom metrics and enable Lambda enhanced metrics to extend your serverless visibility even further.
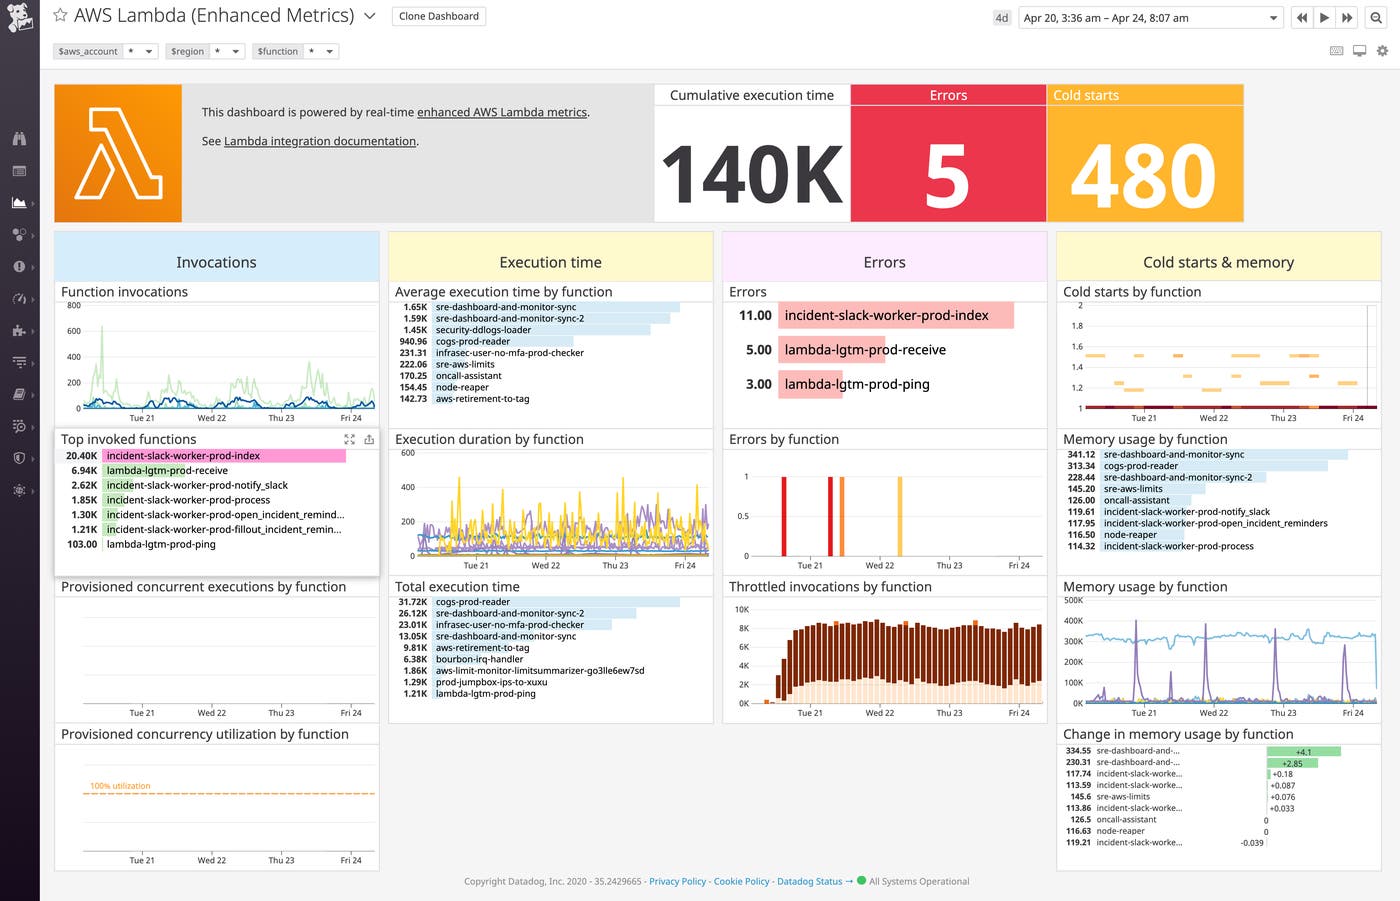
The screenshot above shows Datadog’s pre-built Lambda enhanced metrics dashboard, which visualizes duration, cost, memory usage, cold starts, and other enhanced metrics from Lambda. It’s easy to add graphs to your AWS dashboards so you can display custom metrics and key business metrics. Of course, you can also create alerts based on any of your Lambda metrics to automatically notify your team of issues as they arise.
To bring context to the serverless metrics you see on your dashboards, the Datadog Forwarder collects logs from each Lambda function’s CloudWatch log group and automatically ships them to Datadog. The AWS 1-click integration process automatically sets up Log Rehydration™, so even your archived logs are available if you need to search and analyze them.
The AWS 1-click integration also collects traces from your serverless functions, via AWS X-Ray and through Datadog APM’s native support for Lambda tracing. This means you can visualize which Lambda functions—and even non-Lambda services—were involved in fulfilling any request.
App Analytics allows you to search and filter traces by tag—custom application tags you’ve applied (e.g., customer-id) as well as infrastructure-level tags that are applied automatically (e.g., availability-zone). Applying the same tags to your metrics and logs helps you understand user experience by seeing the full context of any single trace.
Quick visibility into the wider AWS landscape
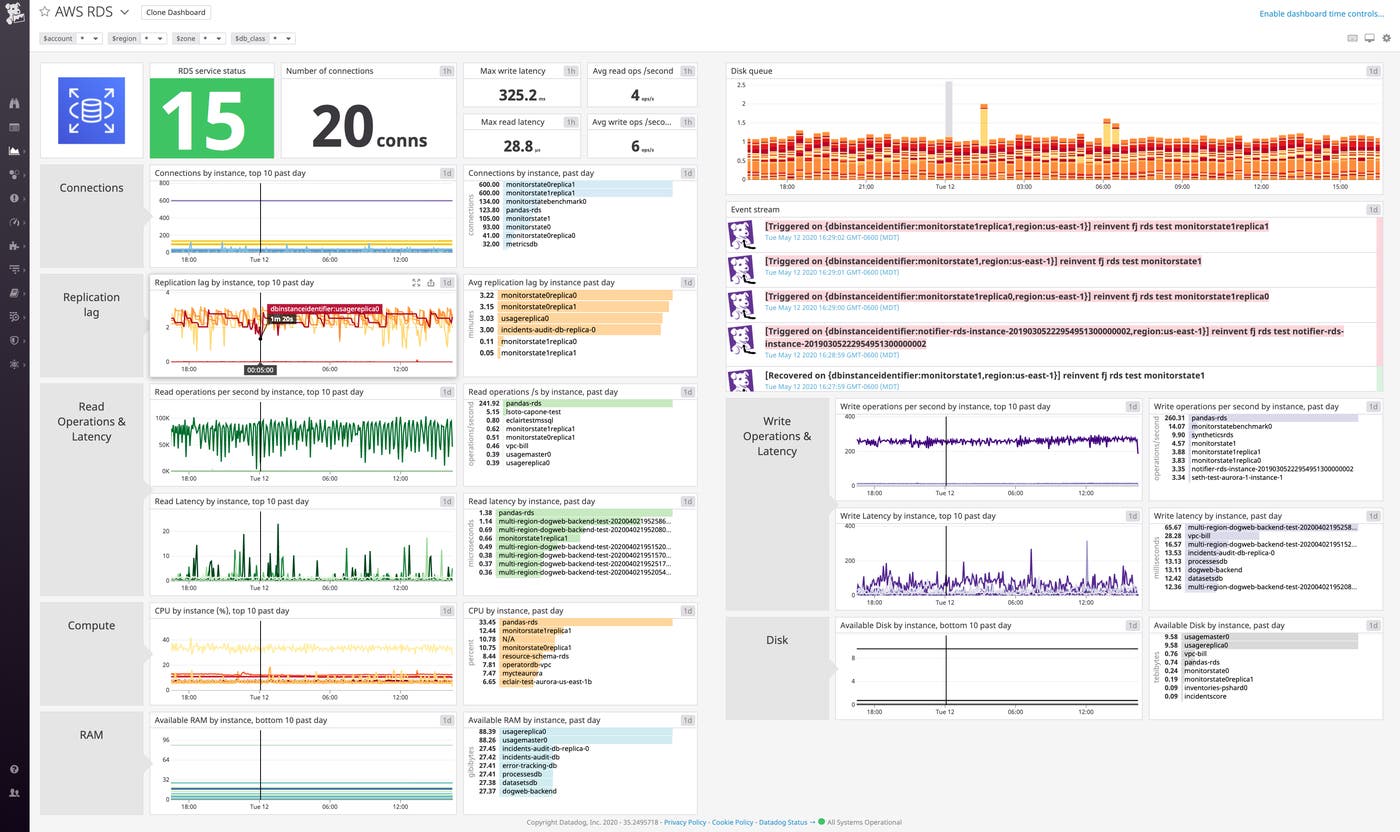
Monitoring your Lambda functions is only part of understanding the overall health and performance of your AWS-based workloads. Our 1-click integration brings visibility to the AWS services that power your applications, including RDS, EC2, Elasticache, and more. You can view built-in dashboards for many of these services, so you have instant insight into your AWS environment.
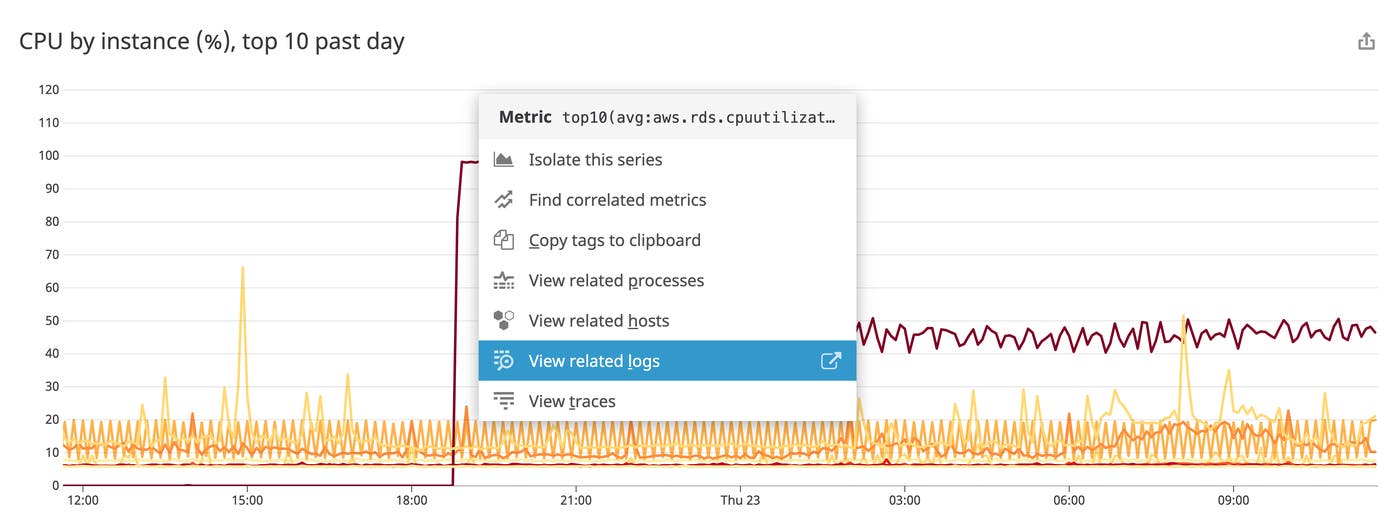
In addition to Lambda, the Datadog Forwarder will also immediately begin collecting logs from any AWS service you’ve configured to log to CloudWatch or S3. In the screenshot below, the graph shows CPU utilization across a group of RDS instances and illustrates how to pivot to related logs by clicking on a point on the graph.
To learn how to enable logging on various AWS services, see our documentation.
Click here
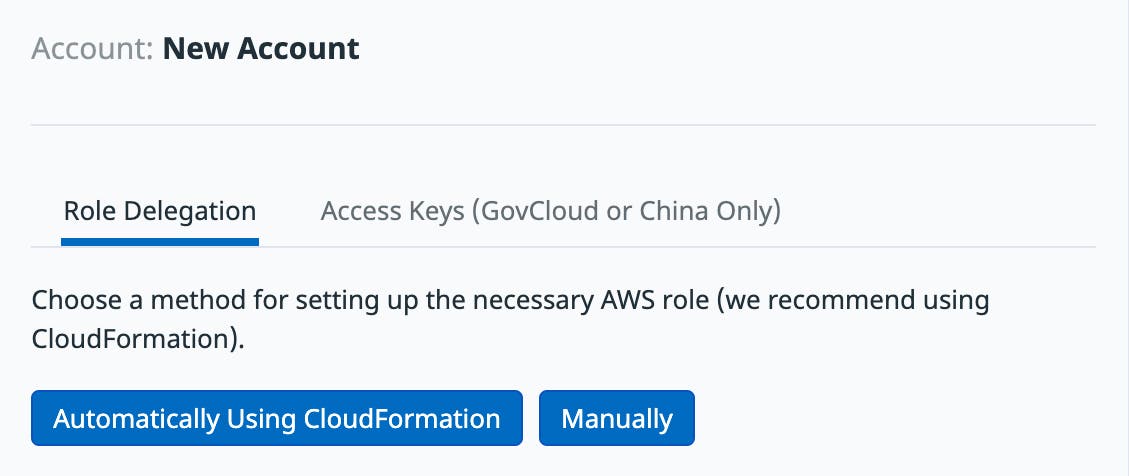
To begin monitoring AWS with Datadog (or to configure additional AWS accounts to monitor), navigate to the Configuration tab on the AWS integration tile. Choose either Install Integration (if you’re not already monitoring AWS with Datadog) or Add another account (if you’re setting up an additional AWS account to monitor). In the Account: New Account form (shown below), click the Automatically Using CloudFormation button.
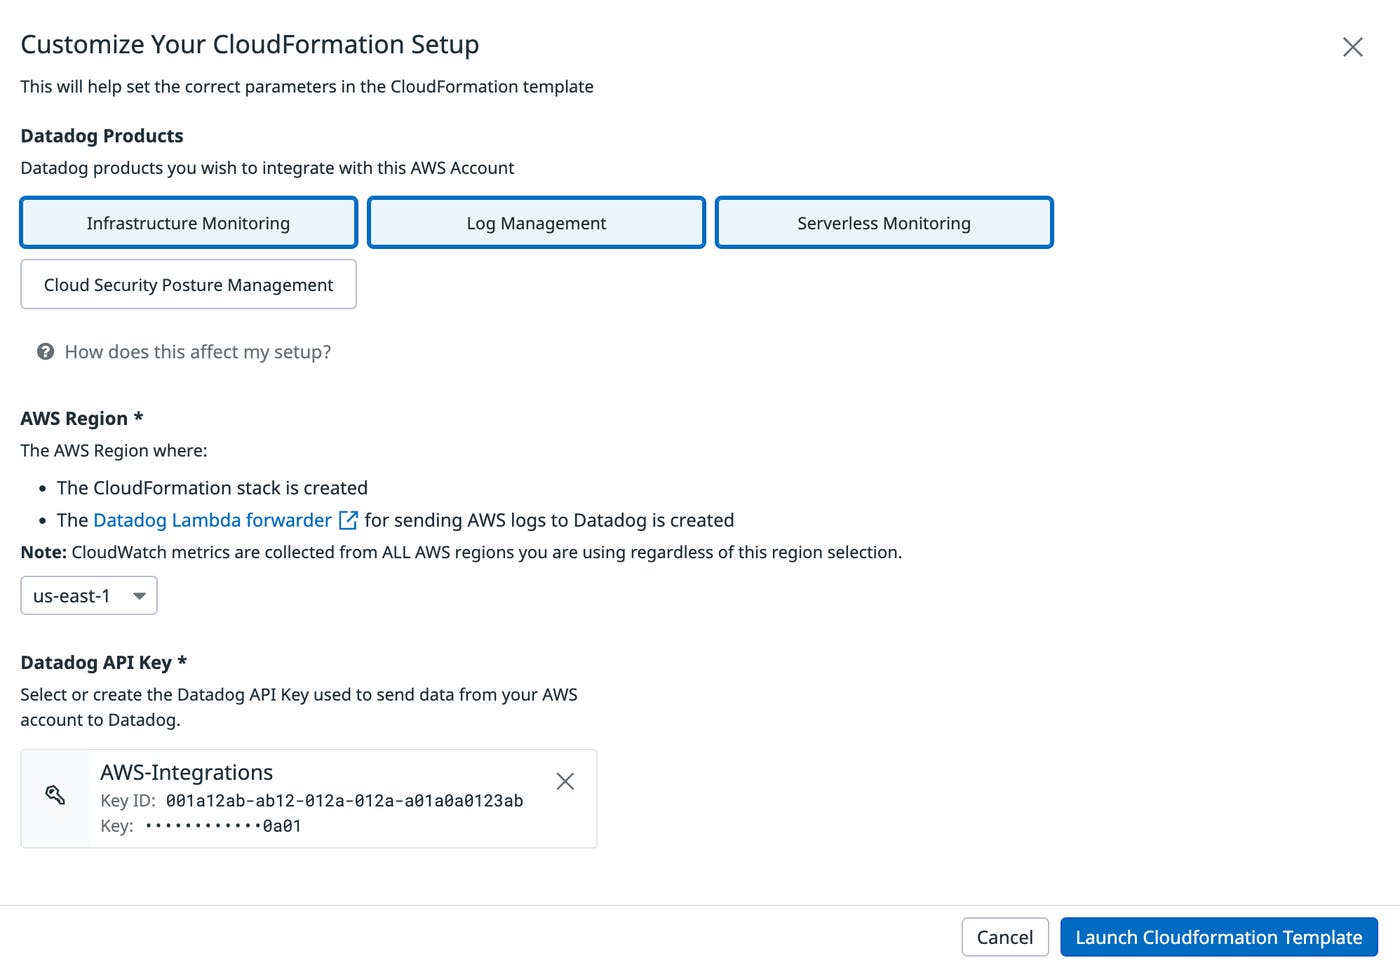
On the next screen, you can customize your setup so that your CloudFormation template includes the correct parameters to configure the integration to collect your AWS data. First, select the Datadog products to integrate with your AWS account and the AWS region in which to create the CloudFormation stack. Next, select an API key from your Datadog account—or create a new one—to send AWS data to Datadog. Then click Launch CloudFormation Template.
In a new tab, you’ll be taken to the CloudFormation page to create your stack. The values in this form, including the Datadog API key, are filled in for you based on the information you provided in the previous step.
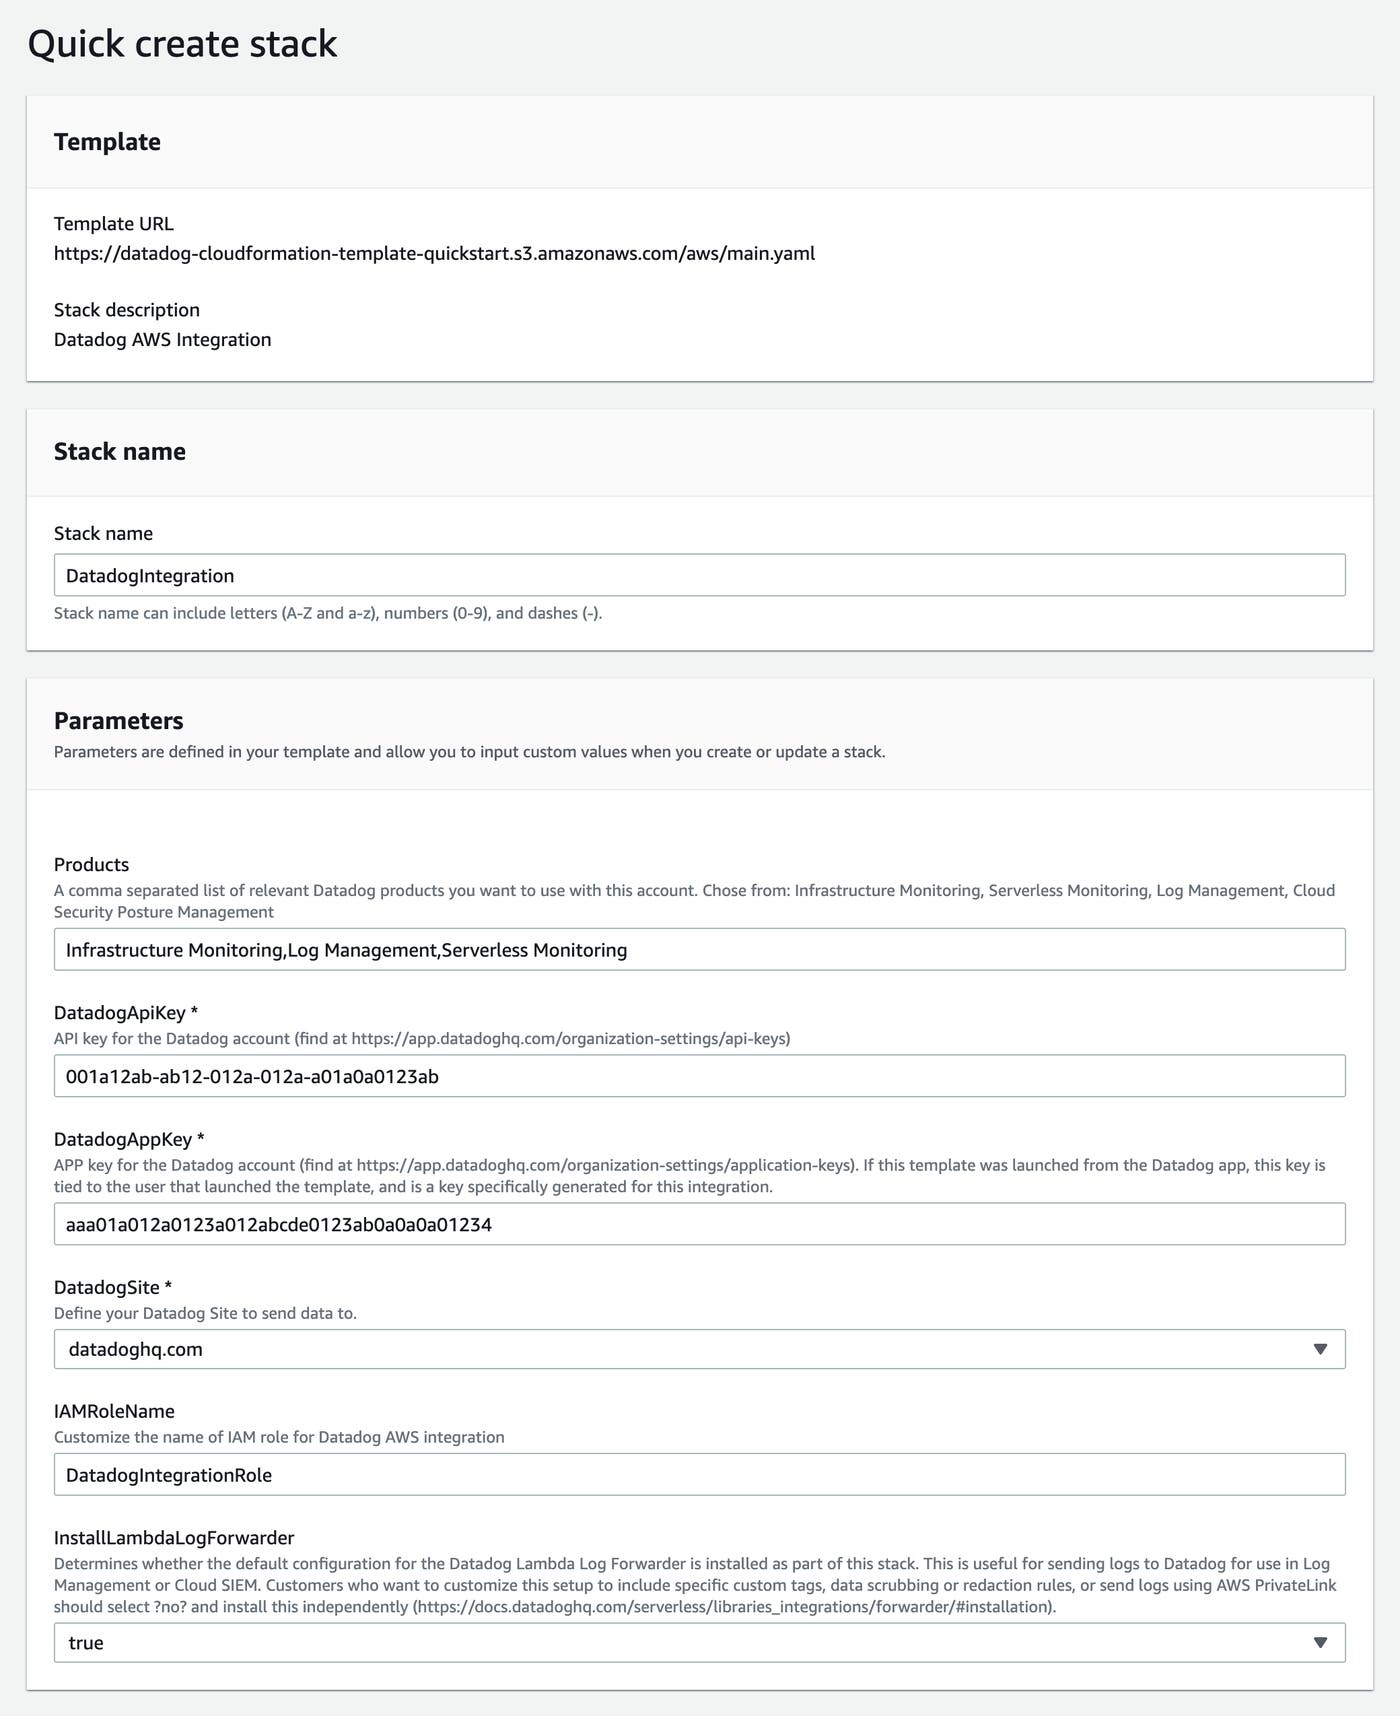
Once you submit this form, AWS will automatically create the necessary resources. When AWS has completed this process, return to Datadog’s AWS integration tile in your original tab and click the Refresh to Check Status button. When the installation has completed, you’ll see your account information and a list of AWS services you can monitor.
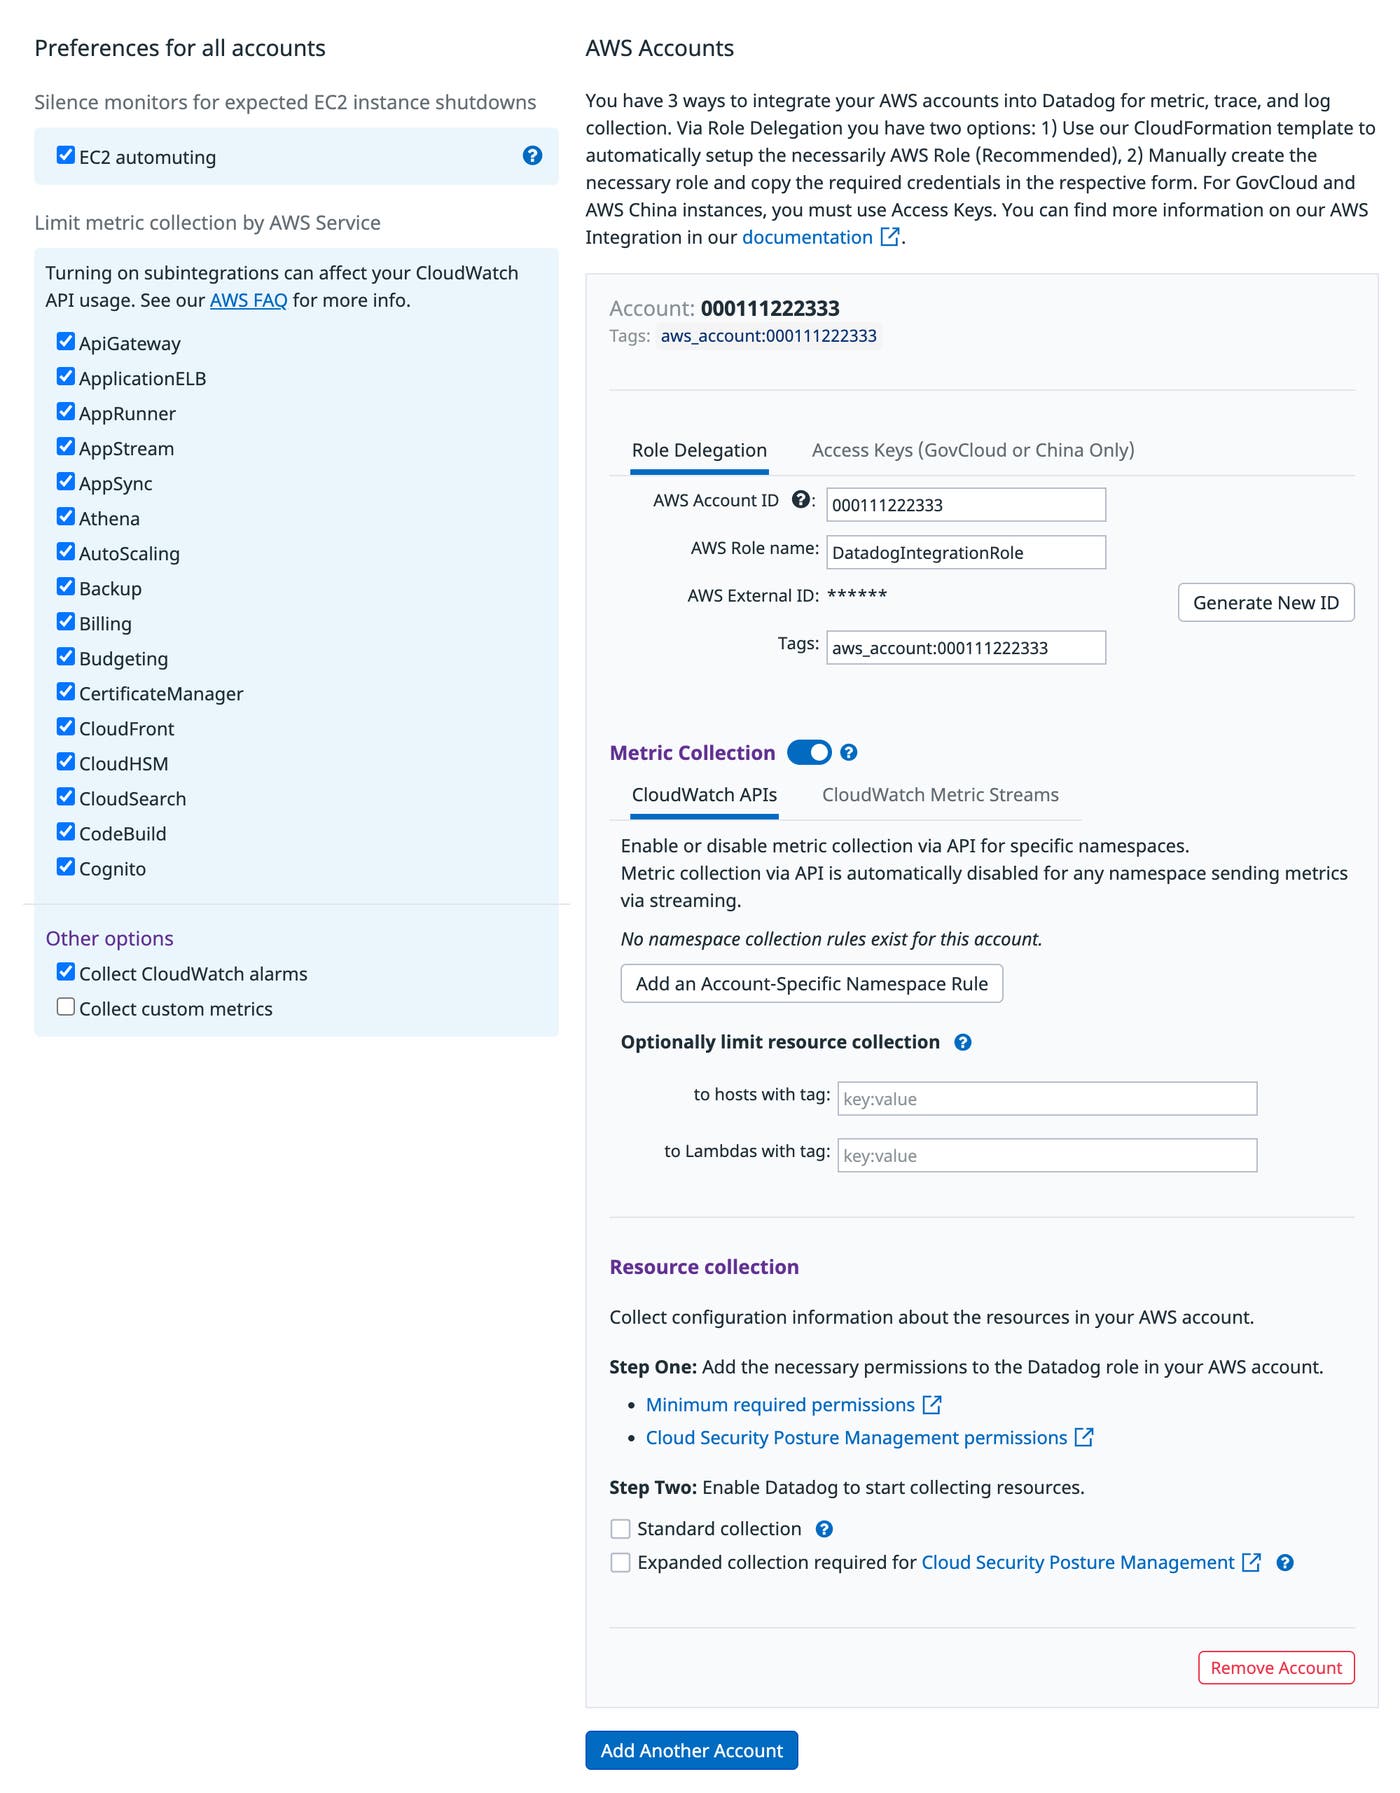
You should see metrics from your AWS account begin to flow into your Datadog dashboards within a few minutes.
Look into the cloud
With Datadog’s 1-click AWS integration and rich out-of-the-box dashboards, you can start monitoring dozens of AWS services—plus more than 1,000 other technologies—in just a few minutes. See the documentation for guidance on setting up the AWS integration. If you’re not already using Datadog, start today with a 14-day free trial.


