

Kevin Hu
Staff Product Manager

Natasha Silva
Technical Content Writer
You get a Slack message from the VP of Sales: They have asked an AI agent connected to Snowflake for the past quarter’s revenue and the numbers look wrong. First, you verify the agent’s query and, when that looks fine, check the pipelines that populate the underlying table. All jobs completed, the data is recently refreshed. Then it’s time to check the logs for errors. Nothing. So you start querying the table, comparing row counts across runs, and manually reviewing null rates column by column.
After a day of digging, you realize the table has been loading 22% fewer rows than normal for several days, with three key fields nearly half null. No alerts ever fired. By the time you find out, reports were wrong, and decisions may have been made on bad data. You still need to apply the fix retroactively and identify every downstream service, dashboard, or application that consumed the affected data.
Pipeline and data monitoring solve complementary challenges. A failed or abnormally long-running job can be an indication that downstream data is incomplete or delayed. But a completed job does not prove that the right data reached the table. You need to monitor the data produced and transformed by those jobs as well.
In this post, we will explain why successful jobs don’t guarantee data quality, how to detect problems in data at rest, and how to use pipeline-level context to trace the root causes of data quality issues.
Why doesn’t a successful pipeline run guarantee data quality?
Pipeline-level checks tell you whether a data pipeline completed and whether its execution looked normal. Error-rate monitors alert on exceptions, while duration monitors detect jobs that take longer than expected. Long run times can indicate resource constraints, stuck processes, or delayed data delivery.
These checks are essential for measuring pipeline health, but they do not validate whether the right content landed on the table. A pipeline can finish on time, return no errors, and still produce incomplete or incorrect data.
Both the symptoms and the root cause of a warehouse data quality problem can be silent. Common symptoms include:
Freshness delays: A table or partition is not updated on schedule.
Unexpected row count changes: A table contains substantially more or fewer records than its historical baseline.
Nullness or distribution drift: A column accumulates nulls, loses expected values, or develops a different statistical distribution.
Duplicate or non-unique records: Fields that should serve as unique record identifiers begin repeating.
Some of the common root causes that can also leave pipeline health signals looking normal are:
Source or configuration changes: An upstream team changes a source connection or filter. The ingestion job completes, but the table reflects a reduced or altered scope.
Scheduling or dependency changes: A skipped job, failed dependency, or scheduling update prevents a table from refreshing on schedule, with no obvious infrastructure failure to signal it.
Transformation changes: A dbt model or other transformation is updated with new filtering, join, or aggregation logic. The model runs without errors but produces fewer rows, duplicate records, or unexpected values.
Schema drift: A field is renamed or its type changes upstream. Depending on how ingestion and schema evolution are configured, the load can complete while affected columns become null, get dropped, or stop mapping as expected.
In each case, the warehouse table still exists and queries return results, even though the content is wrong. No pipeline-level monitor fires. Only a monitor pointed at the data in the table itself would catch the problem.
How to monitor data quality at rest
Monitoring warehouse data quality starts with tracking the data in each table alongside the jobs that produced it. Pipeline signals show whether processing occurred as expected, and data quality signals show whether the output remains usable and trustworthy.
From there, you need to decide what to measure, how to detect abnormal behavior, and how to expand coverage without creating noise or compute costs.
Track the right data quality signals
You can organize data quality checks into four main categories:
Table-level checks: Use freshness and row count checks to detect stale tables, missing loads, and significant changes in data volume.
Column-level checks: Monitor nullness, uniqueness, cardinality, and statistical distributions to detect subtler changes within otherwise healthy-looking tables.
Schema checks: Detect added, removed, renamed, or type-changed columns instead of relying on null rates or custom rules as indirect indicators of schema drift.
Custom checks: Express business-specific expectations as SQL queries when built-in metrics cannot represent the rule. For example, you might count failed orders or identify records with values that are inconsistent with business logic.
Together, these checks let you detect both obvious failures, such as a table that has not been refreshed, and less visible changes inside tables that look healthy at a high level.
Choose the detection method
Now that you know what to measure, you need to determine how to identify abnormal data. In practice, selecting the right method can be harder than it sounds.
Anomaly detection learns from historical patterns, including seasonality and trends, making it best suited to metrics that vary over time. Because anomaly monitors require 3 to 7 days of training on historical data before they alert, plan for that window when rolling them out on new tables.
During the training window, consider running threshold monitors in parallel as a temporary backstop, using conservative bounds based on recent history. You can then remove or adjust those monitors once anomaly detection has enough signal to operate reliably.
The model can also improve over time when you provide feedback. On a monitor’s status page, you can adjust the expected bounds by marking it as expected, ignored, or a missed alert. This teaches the model what normal looks like for your data. This is useful because data quality metrics are business-specific.
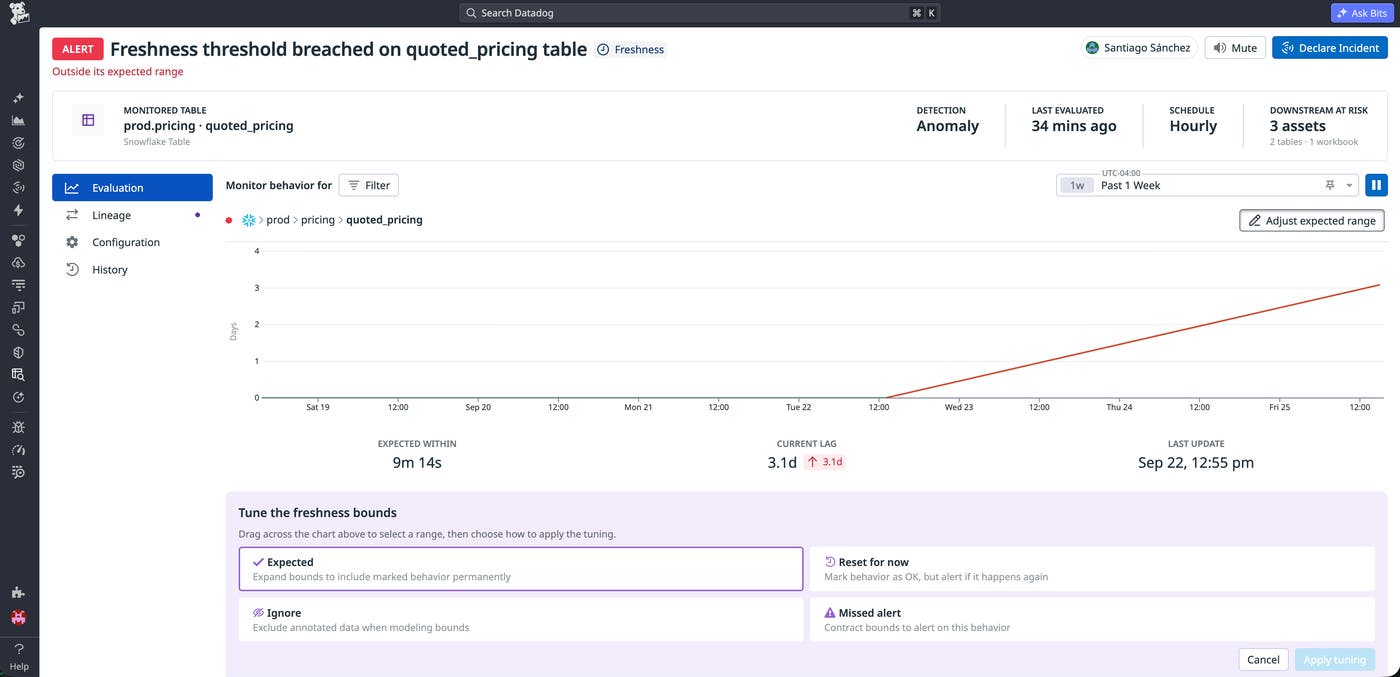
Threshold detection uses a fixed value and works best when you have a hard business rule. For example, a table must contain more than 10,000 rows, or a field should have a null rate below 5%. Static thresholds are a poor fit for most tables because seasonality and volume growth mean that a threshold set today will require constant manual recalibration to stay relevant.
However, a table may appear seasonal but lack enough history for an anomaly detection model to train with confidence. Other tables have business rules that shift with product changes. For example, the meaning of a failed_orders field might change after a platform migration, making threshold maintenance unavoidable.
As a general rule, prefer anomaly detection unless you can express the requirement as a hard, unchanging limit. Most environments use anomaly detection for variable metrics and thresholds for explicit SLAs and invariants. New tables without enough history may require threshold monitors while anomaly models train.
Datadog Data Observability supports these checks across Snowflake, Databricks, BigQuery, and Redshift, as well as Iceberg tables cataloged through AWS Glue. It also supports transactional databases such as PostgreSQL, so you can detect quality problems closer to their source.
Scale coverage without scaling noise
Once you know how to scope and configure your monitors, the next challenge is keeping the signal-to-noise ratio manageable as coverage grows.
Start with your most important tables and those with the most downstream dependencies, then expand coverage from there. You can group monitors by schema, table, or a custom dimension such as region, so a single monitor covers multiple tables.
When configuring grouped monitors, choose between a multi-alert or simple-alert strategy. A multi-alert monitor sends a separate notification for each group that breaches, such as one notification per affected table. A simple alert aggregates all breaching groups into a single notification, such as one notification for the entire schema. The right option depends on how your teams own and respond to the affected data.
For business-specific rules that built-in metrics do not cover, use custom SQL monitors. For example, the following query tracks failed-order counts as a quality signal:
SELECT COUNT(*) as failed_orders FROM ANALYTICS_DB.PROD.ORDERS WHERE STATUS = 'FAILED'
Continue refining anomaly monitors as your environment changes. Annotate known-good or known-bad periods on the monitor’s status page to help the model learn what normal looks like for that dataset. This is useful after expected events such as migrations, backfills, promotions, or seasonal traffic changes.
Monitoring cost and query latency vary by method. Datadog reads warehouse metadata for metrics such as freshness and row count when the warehouse exposes it. Column metrics and custom SQL require direct queries against the table, which can consume warehouse compute and take time to execute. Factor both in when deciding where to use column-level and custom SQL monitors.
Finally, route alerts both to the team that owns the affected table and the on-call pipeline rotation. Notifications can be sent to Slack and email, as well as Datadog On-Call, PagerDuty, and any other channel configured in your notification settings.
How to investigate data quality issues
Once an alert fires, the main questions are: What caused the problem upstream, and what has it affected downstream? Datadog Data Observability’s lineage views answer both by tracing upstream causes and downstream impact so you can assess the overall blast radius.
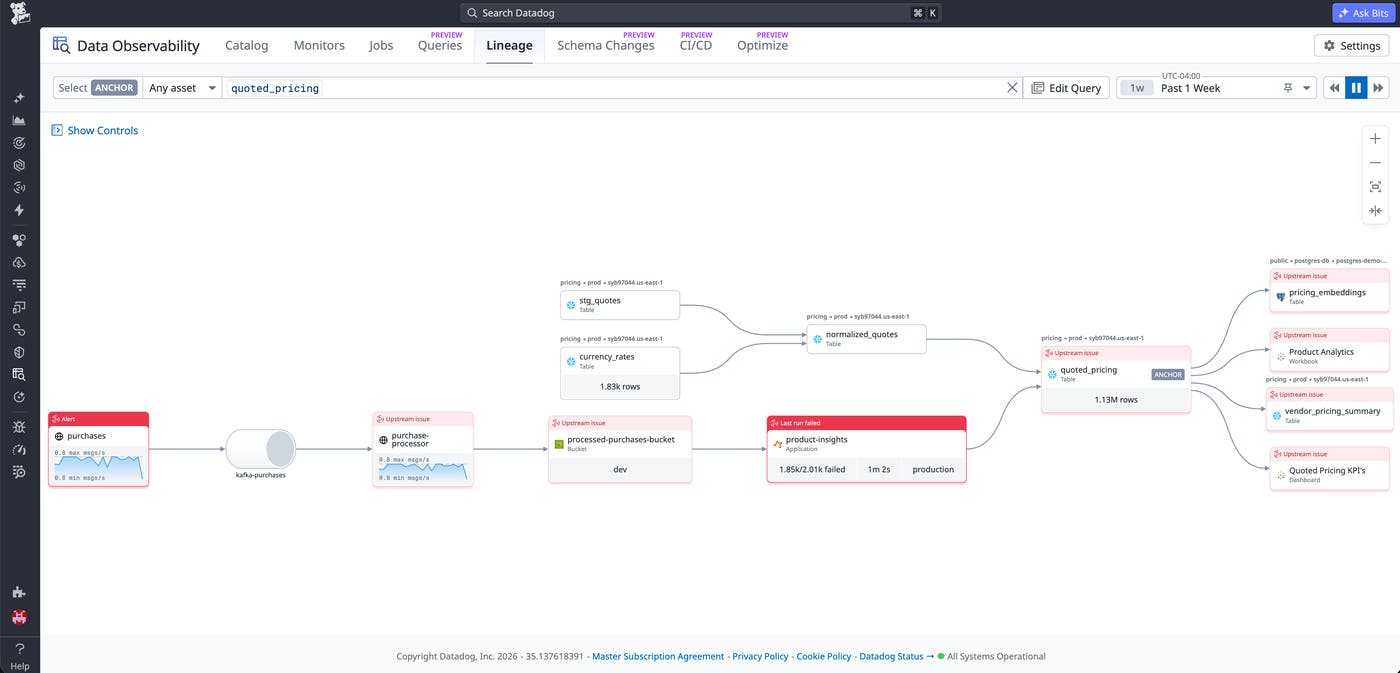
Most investigations will follow the same sequence:
Confirm the affected table, column, and time range.
Use lineage to identify downstream dashboards, models, and dependent tables.
Determine whether the problem started at the source, in a streaming layer, or during batch processing.
Bring in Data Observability, Data Streams Monitoring, warehouse query history, logs, and infrastructure telemetry as appropriate.
Use Bits AI or an AI assistant connected through the Datadog MCP Server to surface relevant telemetry data, map relationships between signals, and accelerate the investigation.
Where you look next depends on the architecture and what your pipeline telemetry shows.
Investigate problems at the source
Not every data quality alert traces back to your pipeline. If Data Observability and Data Streams Monitoring both look normal—with expected throughput, no job failures, and no unusual run durations—the failure likely originated at the source system before your pipeline ever touched the data.
Common causes include an upstream team changing what a feed exports, a third-party data source experiencing an outage, or a source-side filter quietly reducing the scope of records sent downstream.
In these cases, shift the investigation away from pipeline telemetry. Query the source, compare current export volumes with historical baselines, and loop in the team that owns the upstream feed.
Batch pipelines
For batch pipelines, the key question is whether the job processed less input data than usual or processed the same amount of input but produced less output. Those patterns point to different root causes: a reduced upstream source versus a transformation or filtering issue.
Jobs Monitoring for batch loads surfaces per-job metrics, including input and output data volume, run duration, and failure reasons. For Spark jobs, it also exposes idle executor CPU, shuffle I/O, and disk spill. Use side-by-side run comparison to isolate when a drop begins.
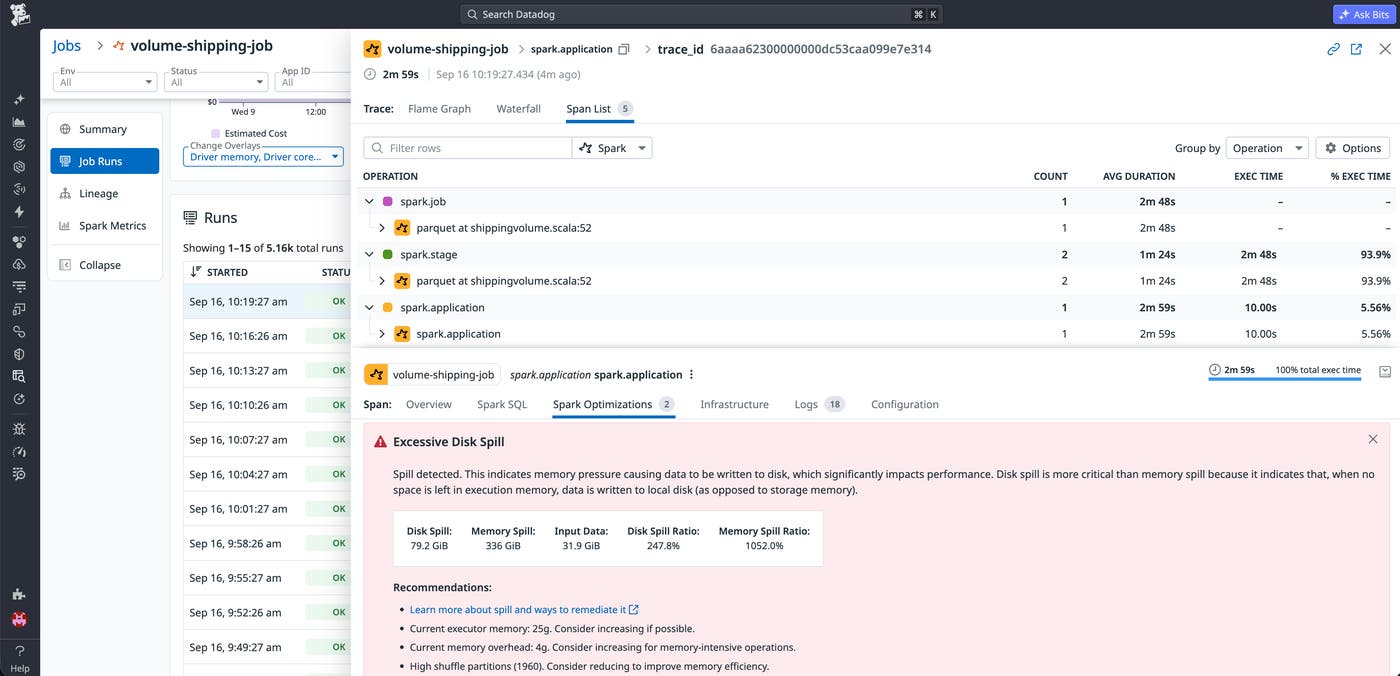
Say a row count monitor fires on a Databricks table. Datadog shows that the job completed, but its input data volume was significantly lower than in previous runs. That points to a reduced upstream data source rather than a job failure. From the run view, you can pivot to correlated infrastructure metrics, logs, and cluster configuration for a deeper investigation.
Snowflake and other warehouse-native batch loads may not have a Spark or orchestrator layer. Datadog can detect the problem at the destination table. Row count, freshness, and null-rate monitors read the table rather than the job, so they catch volume or quality changes regardless of how the data was loaded. From there, use lineage, warehouse query history, and source-side checks to find where the data changed.
Streaming pipelines
For streaming pipelines, the key question from a data quality perspective is whether throughput dropped on a specific topic or partition before the data reached the warehouse. Answering it narrows the investigation to the affected producer path without requiring manual querying.
Data Streams Monitoring provides per-topic throughput and lag visibility, showing where volume dropped before it reached the warehouse.
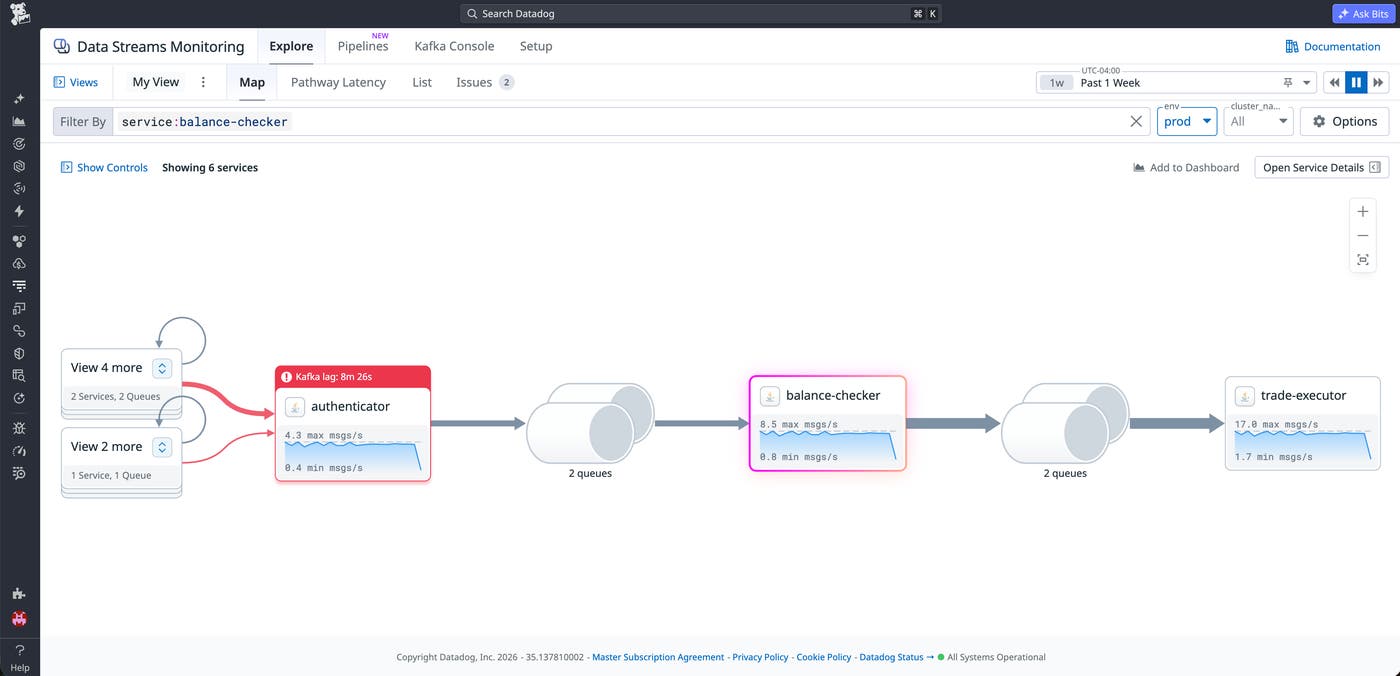
Let’s say a freshness monitor fires on a warehouse table fed by a streaming ingestion service. Data Streams Monitoring can show where throughput diverged across the stream, narrowing the investigation to the affected producer or consumer path. For example, an incompatible schema change could cause the consumer to reject messages even though the producer continues sending them.
Hybrid architectures
In hybrid architectures, a streaming layer feeds batch jobs before data lands in the warehouse. Run the investigation in sequence. First identify where volume dropped in the streaming layer, then confirm whether the lower volume propagated through the batch outputs and reached the warehouse table.
For example, Data Streams Monitoring might show a throughput drop on the input topic, while Datadog Data Observability confirms that the downstream batch job processed less data than during the previous run. Together, the two signals connect the quality issue in the warehouse to a single upstream cause.
Start monitoring your warehouse data
Monitoring pipeline health alone leaves data quality problems invisible until a stakeholder finds them. A job can complete while producing stale, incomplete, duplicated, or otherwise incorrect data.
Datadog Data Observability provides always-on coverage for data at rest and visibility into batch job runs, helping you catch quality issues before they reach stakeholders or undermine business decisions and investigate their causes. Combined with Data Streams Monitoring, you get a connected view from the downstream symptom back through the pipeline to its source.
If you’re not already a Datadog customer, sign up for a free 14-day trial.
