
David Lentz
Senior Technical Content Writer

Kathy Lin
Senior Product Manager
Distributed AI training workloads impose complex scheduling requirements that Kubernetes’s built-in scheduler can’t meet. Kubernetes schedules pods individually and independently, but distributed training introduces two requirements that break this model: Pods must land on hardware with the right inter-GPU bandwidth, and all pods must be scheduled simultaneously. If either requirement goes unmet, training stalls or runs far below the hardware’s potential.
Topology-aware scheduling (TAS) and gang scheduling address these two requirements and help organizations extract full value from the growing portion of their cloud spend that goes toward GPUs. TAS shapes the relative placement of pods to enable fast communication between GPUs. Gang scheduling helps ensure that all pods in a distributed job start running simultaneously, preventing the partial starts that leave GPUs allocated but idle. Together, they give Kubernetes the placement precision and coordination that distributed workloads require.
In this post, we’ll look at the scheduling problems that AI training presents for Kubernetes and how TAS and gang scheduling, implemented by Kueue and the Coscheduling plugin, solve them. We’ll explore:
We’ll also cover the evolving capabilities of Kubernetes native scheduler to support AI training workloads.
How the Kubernetes scheduler is unsuited for AI training
In most batch workloads, pods operate independently. A pod can fail, be rescheduled, or be replaced with no effect on the rest of the workload. The Kubernetes scheduler handles this model well by placing pods one at a time on any eligible node without coordinating across pods.
But the pods in an AI training workload are interdependent. They need to be placed on hardware with appropriate inter-GPU bandwidth, and they all need to start simultaneously. The following sections explain these requirements and how Kueue and Coscheduling address them by augmenting Kubernetes’ scheduling capabilities.
How topology placement affects distributed AI training performance
The physical interconnections between nodes are a key factor in the performance of AI training workloads. In each step of the training process, workers exchange data through collective communication operations, and the type and frequency of those operations depends on the job’s parallelization strategy. In pure data-parallel (DDP) training, one AllReduce operation per step aggregates, averages, and distributes gradients—the computed signals that indicate how the model’s parameters should be adjusted to improve its predictions. In large-scale training strategies that shard the model across workers, those workers instead exchange data continuously throughout a step, by using operations like gather, reduce, and all-to-all. These large-scale strategies include tensor, pipeline, and expert parallelism, which are often combined in LLM pretraining. Whichever pattern a job uses, the underlying constraint is the same: This communication is latency-sensitive, and where those workers land in the cluster determines how much of that latency the job absorbs.
The bandwidth available between workers depends on where they sit relative to each other in the cluster. The following topology domains are common in GPU clusters:
Same node: This is generally the lowest-latency option. When the GPUs are connected by NVLink and NVSwitch, workers can use NVIDIA’s high-bandwidth GPU interconnect. Otherwise, same-node GPU communication may traverse Peripheral Component Interconnect Express (PCIe) connections.
Different nodes in the same rack: Workers communicate via high-speed network fabric. Cross-node traffic travels through PCIe to the network interface and back, with intermediate latency.
Different racks: This is the highest-latency option. Workers communicate across the cluster’s InfiniBand fabric, which is the lowest-bandwidth hop in the path and adds further latency on top of the cross-node PCIe path.
Different workloads have different tolerances for latency. In a pretraining job that comprises a large number of workers, each step blocks until the slowest worker completes its share of that step’s collective communication. Any cross-rack latency here compounds quickly, reducing effective GPU utilization. A small fine-tuning job involves fewer workers exchanging smaller gradients, so the same cross-rack penalty represents a much smaller fraction of each step’s total time.
Without topology awareness, the Kubernetes scheduler places workers on any eligible nodes, regardless of their physical relationships in the cluster. The gang assembles and the training job runs, but communication overhead—rather than computation—consumes a substantial portion of each step. The job completes more slowly and at greater cost than the hardware should require. Crucially, infrastructure metrics don’t reflect this inefficiency because they measure activity, not productivity. Nothing looks wrong from an infrastructure perspective, but training throughput remains low relative to what the hardware should deliver.
Kueue closes part of this gap through topology-aware placement. It groups nodes into domains—block, rack, and host—based on topology labels applied to those nodes (for example, topology.kubernetes.io/rack). Kueue places a job’s pods within a single domain that satisfies its bandwidth requirements. But Kueue doesn’t discover cluster topology on its own. The labels that define each domain have to be applied to nodes first, typically by a cluster administrator or a cloud provider’s topology labeler.
Kueue enforces this placement decision at admission time. It’s an open source Kubernetes-native job queuing system that sits above the kube-scheduler, controlling which jobs reach the scheduler and when. During that admission check, it also verifies that a job’s pods fit within a topology domain. It evaluates each job against quota, priority, and preemption criteria and decides whether to allow the job to proceed. It tracks that decision in a Kueue Workload object, which represents the resource requirements, admission status, and pod sets for a job. Kueue also provides optional life cycle management for admitted jobs, including evicting and requeueing workloads whose pods don’t all reach a ready state within a configured timeout.
When Kueue admits a job to be scheduled (by setting spec.suspend: false, allowing the Job controller to create pods), it writes scheduling constraints into the training job’s pod templates based on the placement mode and topology assignment it selected. Those constraints restrict which nodes the Kubernetes scheduler may assign so that pods stay within the selected topology domain.
How partial gang starts can waste GPU capacity
The job definition configures the required number of interdependent pods for a distributed training job, all of which must be running before any work can begin. But the Kubernetes scheduler doesn’t recognize this interdependency. It schedules pods as it’s able, and as workers join the gang, they sit idle until the full complement is available. Kubernetes has allocated GPU capacity, cloud compute costs are adding up, but no useful work is accomplished. The training framework can time out waiting for all workers to bind, and Kubernetes evicts the pods.
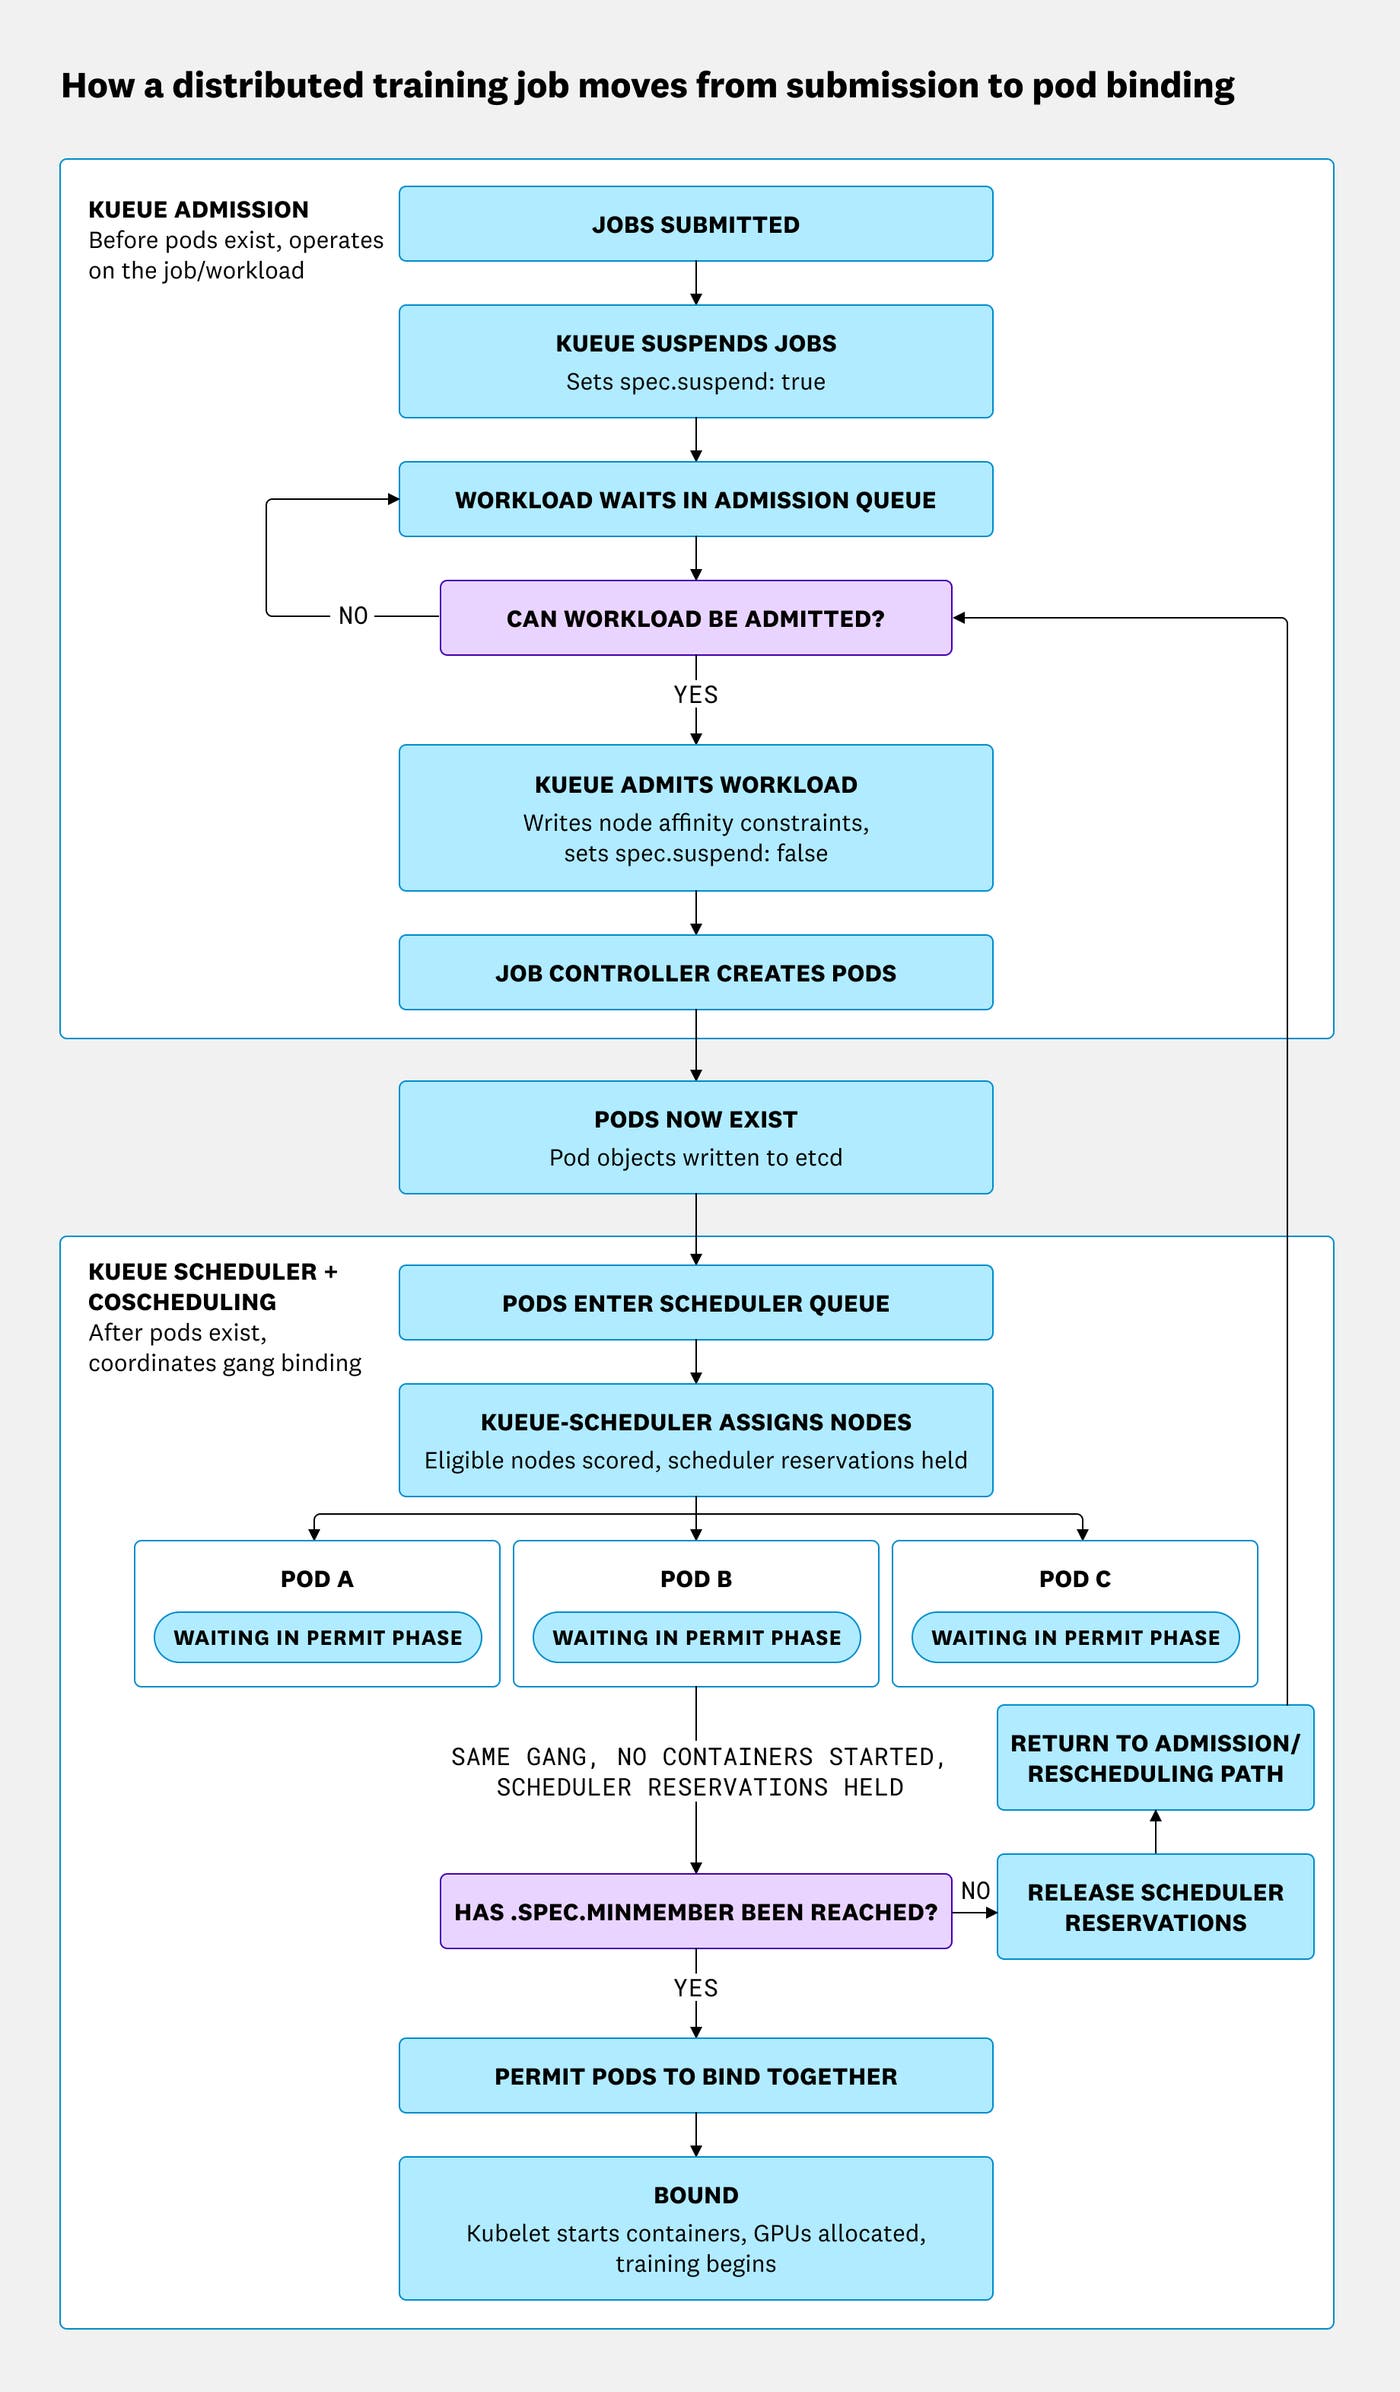
The Coscheduling plugin extends the native kube-scheduler via the scheduling framework. It prevents partial gang starts by explicitly declaring the minimum worker requirement and enforcing all-or-nothing binding. When Kueue assigns a pod to a node (observing the scheduling constraints that Kueue has already applied), the pod waits in Coscheduling’s Permit phase until enough other pods are assigned to meet the minimum requirement. During this wait, Kubernetes reserves GPU, CPU, and memory resources for the pod, but it doesn’t allocate those resources to any running container. Once Coscheduling assigns the required minimum number of pods, they all proceed to binding simultaneously—committing each pod to its assigned node, allocating the necessary resources, and triggering the kubelet to start the container.
Coscheduling’s wait period is the scheduler-level guardrail. If the gang can’t assemble during the Permit phase, Coscheduling rejects the waiting pods and releases the scheduler reservations, preventing a partial gang from binding and starting. Because the full gang never started, releasing these reservations is less disruptive than evicting a partially running training job.
The following diagram shows the path that a pod takes from job submission to binding. Kueue acts first, writing topology constraints at admission time and clearing the job for scheduling. The Job controller creates the pods, but they exist only as objects in etcd, without assigned nodes or running containers. Coscheduling acts second, holding each pod in a waiting state until the full gang is ready to bind simultaneously.
How to validate gang scheduling and TAS in Kubernetes
Kueue and Coscheduling address the unique scheduling requirements of AI training workloads. To operate your training jobs effectively and efficiently, you need to know that Kueue and Coscheduling are working as intended. Because tracking down scheduling failures requires piecing together signals from multiple layers of your stack, this section breaks down how to validate each step of the process:
Monitor activity in the admission queue to ensure jobs are being accepted.
Validate placement effectiveness to confirm jobs land in the right physical topology.
Monitor Coscheduling gang assembly to catch partial starts.
Confirm scheduling effectiveness with training throughput signals to tie infrastructure metrics directly to application performance.
Monitor activity in the admission queue
Kueue exposes OpenMetrics-formatted metrics that show whether jobs are clearing the admission queue or stalling there.
kueue_pending_workloads shows queue depth broken down by status. The active status counts jobs currently waiting in the queue for capacity to open up. The inadmissible status counts jobs that Kueue has evaluated and cannot currently admit, typically because quota in the assigned ClusterQueue is exhausted, no valid topology domain exists, or a constraint can’t be satisfied. Jobs remain inadmissible until cluster conditions change. A growing inadmissible count that doesn’t clear is a sign of a configuration or capacity problem rather than normal queuing.
kueue_admission_wait_time_seconds measures how long jobs wait between creation or requeue and admission. A rising p99 indicates that jobs are arriving faster than Kueue can admit them, which can be due to quota exhaustion, priority contention among many jobs, or preemption processing taking time to complete.
kueue_evicted_workloads_total tracks evictions with a reason label that distinguishes the cause of each eviction. When a node fails under TAS and Kueue cannot find a replacement, it evicts the affected workload with reason="NodeFailures". A rise in this signal points to non-recoverable node loss in the assigned topology domain. A related reason, reason="PodsReadyTimeout", fires when a gang’s pods do not reach a ready state within the configured timeout. That timeout expires for many reasons, including slow scheduling, image pulls, resource pressure, or a node failure whose recovery timed out. Treat an increase as a prompt to investigate rather than proof of a single cause. Both are post-admission stability signals, separate from confirming that a workload landed in its intended topology domain.
Validate placement effectiveness
In addition to tracking Kueue metrics to understand admission health and eviction behavior, you can inspect the Kueue Workload object to confirm a workload’s topology assignment:
kubectl -n <namespace> get workloads.kueue.x-k8s.io <workload-name> -o yaml
Look for status.admission.podSetAssignments[].topologyAssignment. This field lists the topology levels and domain values into which each PodSet was placed, and is the authoritative signal that TAS was applied.
After you’ve confirmed the topology assignment, use GPU and network telemetry data to validate whether the hardware is delivering the performance that placement implies. Same-node GPU communication should show NVLink or other local interconnect activity when that hardware path is available. Evaluate cross-node communication by looking at PCIe activity together with network or fabric telemetry data: PCIe throughput reflects the GPU-to-host transfers required for cross-node communication, but it does not measure the network hop itself.
If throughput is low despite a valid topology assignment, look for a physical infrastructure explanation, such as driver issues, hardware faults, or fabric degradation, rather than treating it as a Kueue placement failure. Hardware bottlenecks like these can surface as lower-than-expected bandwidth and slower collective communiction times, not necessarily as idle GPUs, which is why infrastructure metrics can look healthy while training throughput degrades.
Monitor Coscheduling gang assembly in Kubernetes
The Coscheduling plugin uses a custom resource called a PodGroup to track each training gang. A PodGroup records the gang’s minimum worker requirement and current scheduling state. Pods belong to the same PodGroup when they use the same scheduling.x-k8s.io/pod-group label.
You can query PodGroups with kubectl:
kubectl get podgroups.scheduling.x-k8s.io --all-namespaces
For more detail about a specific gang, describe the PodGroup or inspect its status:
kubectl -n <namespace> describe podgroup.scheduling.x-k8s.io <podgroup-name>
kubectl -n <namespace> get podgroup.scheduling.x-k8s.io <podgroup-name> -o yaml
The exact columns shown by kubectl can vary by version and CRD configuration, so focus on the PodGroup’s spec and status fields. spec.minMember shows the minimum number of pods required for the gang to run. spec.scheduleTimeoutSeconds, when configured, controls how long the group can wait. status.phase shows the gang’s current state, which is one of the following values:
Pending: The PodGroup has been accepted but the scheduler has not allocated enough resources.Scheduling: More pods have been scheduled thanspec.minMember, but the number of running pods hasn’t reachedspec.minMemberyet.Running: At leastspec.minMemberpods are running.Unknown: Some, but not all, of the required pods were scheduled. The rest can’t be scheduled (for example, due to insufficient resources), and the scheduler waits for controllers to recover them.Finished: The required pods completed successfully.Failed: At least one of the required pods has failed.
You should expect a healthy gang to move from Pending or Scheduling to Running within the scheduling window you expect for that workload. If a gang remains Pending or Scheduling longer than expected, check the PodGroup events, associated pod events, and scheduler logs. A delay like this can indicate that the cluster cannot satisfy the gang’s resource requirements within the topology domain Kueue assigned, or that no available node satisfies scheduling requirements such as node selectors, taints, affinity, or resource availability.
A gang stuck between Scheduling and Running with only partial placement may surface as Unknown rather than remaining in Scheduling. The Unknown phase differs from Failed, because the scheduler is still waiting on controllers to recover the unplaced pods, not reporting an outright failure.
To distinguish an admission problem from a scheduler-level assembly problem, correlate PodGroup state with Kueue’s Workload status and admission metrics. If the Workload is still inadmissible, the issue is upstream of Coscheduling: Kueue has not admitted the job, so the fix is likely quota, priority, admission checks, or topology configuration. If the Workload is admitted and has a topology assignment, but the PodGroup remains Pending or Scheduling, the issue is later in the pipeline: Coscheduling and the kube-scheduler cannot assemble enough pods within the assigned placement and current cluster state.
If a PodGroup reaches Failed, investigate the failed pods directly and look for common issues such as application failure, image or startup errors, or node disruption.
Confirm scheduling effectiveness with training throughput signals
Training frameworks are the software libraries that orchestrate distributed training, such as PyTorch, JAX, and Ray Train. Only by monitoring signals from these frameworks can you determine whether GPU cycles are producing completed training progress or being consumed by stalled communication.
Ray is unique among these frameworks in its placement group model, which maps directly onto gang scheduling and gives it scheduling-aware observability. ray_placement_groups tracks the current number of placement groups by State, such as PENDING, CREATED, or REMOVED. A sustained increase in PENDING placement groups indicates that Ray is waiting for placement group resources to become available. ray_tasks tracks tasks by State, which can help show whether application work is accumulating while placement groups remain pending.
When these signals rise together, Ray cannot satisfy its placement requirements. This can be a downstream effect of a Coscheduling assembly issue or a Kueue topology constraint problem rather than a simple application-layer slowdown.
Other distributed training frameworks (including PyTorch DDP, Kubeflow operators, and Horovod) don’t expose metrics that directly reflect the Kubernetes scheduler’s effectiveness. These frameworks do provide indirect indicators in the form of throughput metrics, such as steps per second, samples per second, and tokens per second. A throughput drop in these metrics alongside decreasing bandwidth (gpu.pci.throughput.* or gpu.nvlink.throughput.*) and PodGroup timeouts suggests a scheduling root cause. PodGroup timeouts confirm that gang assembly did not complete within the expected scheduling window. Correlating those timeouts with the Kueue Workload’s topology assignment and GPU, PCIe, and network telemetry data can help determine whether placement constraints contributed to the slowdown.
Native Kubernetes scheduling: How v1.35 through v1.37 address AI training requirements
Kueue and Coscheduling are out-of-tree components, installed and managed separately from Kubernetes. Kubernetes is beginning to add native scheduler capabilities that address the complex scheduling requirements this post describes, but those features are still early.
Kubernetes v1.35 introduced native support for gang scheduling as an alpha feature. Kubernetes v1.36 added several related alpha features for AI training workloads, including topology-aware scheduling, workload-aware preemption, and initial Job controller integration via a feature gate. Kubernetes v1.36 also added a native PodGroup API, distinct from the out-of-tree PodGroup custom resource definition (CRD) used by the Coscheduling plugin. Kubernetes v1.37 graduated gang scheduling and workload-aware preemption to beta under the GenericWorkload feature gate, which remains disabled by default.
The native TAS implementation enables the kube-scheduler to understand physical cluster topology and place pods within an appropriate topology domain, such as a rack or zone, without requiring Kueue to write node affinity rules into pod templates.
These native capabilities are not yet a drop-in replacement for the Kueue and Coscheduling path described in this post. Gang scheduling and workload-aware preemption reached beta in v1.37 but ship disabled by default and still lack feature parity with Kueue and Coscheduling. Topology-aware workload scheduling remains alpha.
Kueue and Coscheduling remain the production path for distributed training scheduling. Their monitoring signals, including admission queue depth, gang assembly state, topology placement, and GPU throughput, map directly to the concepts the native APIs expose. Teams that build observability into the current stack will have a working baseline when they evaluate or migrate to these native capabilities.
How to monitor distributed training scheduling with Datadog
Training scheduling failures rarely surface in a single signal. A job that stalls or runs below expectations may have a root cause in Kueue’s admission queue, in Coscheduling’s gang assembly, or in the GPU interconnect, hardware health, and training framework signals covered in the next section. Collecting and correlating signals from all layers in Datadog makes it possible to trace a symptom to its origin. This section covers how to collect the Kueue and Coscheduling signals in Datadog.
Adding a tag that represents your cluster’s topology key (for example, topology.kubernetes.io/rack) enables correlation across sources. For example, you can use these tags to link a throughput drop with PodGroup timeouts and a rise in kueue.evicted_workloads.count{reason="NodeFailures"}. When clustered in the same domain, these signals indicate a localized node failure or capacity loss. The same drop without those correlations points elsewhere, such as the hardware or the workload itself.
Monitor Kueue with Datadog
Datadog collects Kueue metrics from its OpenMetrics endpoint under the kueue.* namespace. Because Kueue sits at the top of the scheduling pipeline—intercepting and admitting Kueue-managed jobs—it’s helpful to look at Kueue metrics when debugging an AI training job that is stalled or failing. The integration brings these signals into Datadog alongside the other four signal sources (Coscheduling, GPU bandwidth, training framework metrics, and GPU hardware health). This enables the cross-signal correlation and alerting that make root cause diagnosis practical at scale.
kueue.pending_workloads, broken down by status: active vs. status: inadmissible, shows the current queue depth and whether failed admission attempts are accumulating. A growing inadmissible count indicates jobs that Kueue has evaluated and repeatedly rejected. This may be due to quota exhaustion, topology constraint conflicts, or misconfigured WorkloadPriorityClasses. The kueue_cluster_queue label on this metric lets you filter by team or workload type to identify which queue is affected.
kueue.admission.wait_time.* measures how long jobs wait between creation and admission. A rising p99 suggests jobs are queueing up faster than the cluster can admit them, which is typically caused by quota exhaustion, priority contention, or preemption processing time. kueue.admitted.workloads.count and kueue.evicted_workloads.count give throughput and stability signals.
The reason: NodeFailures label on evictions is useful for identifying jobs that were admitted but later evicted because of node failures, which signals that capacity in the assigned topology domain changed after admission.
In a healthy cluster, kueue.pending_workloads stays near zero with no inadmissible accumulation, admission throughput is steady, and kueue.evicted_workloads.count shows no NodeFailures evictions. Set monitors on kueue.pending_workloads{status="inadmissible"} to alert when jobs are consistently failing admission, and on kueue.evicted_workloads.count{reason="NodeFailures"} to catch TAS-related node failure evictions as they occur.
Monitor gang assembly state with Coscheduling and Datadog Container Monitoring
Datadog Container Monitoring gives you visibility into Coscheduling gang assembly activity through PodGroup resource status. Container Monitoring’s Kubernetes Explorer can collect PodGroup custom resources and lets you filter by .status.phase to see gang scheduling activity across your cluster.
When PodGroups remain in Pending or Scheduling longer than expected, correlate their status with kueue.evicted_workloads.count{reason="PodsReadyTimeout"} and the Kueue Workload’s admission state. If PodGroups are timing out but Kueue evictions are low, the cluster may lack the resources to assemble the full gang within the assigned placement. If PodGroups are accumulating in Failed, investigate the failed pods directly for application failures, startup errors, image issues, or node disruption.
A healthy PodGroup moves promptly from Scheduling to Running and on to Finished once the job completes, with no accumulation in Failed or Unknown.
How to troubleshoot AI Workloads across your stack faster with Datadog GPU Monitoring
Kueue and Coscheduling metrics confirm that a job admitted and assembled correctly—they don’t explain a slowdown once training is running. That’s Datadog GPU Monitoring’s job: It correlates GPU-level signals with the Kueue and Coscheduling state covered earlier to pinpoint the root cause of a slow or failing distributed AI workload. GPU Monitoring provides visibility into device health, network connectivity, Kueue capacity and quotas, and continuous tracing of workload performance and cost.
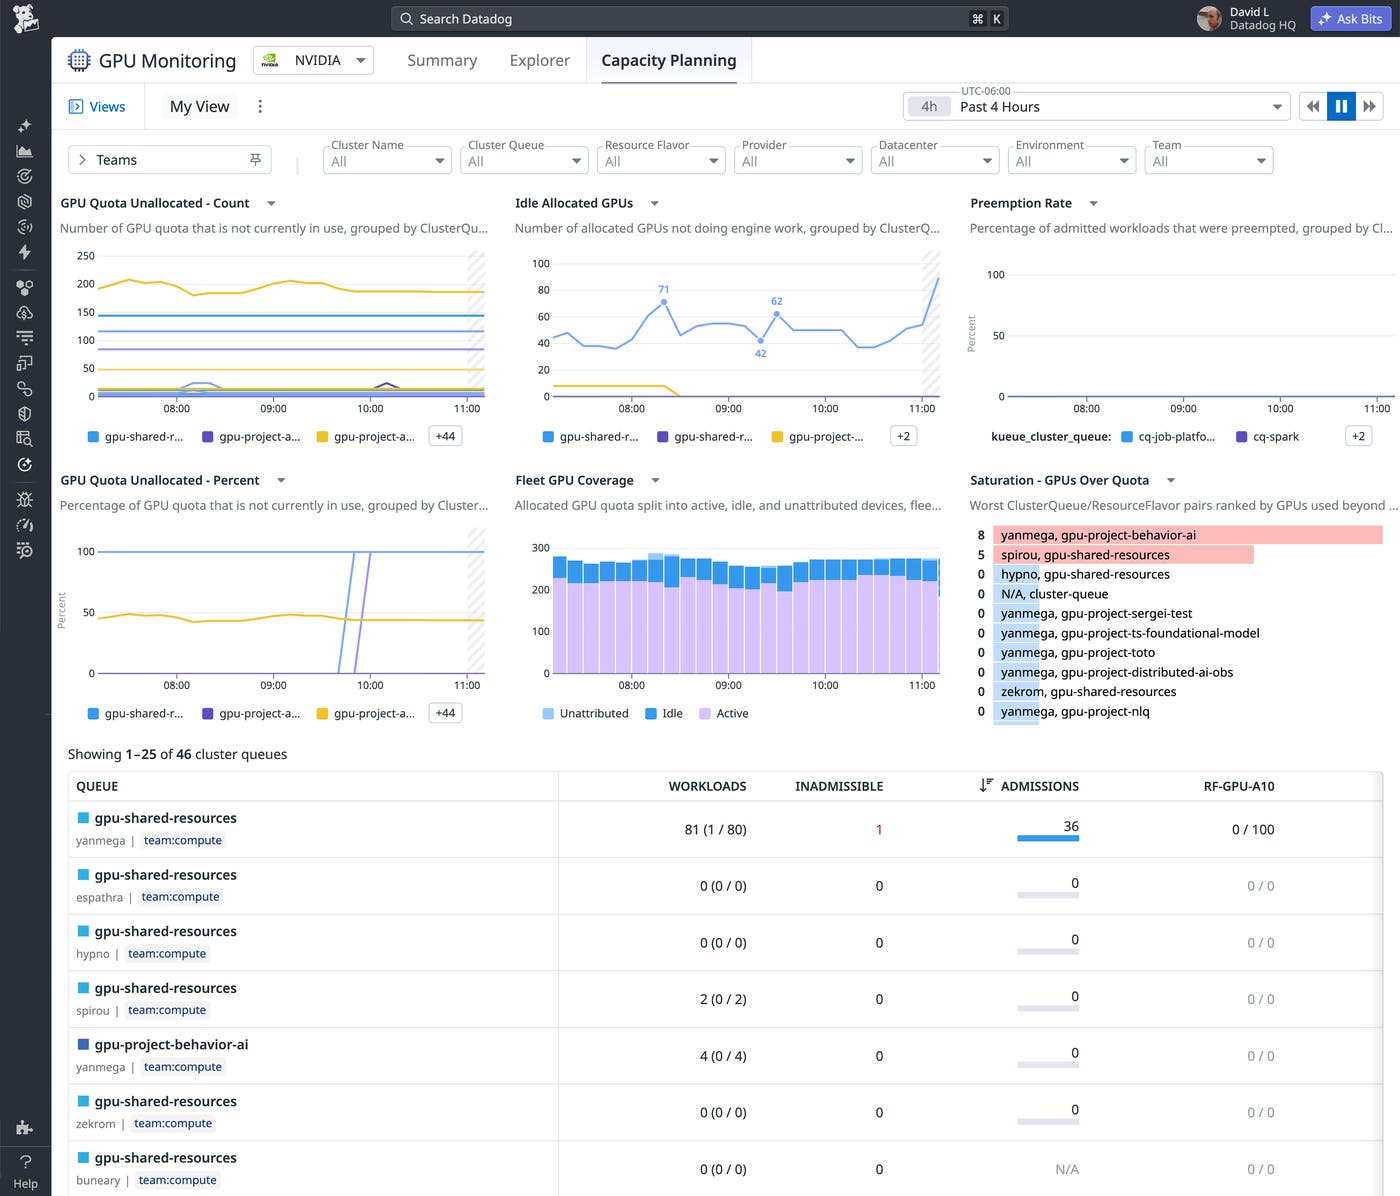
GPU Monitoring’s Capacity Planning page lets you directly link Kueue ClusterQueues and their resource flavors to the specific GPU types and device identities backing them. For example, you can confirm that a ClusterQueue’s nvidia.com/gpu flavor runs on H100 nodes in the intended rack, tying an admission-time construct to the physical hardware. You can also detect which teams have the largest quotas but aren’t using them, and measure how efficiently each queue is being used.
Contact us to request access to the Capacity Planning preview.
The GPU Fleet Explorer page, shown next, enables you to monitor any training job’s network interconnectivity layer, device performance, and hardware health.
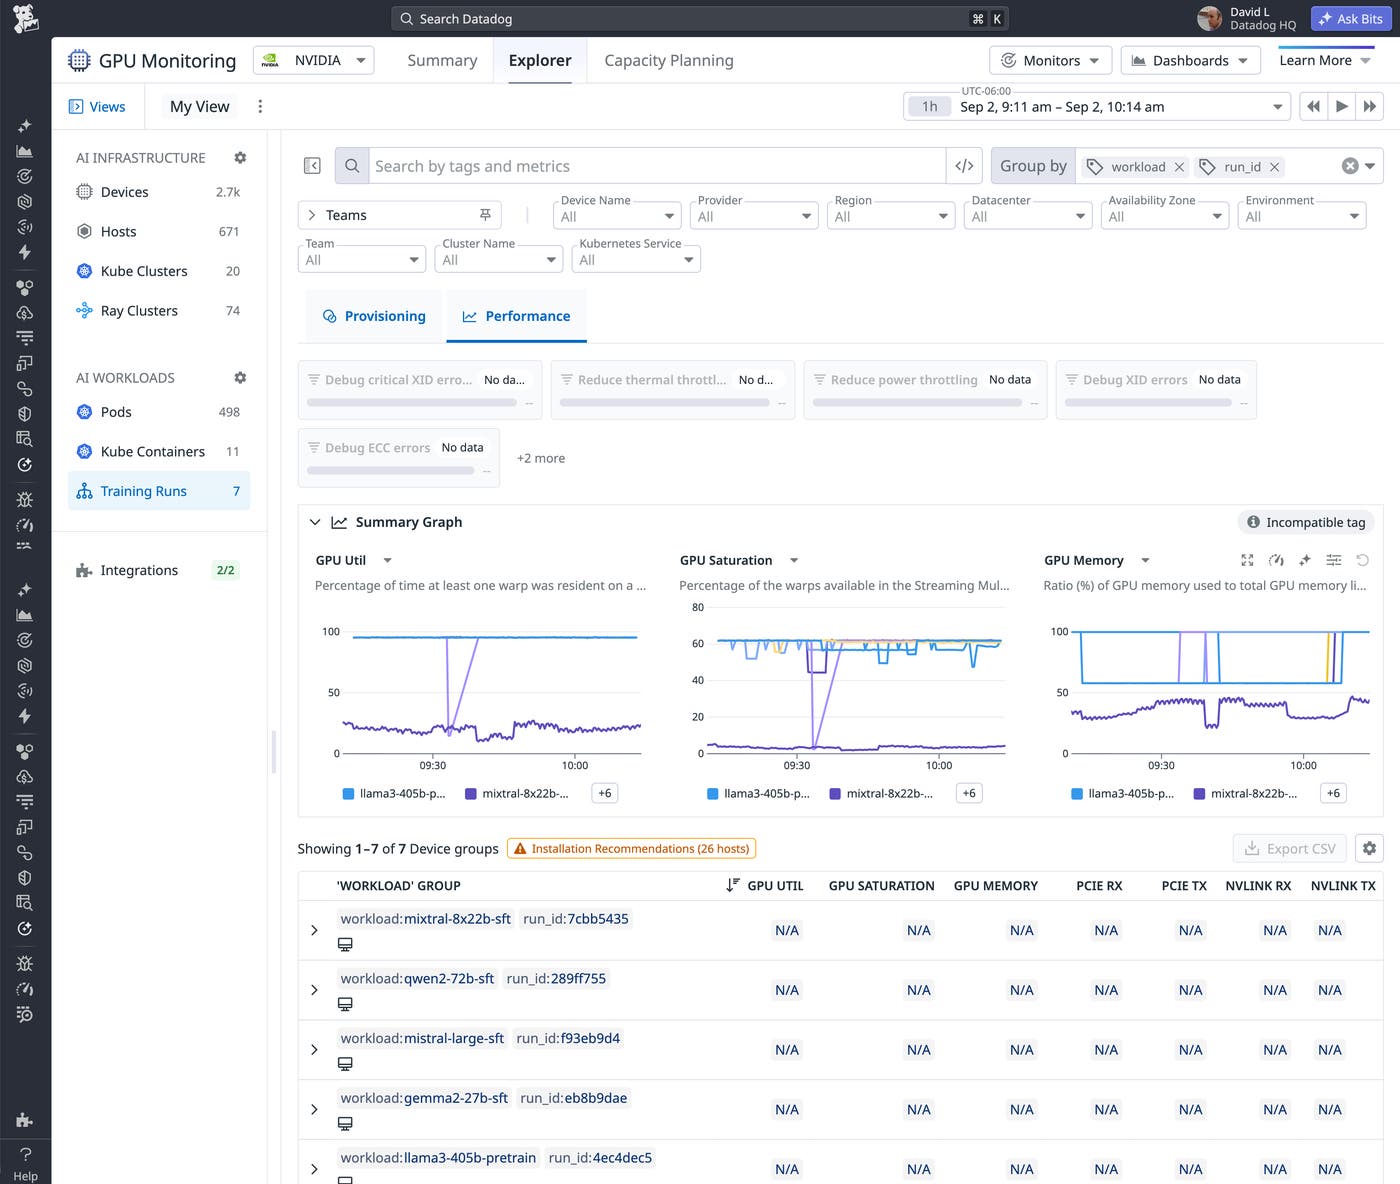
For same-node placements, monitor gpu.nvlink.throughput.data.tx and gpu.nvlink.throughput.data.rx to track NVLink throughput. The maximum attainable NVLink throughput varies with your specific GPU model and NVLink generation. Establish a baseline during a healthy training run and treat a significant drop from it as a hardware or driver problem, not a scheduling one.
For cross-node placements, monitor gpu.pci.throughput.tx and gpu.pci.throughput.rx to track PCIe activity associated with GPU data movement. By correlating those metrics with network or fabric telemetry, you can evaluate inter-node communication, which typically occurs in one of two contexts:
Cross-node, cross-rack: When placement has succeeded as intended but is cross-rack by design, elevated network or fabric utilization compared to a same-rack baseline is expected. Training throughput may also be slower, but that’s the expected inter-rack latency, not a misconfiguration.
Cross-node, intra-rack: If training throughput is lower than expected, check the Workload’s topology assignment, PodGroup state, GPU interconnect metrics, PCIe activity, and network or fabric telemetry data together. PCIe throughput alone cannot tell you whether traffic crossed a rack boundary.
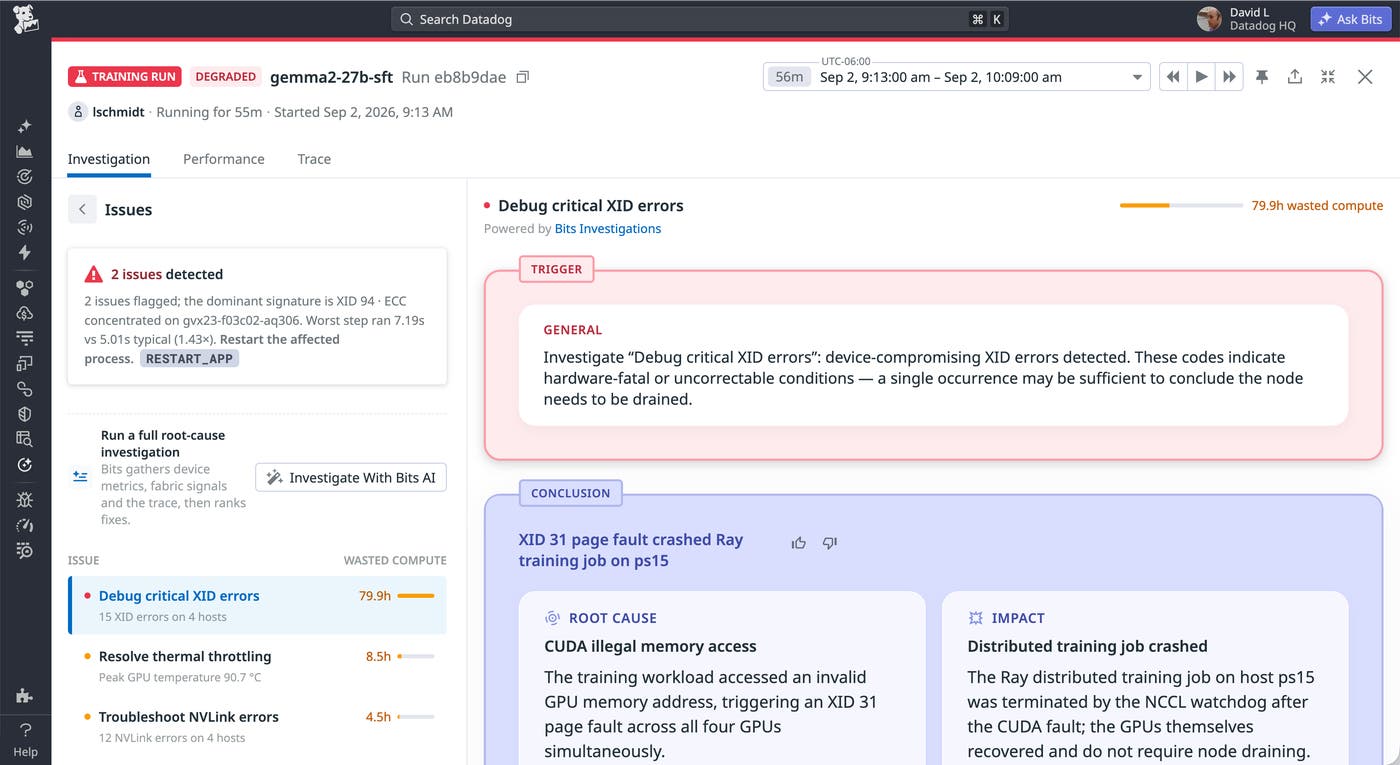
When training jobs stall despite a valid topology assignment and successful gang assembly, GPU Monitoring’s Training Optimization page (in technical preview) provides agentically-powered root cause analysis (RCA) to quickly pinpoint the issue. It evaluates driver issues, hardware health, and fabric degradation across the stack, rather than requiring manual investigation of each layer. Contact us to request access to the Training Optimization preview.
Distinguish training efficiency in Ray and other frameworks
A training job’s throughput is the primary indicator of progress across all frameworks. It can be measured as steps per second, tokens per second, or samples per second. A drop in throughput indicates that training is slower than expected. To determine whether that slowdown is caused by a scheduling problem, a hardware issue, or workload characteristics, correlate the throughput drop with bandwidth metrics from Datadog GPU Monitoring and PodGroup status from Coscheduling.
Ray provides additional scheduling-layer visibility through ray.placement_groups, which exposes the scheduling state of each placement group. A placement group that remains pending or infeasible means Ray cannot satisfy its placement requirements. This is typically because the required resources or placement constraints cannot currently be satisfied. GPU Monitoring captures these placement group states and surfaces RCA for stalled Ray training jobs.
Ray’s native dashboards and logs are ephemeral: They disappear when the Ray head node or cluster dies, taking any evidence of the stall with them. However, because Datadog collects these signals continuously, they remain available for retrospective investigation after the cluster is gone.
For teams running PyTorch DDP, Kubeflow operators, or Horovod, throughput is the available signal. If training throughput drops alongside a decline in gpu.pci.throughput.* or gpu.nvlink.throughput.*, inter-worker communication is degraded. When that pattern also coincides with PodGroup timeouts, the root cause is likely a scheduling or placement failure.
Beyond just metrics that reveal a slowdown has happened, GPU Monitoring also provides lightweight continuous tracing which reveals what the rank was doing, or waiting for, during that missing time. Tracing surfaces scheduling-level detail that metrics don’t expose on their own, so you aren’t limited to inferring problems from throughput trends. GPU Monitoring runs continuously and with minimal overhead, providing critical visibility without sacrificing training job performance. Contact us to request access to the continuous tracing with GPU Monitoring preview.
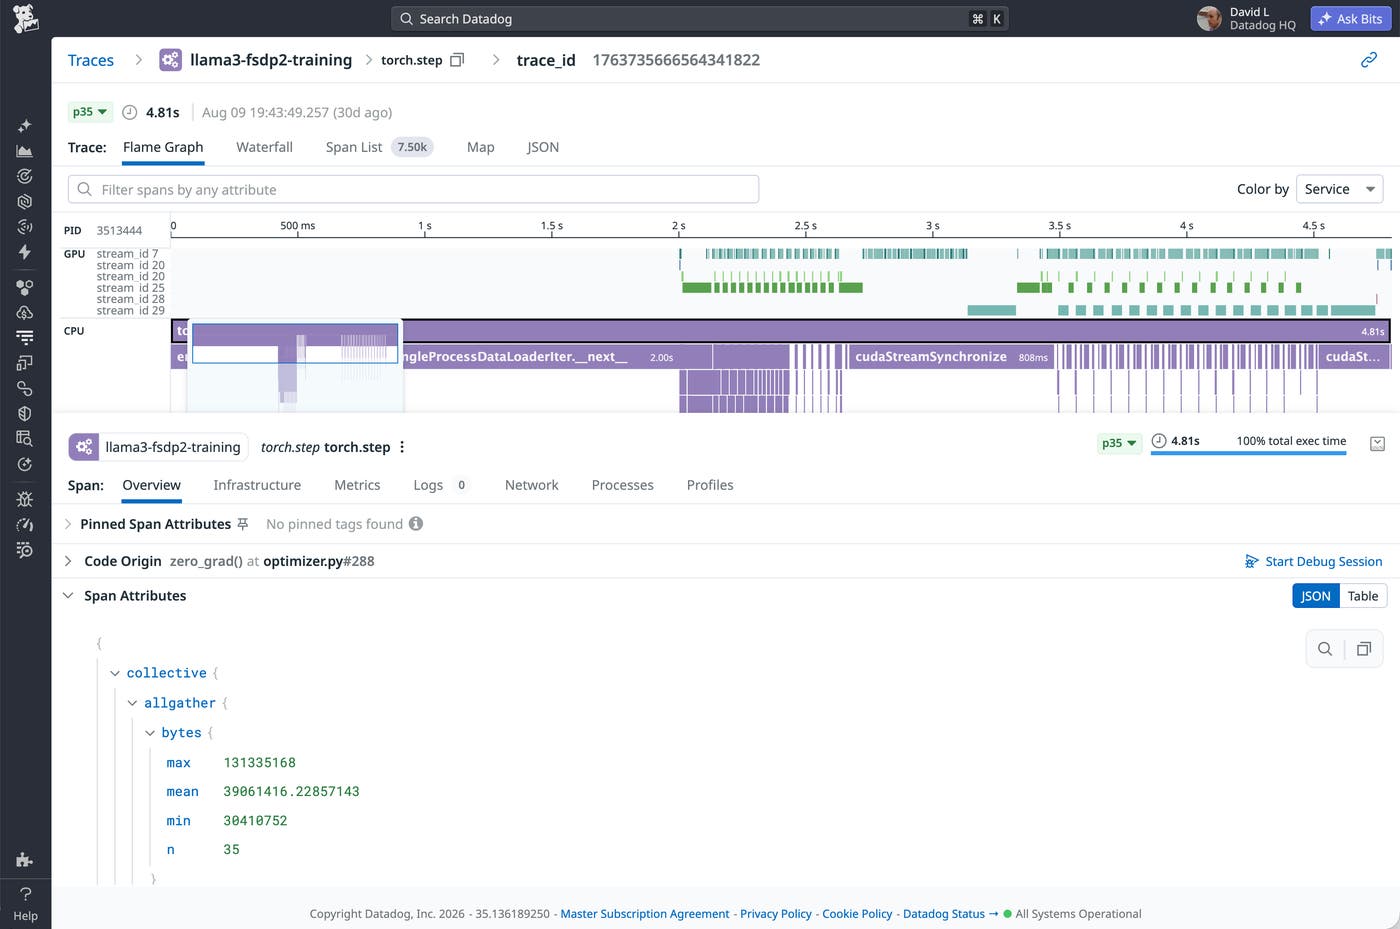
This screenshot illustrates a detailed execution trace which includes NCCL spans and correlates CPU activity directly to the actual GPU execution of these calls. It shows not just a single duration number, but surfaces that a rank was straggling due to delays in the data-loading operation. The span is tied directly to its source code origin, enabling you to take action and debug the issue quickly.
Get started monitoring AI training scheduling in Kubernetes
Monitoring distributed AI training scheduling in Kubernetes requires visibility across components that standard tooling doesn’t naturally connect: Kueue’s admission queue, Coscheduling’s gang assembly, the GPU interconnect, and the training framework. Applying a common topology tag across all of these signals enables you to monitor your clusters’ gang scheduling and TAS activity and helps you ensure that your training jobs make efficient progress.
To get started, read the Datadog Kubernetes Monitoring documentation and the GPU Monitoring documentation.
To monitor distributed AI training scheduling in Kubernetes, start a free 14-day Datadog trial.
