

Thomas Sobolik
Senior Technical Content Writer
Datadog’s 2026 State of AI Engineering report showed organizations’ LLM inputs swelling rapidly as context engineering expands. In March 2026, 69% of all input tokens in Datadog customer traces were for system prompts: internal instructions, policy definitions, and tool guidance providing context and guardrails around the user input. This suggests that most context engineering spend among Datadog customers is going toward optimizing repeating system prompts in heavily scaffolded agent systems.
Guardrails and tool guidance that are repeated verbatim across calls introduce a significant cost and latency bottleneck. Using prompt caching effectively can help mitigate this issue, but with model providers offering limited visibility into caching and its configurability, your team might be flying blind trying to understand how to structure prompts and—where possible—tune cache parameters to implement caching that works.
This post will introduce prompt caching as a way for organizations to reduce costs and latency as their context and agent scaffolding expands. We’ll walk through the key considerations and common strategies for implementing caching, then show you how to monitor agent request traces to evaluate your cache configuration and track token consumption and latency over time.
A quick primer on prompt caching
In an LLM’s attention mechanism, an identical prompt prefix always produces an identical intermediate state. Prompt caching works by having the provider store that state the first time a prefix is processed, reusing it on any later call that starts with an identical prefix. This means the model only computes attention over the new tokens rather than reprocessing the entire input from scratch.
Model providers’ caching implementations differ: Depending on the model you’re using, you may or may not have much control over time-to-live (TTL) or other common parameters used to tune a conventional cache. In this post, we’ll focus on how Anthropic and OpenAI handle caching.
Anthropic supports two ways to cache across all models. Automatic caching adds one cache_control field at the top level of a request and lets the breakpoint move forward on its own as a conversation grows. For more control over the cache, you can use explicit breakpoints to place cache_control fields directly on up to four individual content blocks (in the fixed order of tools → system → messages).
OpenAI’s caching is automatic on prompts of 1,024 tokens or more and requires no code changes: Eligible requests are routed to a server that recently handled the same prefix, and the matching portion is billed and processed as a cache read instead of being reprocessed. On GPT-5.6 and newer models, OpenAI also supports explicit cache breakpoints (prompt_cache_breakpoint) on individual content blocks.
Prompt caching can reduce your input costs, but cache writes cost more than uncached input. For example, Anthropic charges 1.25 times the base input rate for a five-minute cache write, 2 times for a one-hour write, and 0.1 times for a cache read. This makes a cached prefix roughly 90% cheaper to reuse, while adding a 25% premium to the initial five-minute write. A single cache hit within five minutes can offset that premium, but frequently changing prefixes—such as request-specific system prompts or timestamps near the beginning of the context—can trigger repeated writes and increase your total costs. To optimize caching costs, keep prefixes stable and deliberately structured, and monitor cache hit rate rather than raw token volume.
Optimize your prompts and set breakpoints for effective caching
Because caching depends on an exact prefix match, what typically gets cached in an agent system is the stable “top” of the prompt—the system instructions, tool and function definitions, safety and policy guardrails, and shared reference material—while the dynamic “bottom” of the prompt, such as the latest user message or a tool result, is processed fresh on every call. The more scaffolding your agent uses, the more top-heavy its prompts will be, which increases the potential input token savings from caching.
Once prefix context is inside the cache, even a small change can lead to a full invalidation, so it’s important to ensure that your agent isn’t adding to or changing the system prompt inside the cache boundary. Set cache breakpoints to include static, shared context and exclude dynamic inputs like the latest user message or tool output.
In multi-turn agent loops, the entire conversation history is re-sent on every turn, so it’s worth placing a second cache breakpoint at the end of the current conversation history. This way, only the newest turn needs fresh processing each time. Anthropic’s Claude Code team has written publicly that it builds its entire harness around this pattern, running production alerts and treating a dropping cache hit rate as an incident rather than a minor inefficiency.
For instance, let’s consider an agent used by SREs that queries metrics, searches through runbooks, surfaces service dependencies, and sends pages to on-call staff for incident investigations. This agent calls Claude Opus via the Anthropic Messages API, and each request includes tool definitions, the system prompt, and the current conversation history. It also includes static context pulled from users’ service catalogs (the SRE team refreshes this data on a fixed cadence). The following JSON shows how you’d set cache breakpoints to include all of the above while excluding the latest user message, which would break the cache:
{ "model": "claude-opus-4-8", "max_tokens": 1024, "cache_control": { "type": "ephemeral" }, "tools": [ { "name": "query_metrics", "description": "...", "input_schema": {} }, { "name": "search_runbooks", "description": "...", "input_schema": {} }, { "name": "get_service_dependencies", "description": "...", "input_schema": {} }, { "name": "create_incident", "description": "...", "input_schema": {} }, { "name": "page_oncall", "description": "...", "input_schema": {}, "cache_control": { "type": "ephemeral" } } ], "system": [ { "type": "text", "text": "You are an incident response copilot for the platform team. Always search runbooks before recommending a remediation. Never page on-call without human confirmation unless severity is SEV-1. Cite the runbook or dashboard behind every recommendation. Respond as: **Finding** / **Recommended action** / **Confidence**.", "cache_control": { "type": "ephemeral" } }, { "type": "text", "text": "Service catalog (manually refreshed by the SRE team on a fixed cadence): checkout-service (owner: payments-team, SLO p99<400ms) ... on-call: payments-team -> @jordan, identity-team -> @priya ...", "cache_control": { "type": "ephemeral" } } ], "messages": [ { "role": "user", "content": "PagerDuty alert: checkout-service p99 latency > 2s" }, { "role": "assistant", "content": "..." }, { "role": "user", "content": [{ "type": "tool_result", "tool_use_id": "...", "content": "..." }] }, { "role": "user", "content": "The runbook step didn't work, latency is still climbing — what next?" } ]}Because new messages are appended to the request body after the final breakpoint, Claude can successfully read all the preceding static context from the cache.
When structuring prompts for efficient caching, note that anything that rewrites earlier turns will bust the cache for everything after that point. That includes context compaction, memory updates, and summarization, so those context-management techniques come with a trade-off. A larger and more static initial prompt will be more cacheable, and the caching benefit has to outweigh the token-reduction strategies described.
Monitor your LLMs to measure latency and cost gains
Although model providers offer limited visibility into cache behavior, you can use a combination of cache utilization metrics and trace-based investigations to measure and troubleshoot the latency and cost effects of your caching setup.
Before trusting a caching setup in production, your teams can validate it by running their agents in staging and inspecting the usage fields in the API response. Anthropic reports cache_creation_input_tokens and cache_read_input_tokens, while OpenAI reports cached_tokens and, on newer models, cache_write_tokens. These metrics confirm whether the subsequent calls are actually reading from the cache rather than reprocessing the full prompt.
You can use these metrics to monitor cache usage trends, calculate the cache hit rate, and analyze token consumption savings from your caching strategy. The following screenshot shows how you might set up a dashboard for these insights. The dashboard also breaks down cache hit rate and cache writes by model. This provides stronger cost attribution signals by enabling you to understand the cache performance of costlier models and more easily correlate this with the corresponding workloads.
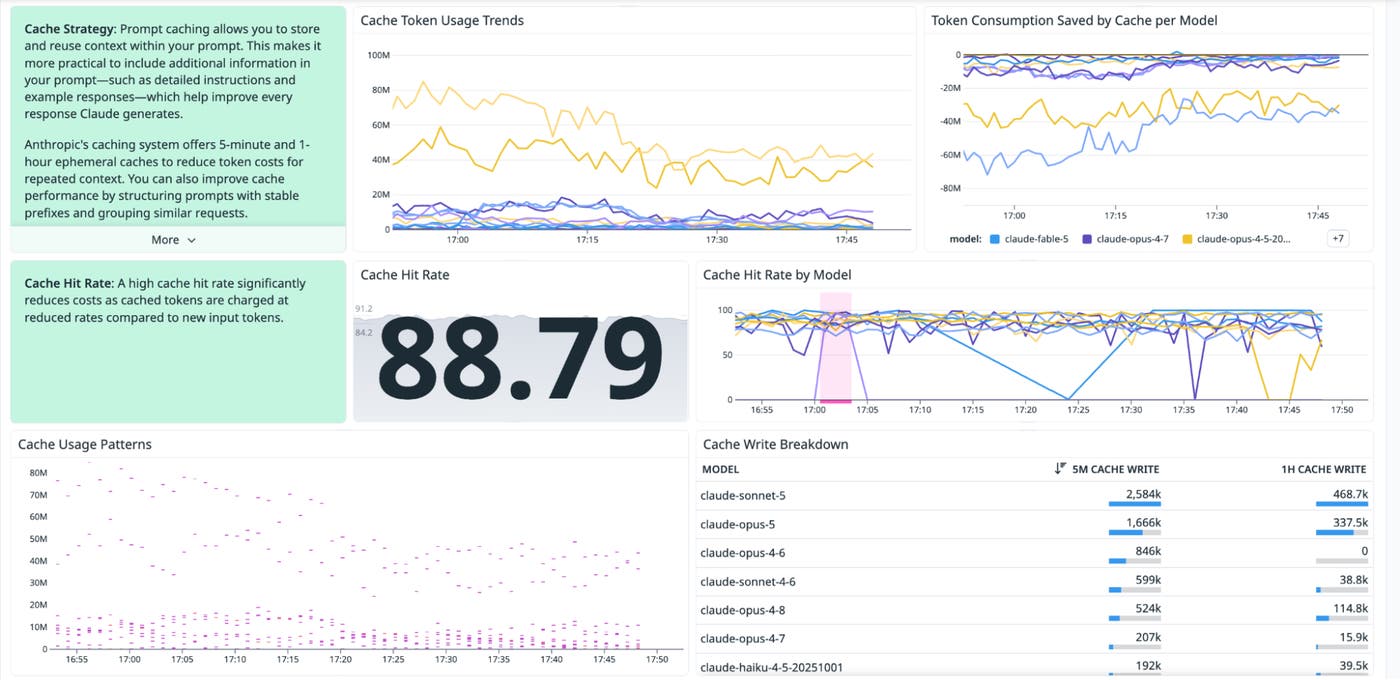
In production, you can measure these metrics alongside latency and cost (or token consumption), both at the level of each LLM call and rolled up across full agent traces. Collecting traces alongside cache metrics enables you to investigate the root causes of excessive cache writes and low cache hit rate in your agents. By comparing consecutive traces within a relevant user session, you can diagnose and troubleshoot common cache busters:
Changing tool order
Tools are serialized into the request in whatever order the array holds them. If you’re not careful, tool order can change between requests due to tools pulled from a set or dict without a stable sort, a relevance-ranked tool-selection step that reorders based on the current query, or a feature flag that conditionally inserts a tool in the middle of the list instead of at the end.
Compaction
When the context window fills up, you can retain the conversation history with compaction, which summarizes the conversation and replaces the full history with that summary. Of course, this overwrites the previously stored history and breaks the cache.
Injecting timestamps, request IDs, and other metadata into tool definitions
Some agent harnesses embed per-request context directly into a tool’s description to help the model reason. This could be something like “as of {current_time}” or a request ID baked into a tool’s instructions, which puts dynamic content inside a block that’s meant to be static and cached.
Monitor your cache to cut cost and latency
As agents lean on more tool definitions, guardrails, and reference material to work reliably, system prompts will keep eating a bigger share of every request. Without a deliberate caching strategy, teams will keep paying the full price in both tokens and latency to reprocess the same instructions on every single call. By structuring prompts and configuring cache breakpoints, you can help ensure that your calls will use the cache as efficiently as possible.
Datadog Agent Observability’s comprehensive tracing and our Anthropic and OpenAI integrations make it easy to monitor cache behavior, token usage, and LLM call latency in one place. See the Agent Observability documentation to get started.
If you’re brand new to Datadog, sign up for a 14-day free trial.
