
Jessica Manheimer
Product Marketing Manager

Maël Lilensten
Senior Product Manager
As .NET Multi-platform App UI (MAUI) becomes the default cross-platform UI framework in the Microsoft ecosystem, many teams are standardizing on it to build mobile applications for iOS and Android. However, observability has not kept pace with the shift in adoption. Developers often rely on unsupported community bindings or maintain their own wrappers around native iOS and Android SDKs, which introduces instability and ongoing maintenance. The retirement of Microsoft Visual Studio App Center has also left many teams without a clear path for monitoring crashes, errors, and user activity in production.
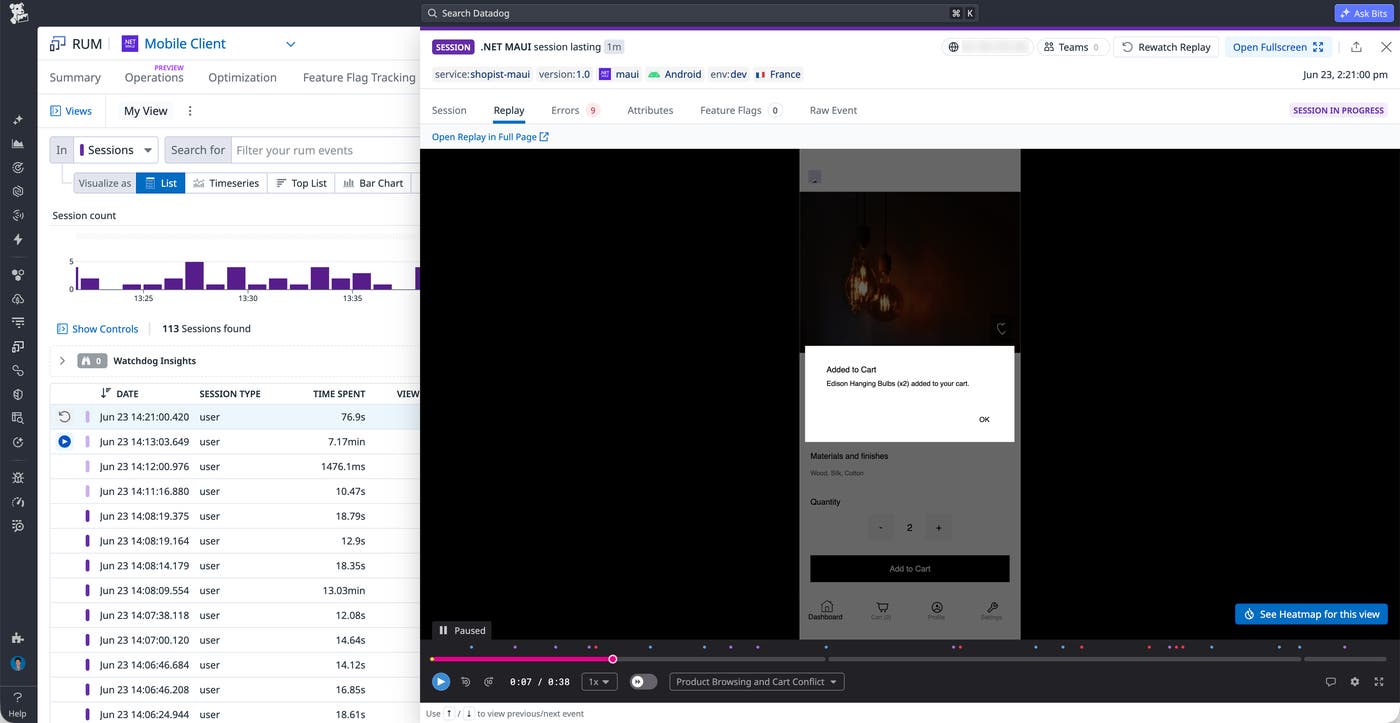
Datadog Real User Monitoring (RUM) provides an official .NET MAUI SDK that enables teams to instrument applications by using a single supported NuGet package. The SDK supports many core RUM features, including built-in crash reporting, error tracking, and network monitoring, along with Session Replay. All telemetry data flows into existing Datadog views, so you can analyze .NET MAUI applications alongside other mobile apps built with native iOS and Android or other cross-platform frameworks such as React Native, Flutter, and Kotlin Multiplatform.
In this post, we’ll explore how you can use the SDK to:
Detect and troubleshoot crashes in .NET MAUI apps
Mobile crashes in production often require significant effort to reproduce and diagnose, especially when stack traces are incomplete or difficult to interpret. Community-maintained bindings can compound the problem by introducing gaps in instrumentation or becoming incompatible with new SDK releases.
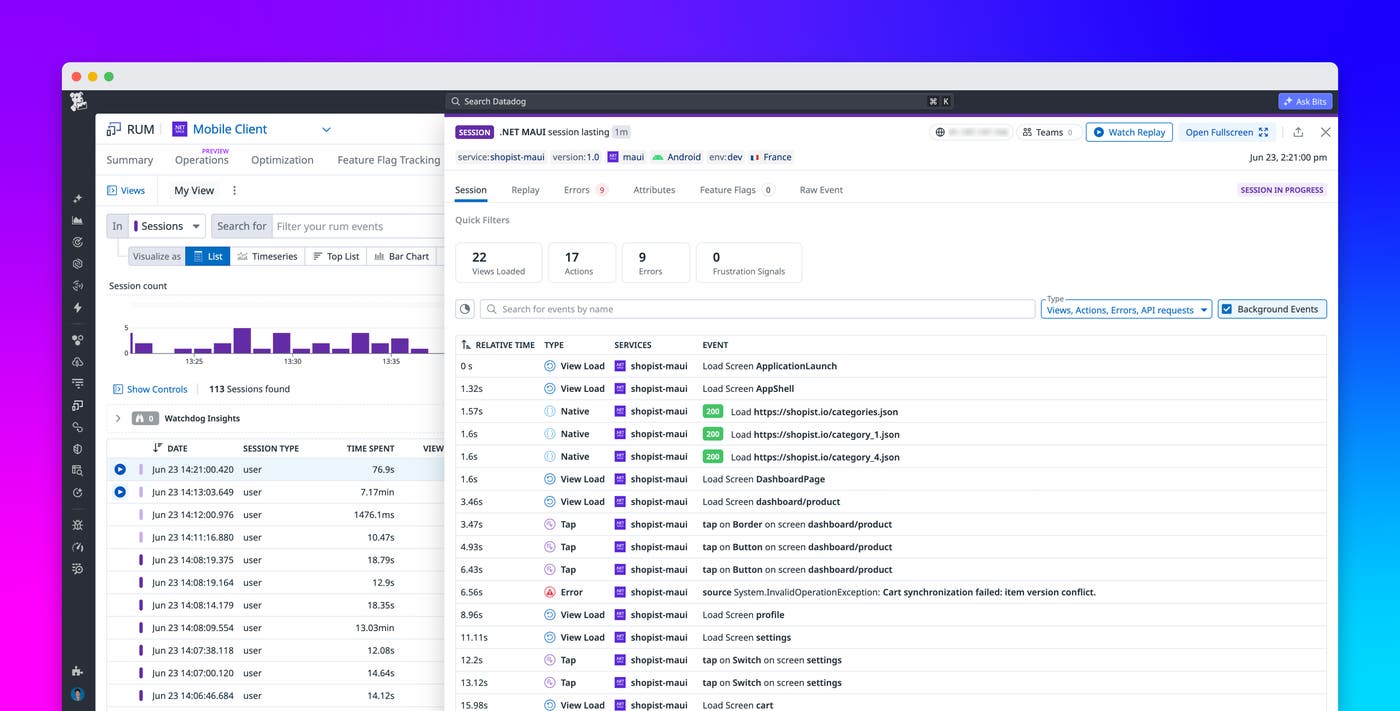
The Datadog .NET MAUI SDK automatically captures crashes and errors across managed and native layers of an application. Coverage includes .NET exceptions and platform-specific issues such as iOS App Hangs and Android Application Not Responding (ANR) events. Automatic instrumentation enables teams to begin collecting telemetry data without adding custom logic or maintaining separate integrations.
Datadog deobfuscates stack traces through its symbol upload process, which uses PDB files to restore readable method names and source context. Engineers can investigate issues with clear, actionable information instead of working with obfuscated output.
For example, consider a scenario where a team releases a new version of a .NET MAUI app and begins receiving crash reports shortly afterward. An engineer can navigate to Datadog Error Tracking, identify a spike in crashes tied to the new release, and review the associated stack traces. Correlating the crash with recent code changes helps the team isolate the faulty method and begin remediation.
Crash and error data from .NET MAUI apps appears alongside data from other supported mobile apps in the same Datadog views, including the RUM Explorer, Error Tracking, and session details pages. The shared interface enables teams to apply existing workflows without introducing additional tools.
Understand user sessions and performance across .NET MAUI apps
Understanding how users interact with an application and how services respond plays a key role in maintaining performance and reliability. Limited instrumentation often leaves teams without visibility into network latency, failed requests, and the sequence of user actions that led to issues.
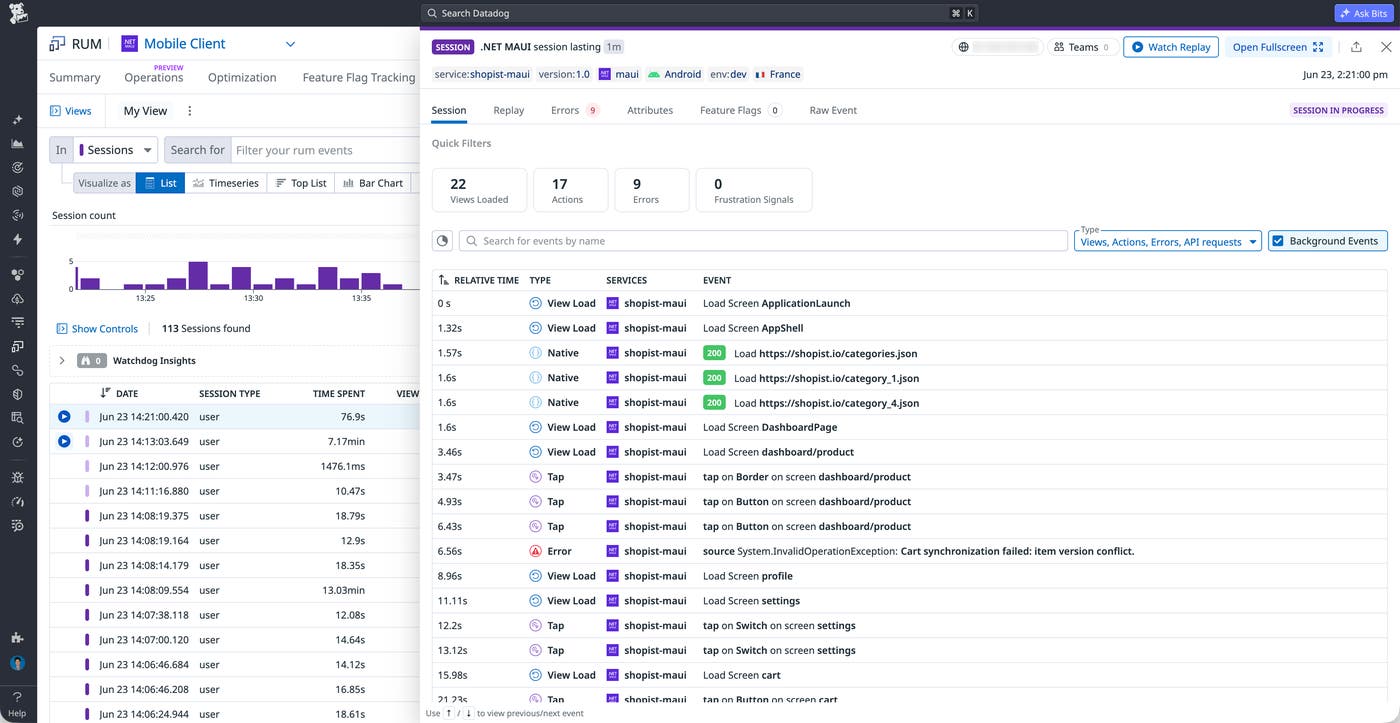
The .NET MAUI SDK automatically tracks network requests made through common libraries, such as HttpClient. Automatic collection provides out-of-the-box visibility into request latency and error rates, in addition to automated correlation with downstream backend dependencies through distributed APM traces.
View and action tracking give developers control over how user activity is captured and organized in session data. Developers can use views to track the screens that users navigate to. With actions, developers can capture user interactions that align with specific workflows.
Session, network, and interaction data all appear in the RUM Explorer and session detail pages. Teams can use the unified dataset to analyze performance and identify patterns across iOS, Android, and other supported platforms.
Get started with .NET MAUI monitoring in Datadog
The Datadog .NET MAUI SDK provides a supported path to instrument cross-platform mobile apps without relying on community-maintained bindings or custom wrappers. Automatic crash reporting, network monitoring, and manual instrumentation capabilities give teams visibility into application health and user behavior. To learn more, read our .NET MAUI SDK documentation.
If you’re new to Datadog, you can sign up for a 14-day free trial to start monitoring your .NET MAUI apps.
