
Mathew Estafanous
Software Engineer

Wassim Dhif
Engineering Manager

David Lentz
Senior Technical Content Writer
For teams that own an application running on Kubernetes, updating its observability configuration should be as straightforward as updating any other Kubernetes resource. But configuring integration checks, log collection, and tracing often means working across multiple configuration paths. If those settings live in pod annotations, adding a metric check or changing log processing rules requires a Deployment rollout. If they live in Datadog Agent configuration files, an application team must coordinate the change with the platform team, which may need to restart the Agent.
The DatadogInstrumentation custom resource provides a Kubernetes-native way to manage observability configuration for individual workloads. DatadogInstrumentation brings integration checks, log collection, and Application Performance Monitoring (APM) settings into a single Kubernetes custom resource. Unlike pod annotations, which require an application rollout to change, DatadogInstrumentation applies check and log changes at runtime, without restarting the application or the Agent. Application teams can configure observability by using the same tools and workflows they use to manage their Deployments. Platform teams retain control of the Datadog Agent deployment.
In this post, we’ll show you how to use DatadogInstrumentation to:
Configure observability for a specific Kubernetes workload
Instead of spreading observability settings across pod annotations and Agent configuration, teams consolidate them in one DatadogInstrumentation manifest for each workload and manage that manifest through version control.
Consider an example team that operates a checkout application and manages it with a Deployment in the apps namespace. To configure the application’s observability, the team uses a DatadogInstrumentation resource alongside its Deployment manifest. When the team needs to change what telemetry data it collects, it edits the resource and reviews the change in a pull request. It then applies the change through its GitOps workflow, just as it does for its Deployment.
Define metrics, logs, and traces in one resource
Moving the checkout service to DatadogInstrumentation replaces two separate configuration sources with one resource. The following example walks through the equivalent DatadogInstrumentation resource, then shows how the team applies and verifies it.
Without DatadogInstrumentation: Settings split across the DatadogAgent resource and annotations
The checkout team’s observability settings live in two places. The platform team deploys the Agent with the Datadog Operator and maintains APM targeting rules in the Operator’s DatadogAgent resource, including a rule that selects the checkout pods and configures their Java SDK and trace settings. The checkout team configures its HTTP check and log collection as JSON in annotations on the Deployment’s pod template.
With this split, a tracing change means asking the platform team to edit its DatadogAgent resource. A change in checks or log configuration requires editing the pod template, which triggers a rollout of the application.
With DatadogInstrumentation: Checks, logs, and APM in one resource
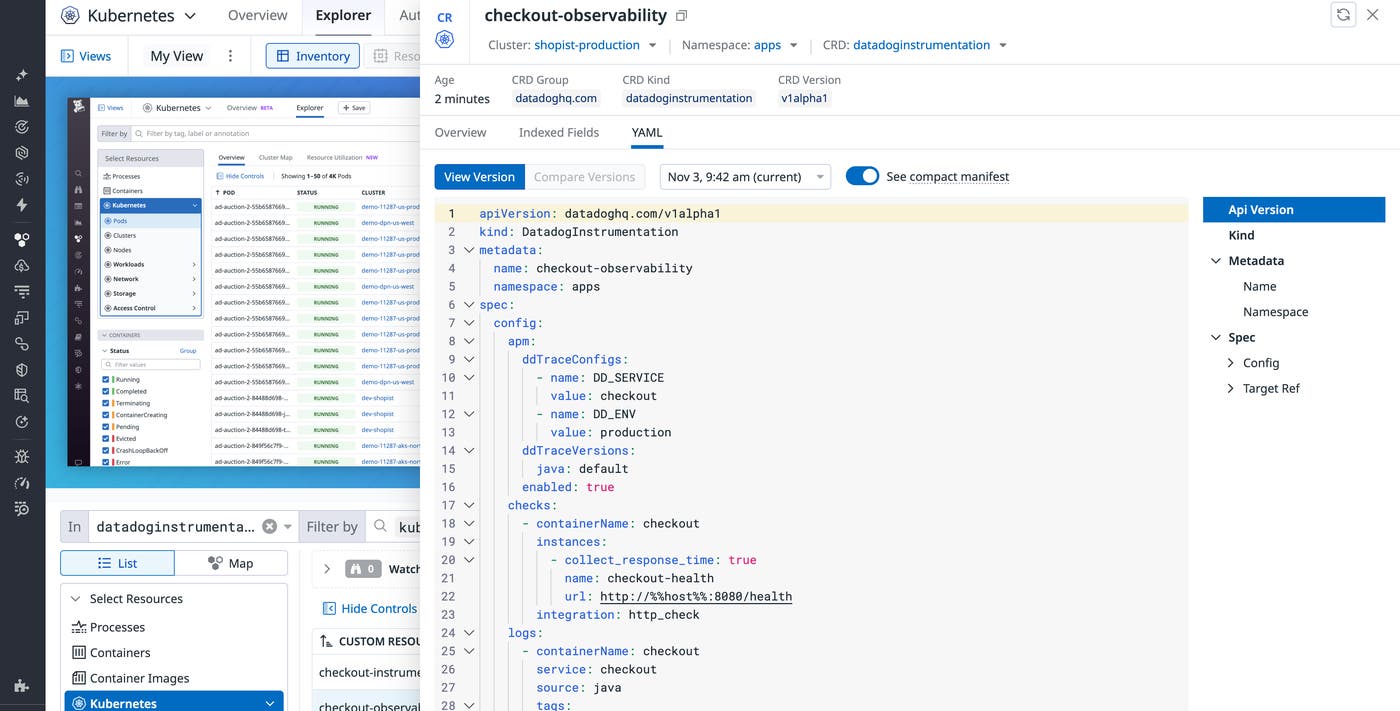
After adopting the DatadogInstrumentation custom resource definition (CRD), the checkout team consolidates these settings into a single Kubernetes resource. In the following example, the spec.targetRef points to the checkout Deployment and the spec.config specifies how the Datadog Agent collects metrics, logs, and traces from that application.
apiVersion: datadoghq.com/v1alpha1kind: DatadogInstrumentationmetadata: name: checkout-instrumentation namespace: appsspec: targetRef: apiVersion: apps/v1 kind: Deployment name: checkout config: checks: - integration: http_check containerName: checkout instances: - name: checkout-health url: "http://%%host%%:8080/health" collect_response_time: true logs: - containerName: checkout source: java service: checkout tags: - env:production - team:checkout apm: enabled: true ddTraceVersions: java: "default" ddTraceConfigs: - name: DD_SERVICE value: checkout - name: DD_ENV value: productionMetrics: The spec.config.checks section defines the HTTP check as structured YAML instead of embedded JSON. The check polls the checkout container’s /health endpoint and records response times, and containerName selects the container to check. The Autodiscovery template variable %%host%% resolves the container’s IP address at runtime, so the configuration doesn’t depend on hardcoded addresses that change as pods are replaced.
Logs: The spec.config.logs section sets the logs’ source and service values for the checkout container and adds tags. See Kubernetes log collection with DatadogInstrumentation for more information about collecting logs.
Traces: The spec.config.apm section enables Single Step Instrumentation (SSI) for the workload. ddTraceVersions selects the Java SDK, and ddTraceConfigs sets the service name and environment—the same settings the platform team set in its DatadogAgent targeting rule, but the checkout team now owns them. The resource’s targetRef selects the workload. SSI adds the specified SDK to eligible application pods when they’re created.
Apply the resource and verify the configuration
DatadogInstrumentation provides configuration feedback through Kubernetes. The Cluster Agent validates the resource at apply time, so in the case of an invalid configuration, kubectl apply returns an error.
After successfully applying the resource, the team checks its ChecksReady, LogsReady, and APMReady status conditions with kubectl describe to diagnose any issues:
kubectl describe datadoginstrumentation checkout-instrumentation -n appsThe status conditions confirm that the Cluster Agent accepted each section of the configuration:
Status: Conditions: Message: 1 check(s) configured for Deployment/checkout Reason: Configured Status: True Type: ChecksReady Message: 1 log config(s) configured for Deployment/checkout Reason: Configured Status: True Type: LogsReady Message: APM settings configured for Deployment/checkout; restart the workload to apply them Reason: Configured Status: True Type: APMReadyTo verify the data collection, the team checks Datadog to see network.http.can_connect and network.http.response_time metrics, logs from the checkout service, and, once the pods have been replaced, traces from checkout in APM.
Change observability configuration independently of application releases
Suppose the checkout team is investigating intermittent slow requests and needs to change what it collects. It wants to see additional application metrics to understand the cause of any backlogs, mask customer email addresses in its logs, and enable profiling to identify where requests spend time. The team makes all three changes in its existing DatadogInstrumentation resource following its GitOps workflow, without changing the Deployment or the Agent configuration.
Add an OpenMetrics check
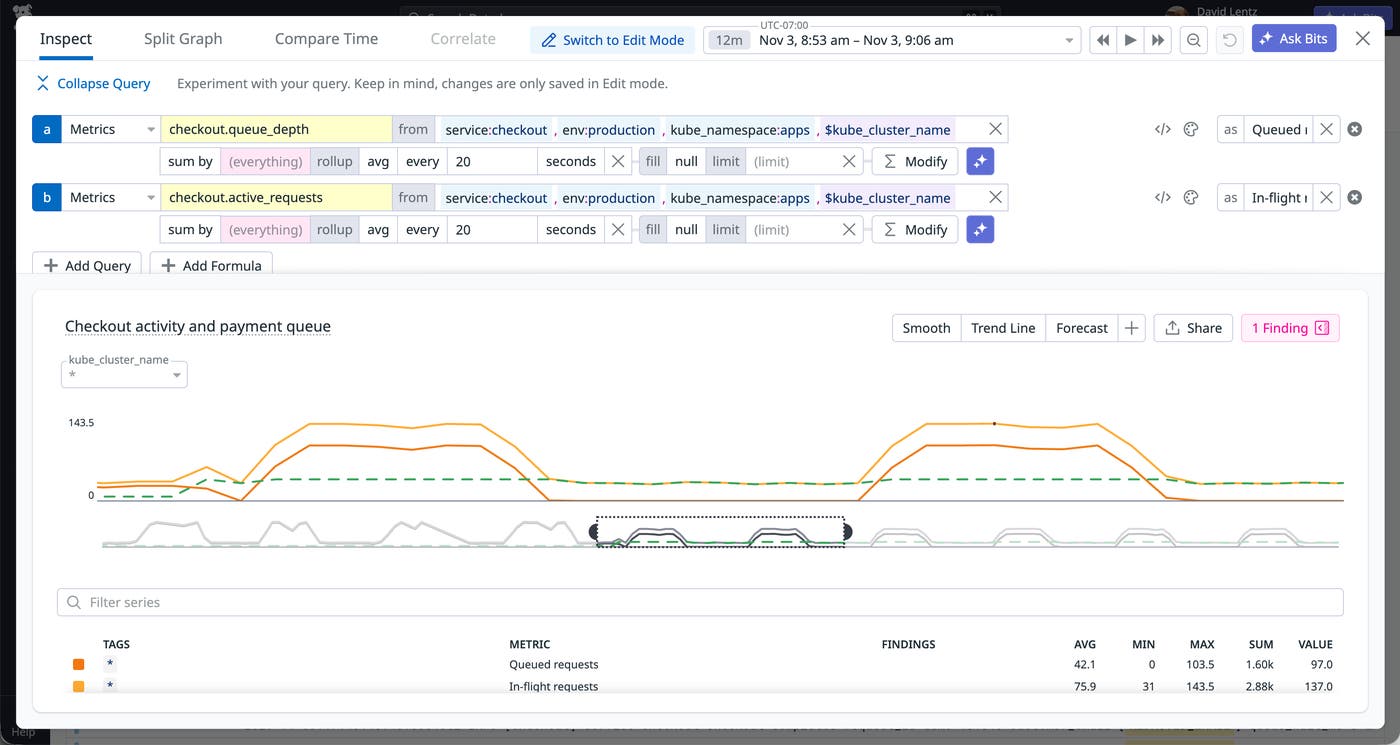
To see whether slow requests correlate with a growing backlog, the team adds an OpenMetrics check alongside its existing HTTP check. The new integration: openmetrics entry shown here collects checkout_active_requests and checkout_queue_depth from the application’s /metrics endpoint and reports them as checkout.active_requests and checkout.queue_depth.
config: checks: - integration: http_check containerName: checkout instances: - name: checkout-health url: "http://%%host%%:8080/health" collect_response_time: true - integration: openmetrics containerName: checkout instances: - openmetrics_endpoint: "http://%%host%%:8080/metrics" namespace: checkout metrics: - checkout_active_requests: active_requests - checkout_queue_depth: queue_depthAfter the team applies the updated resource, the new check takes effect without requiring an application rollout or Agent restart.
Mask sensitive data in logs
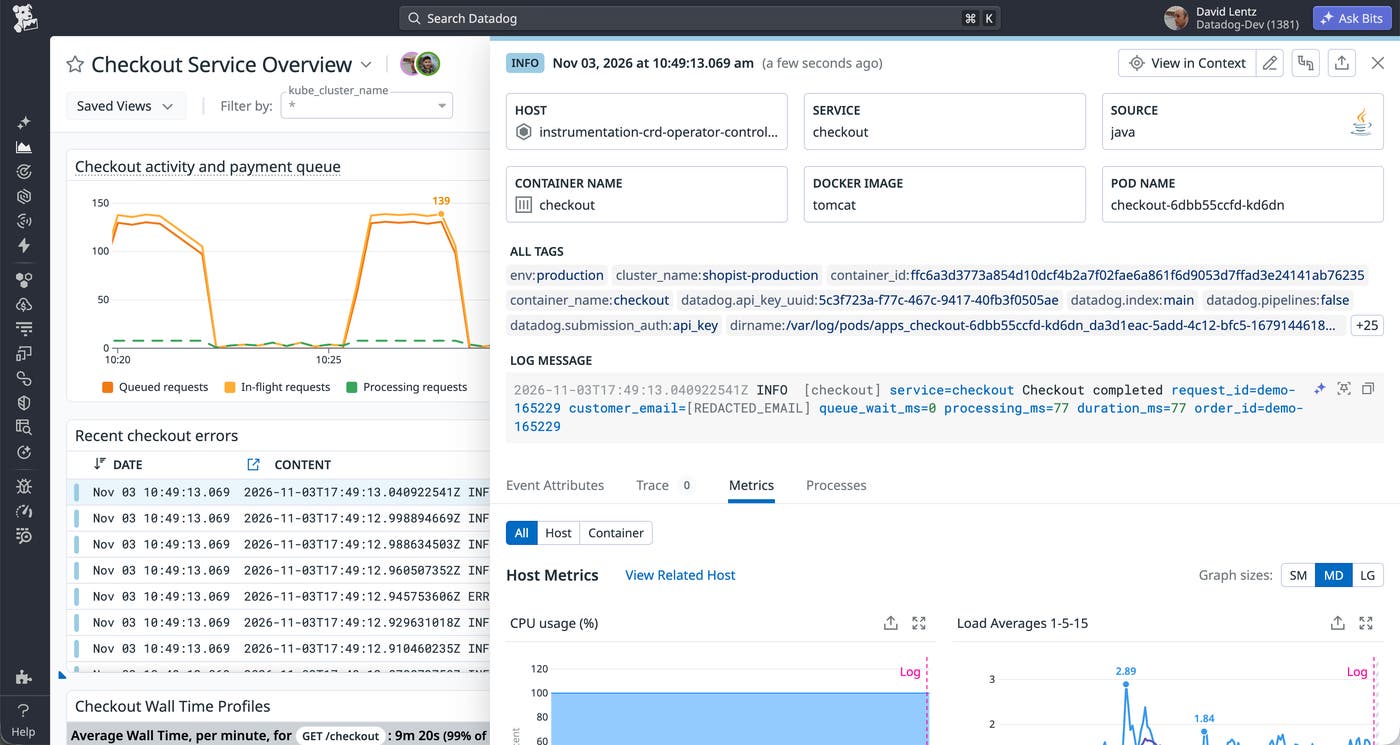
Next, the team adds a processing rule that masks email addresses so logs can be viewed and shared without compromising privacy:
logs: - containerName: checkout source: java service: checkout tags: - env:production - team:checkout log_processing_rules: - type: mask_sequences name: mask_email_addresses pattern: '[A-Za-z0-9._%+-]+@[A-Za-z0-9.-]+\.[A-Za-z]{2,}' replace_placeholder: '[REDACTED_EMAIL]'The mask_sequences rule replaces any email address in a log message with [REDACTED_EMAIL] before the Agent sends the log to Datadog, so customer email addresses in logs aren’t stored. As with the new check, the updated log configuration takes effect without an application rollout or Agent restart. The team can inspect the resource status for configuration feedback, then check logs in Datadog to verify that data is being redacted.
Enable Continuous Profiler
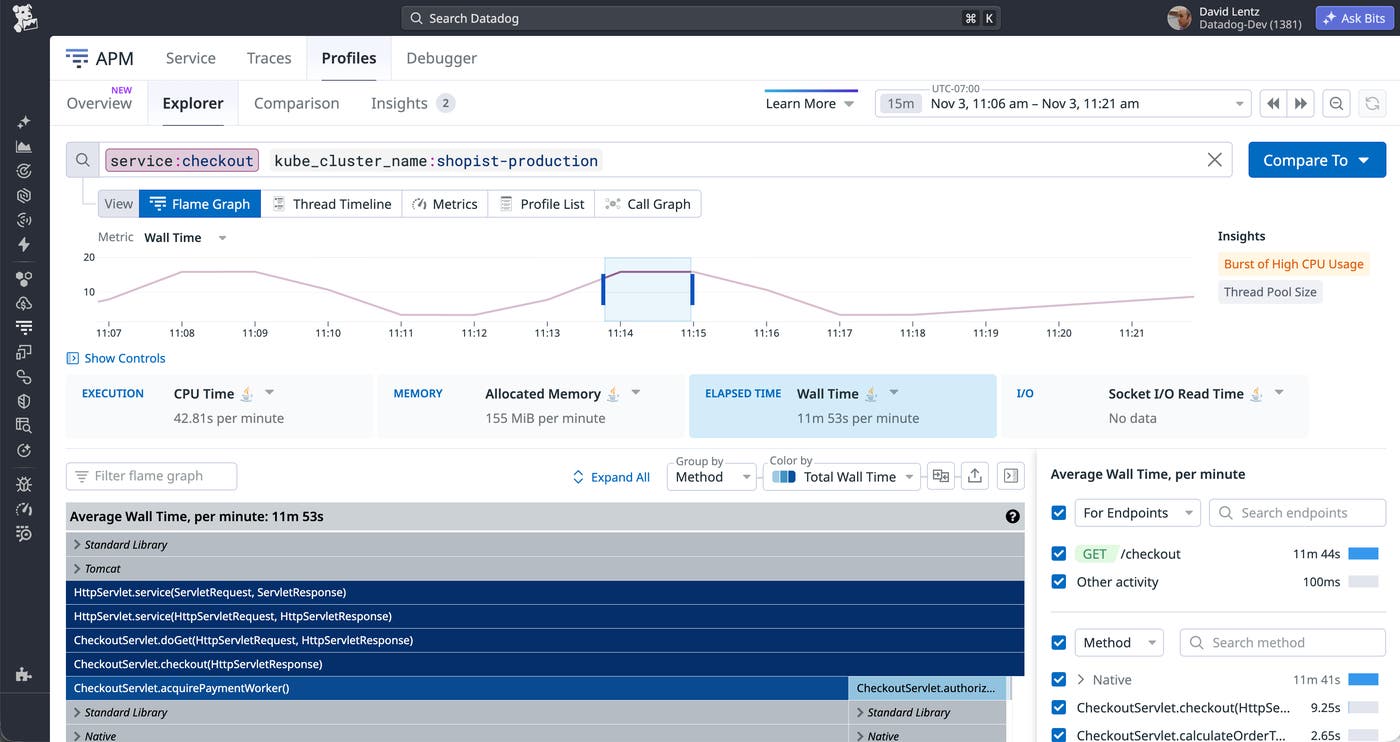
Finally, the team enables profiling in its APM configuration so they can troubleshoot any backlogs by visualizing where requests spend their time:
apm: enabled: true ddTraceVersions: java: "default" ddTraceConfigs: - name: DD_SERVICE value: checkout - name: DD_ENV value: production - name: DD_PROFILING_ENABLED value: "auto"Adding DD_PROFILING_ENABLED to spec.config.apm.ddTraceConfigs enables Continuous Profiler through the Java tracer, and the auto value profiles only eligible processes, as the SSI documentation recommends. Because the change applies only to new pods, the team triggers a rollout to replace the existing ones. The Continuous Profiler shows that most threads’ wall time is spent waiting for a payment worker to become available, represented by the acquirePaymentWorker span.
Get started with DatadogInstrumentation
With DatadogInstrumentation, application teams change checks and logs on their own schedule, without an application rollout or an Agent restart. Every change in this post’s example happened in the same resource. Changes to tracing and profiling take effect when pods are created, so the team applies them with its next rollout. Platform teams continue to manage the Datadog Agent deployment, while workload owners configure the checks, logs, and traces their services need.
The example in this post, which combines checks, logs, and APM, requires Datadog Agent and Datadog Cluster Agent (both v7.85 or later), with Datadog Operator v1.31 or later or Datadog Helm chart v3.255.0 or later. To get started, install the DatadogInstrumentation CRD with the Datadog Operator or the Datadog Helm chart.
Next, follow the DatadogInstrumentation Autodiscovery setup guide, which lists version requirements and supported workloads. For configuration options, see the documentation for Kubernetes log collection and workload-specific APM instrumentation.
If you don’t already have an account, you can sign up for a free 14-day trial.
