
Allie Rittman
Senior Product Manager

Robert Li
Engineering Manager

Kelland Goodin
Product Marketing Manager
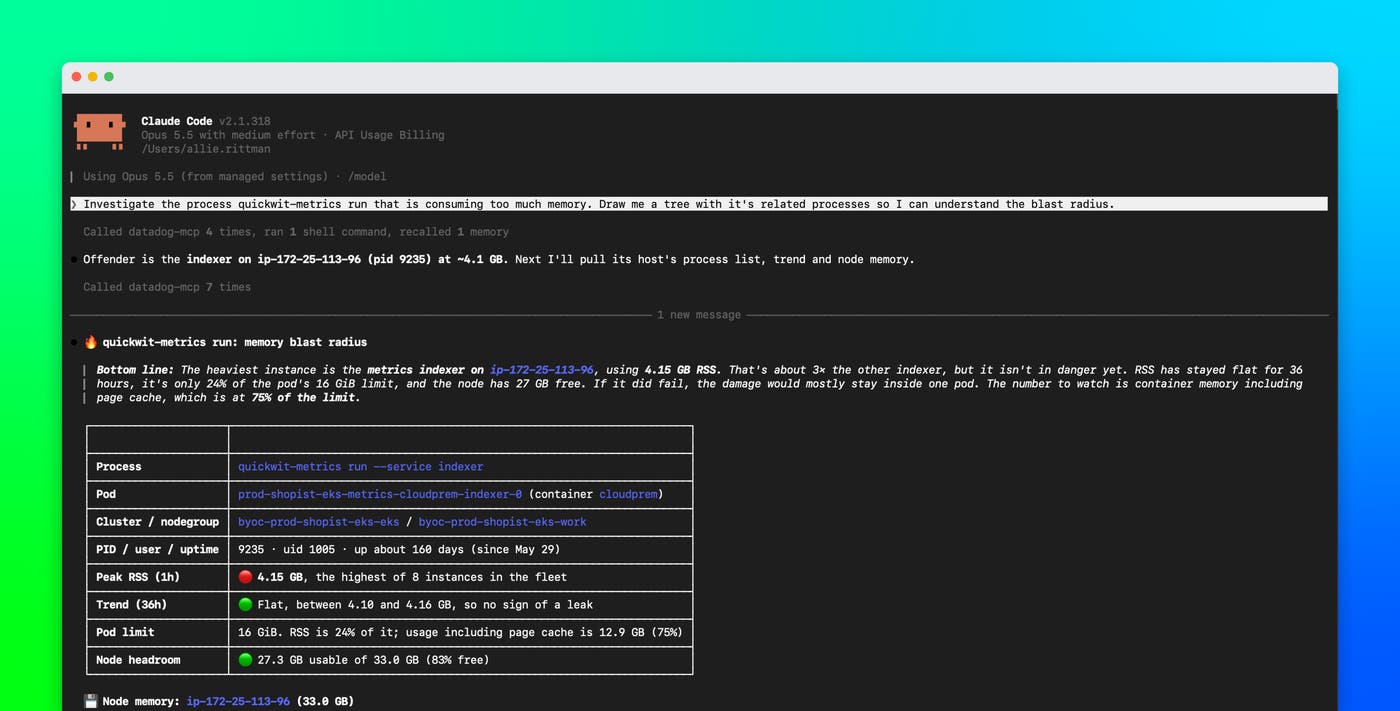
When investigating issues with a Kubernetes service, SREs and platform engineers need to understand what’s happening across its supporting infrastructure. For example, is a process still running? Did it restart? Is the scheduler struggling to place pods? Finding the answers to these questions often requires engineers to search process inventories, examine resource metrics, and query Kubernetes control plane telemetry. AI agents can help with these investigations, but they need access to the right data and enough context to interpret it. Otherwise, they may spend excess time discovering available metrics and constructing queries, or end up working with incomplete information.
The Datadog MCP Server connects AI assistants to observability data in Datadog through the Model Context Protocol (MCP). We’ve expanded our MCP Server’s infrastructure investigation capabilities with Kubernetes control plane health tools, Live Processes search, and a processes skill that guides agents toward the appropriate data source for each question. Together, these capabilities help agents investigate infrastructure issues by using process observations, resource metrics, and control plane health signals collected by Datadog.
In this post, we’ll show how you can:
- Check Kubernetes control plane health in a single call
- Give agents process-level evidence with Live Processes search
- Answer broader process questions with the processes skill
Check Kubernetes control plane health in a single call
Kubernetes control plane issues can affect workloads even when the underlying nodes appear healthy. For example, pods that remain in Pending might indicate scheduling problems, while slow kubectl responses can point to API server latency or resource contention. Diagnosing these problems requires examining different metrics depending on which control plane component is affected.
The Datadog MCP Server provides four read-only tools that enable AI agents to assess the health of a Kubernetes cluster, retrieving a set of relevant health metrics for a specific cluster in one call:
API server: Examine request error rates, rate-limited client requests by verb and resource, maximum in-flight requests, requests rejected by API Priority and Fairness, and queued requests by priority level.
Scheduler: Review scheduling attempts, scheduling attempt duration, scheduling algorithm duration, and pod scheduling duration to identify delays in placing workloads.
Controller manager: Inspect work queue depth, additions to work queues, processing duration, time spent waiting in queues, goroutine counts, and thread counts.
etcd: Check leader availability, leader changes, failed write proposals, backend commit duration, write-ahead log (WAL) fsync duration, and peer round-trip time.
Each tool accepts a Kubernetes cluster name through the kube_cluster_name parameter and an optional time window. The default window is the last 10 minutes, and queries can cover up to 4 hours. Before querying metrics, the tool checks whether Datadog recognizes the specified cluster.
For example, suppose pods in the checkout-cluster cluster have remained in Pending for 20 minutes. You can ask your AI assistant, “Pods have been stuck in Pending on checkout-cluster for 20 minutes. Is the scheduler keeping up?” The agent can call the scheduler health tool to retrieve scheduling attempts and duration metrics for that cluster. By examining the returned signals, it can help determine whether scheduling delays warrant further investigation. You can also ask whether etcd has experienced leader changes or slow commits over the past hour, or request a broader assessment of control plane health.
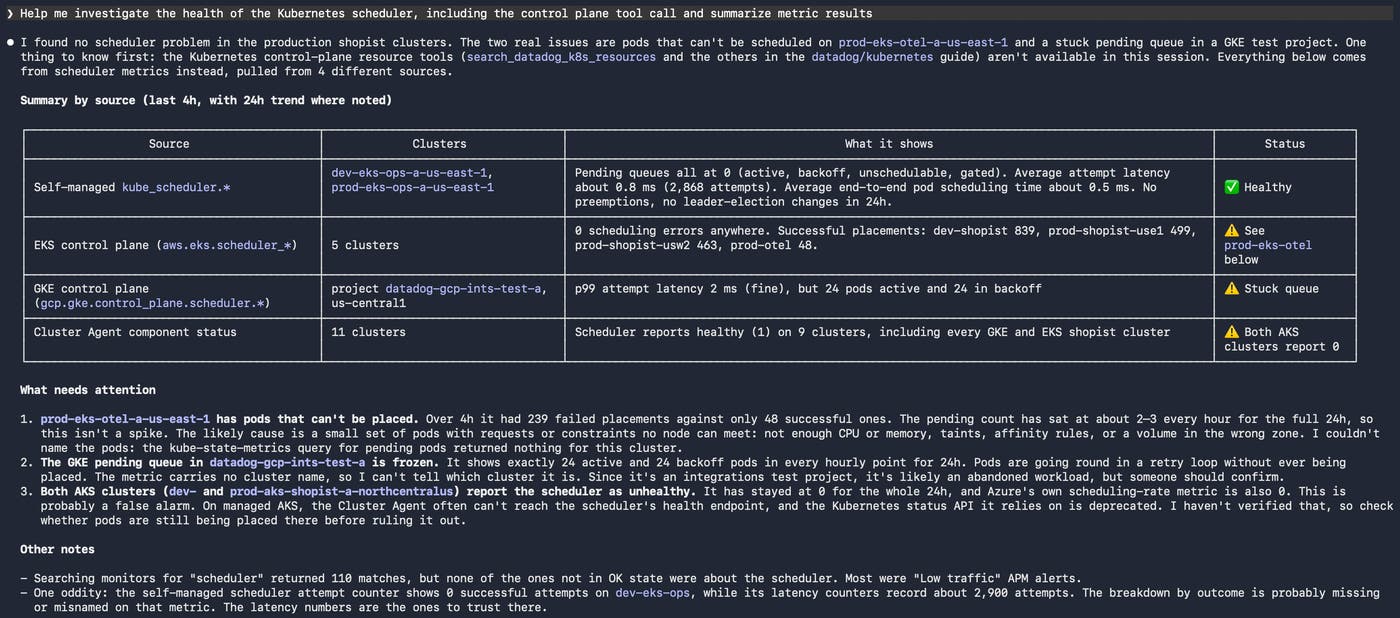
With these tools, agents can investigate control plane issues without first searching the metric catalog or constructing individual queries for each signal. Each metric the tools provide includes:
A plain-language description
An individual status of
OK,no data, orerrorto help agents distinguish missing telemetry from successful query results, and so that a missing metric does not cause the entire tool call to failThe exact Datadog query used to retrieve the metric, which engineers can reuse in dashboards, notebooks, or monitors to examine the metric during future incidents
The tools operate on telemetry data already collected by Datadog. They do not execute commands inside Kubernetes clusters or modify cluster resources. Access follows the calling user’s permissions, including Timeseries Query, Metrics Read, and Hosts Read.
The control plane tools complement our existing Kubernetes MCP tools, which help agents find and inspect Kubernetes resources. An agent can use those tools to investigate affected workloads, then query the control plane tools to determine whether cluster-level behavior might explain the symptoms.
Give agents process-level evidence with Live Processes search
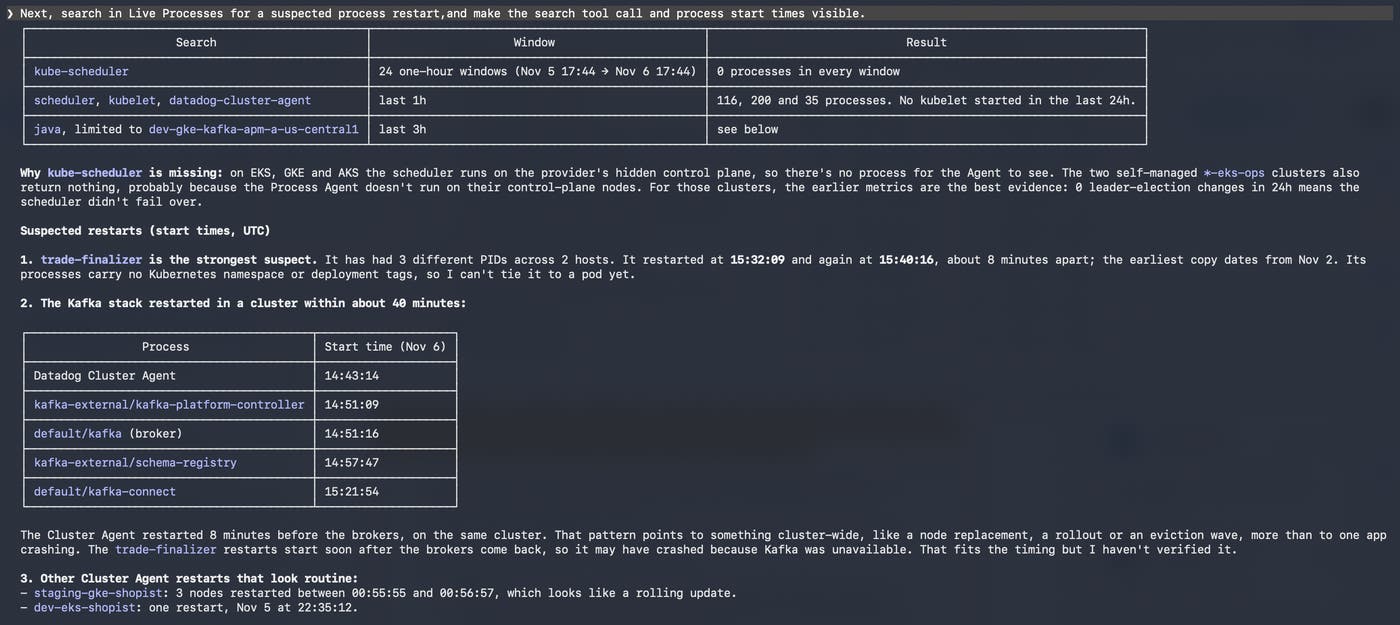
The search_datadog_live_processes tool gives AI agents access to recent process observations collected by Datadog’s Live Processes. Agents can search for processes by executable, command line, tags, or observation time to investigate whether a process is running, when it started, and which user owns it.
Process-level evidence is useful when service metrics indicate a problem but do not explain the behavior of an individual process. For example, a service might experience intermittent failures because a process restarted, or an engineer might need to confirm which command-line arguments a process received when it started.
The Live Processes search tool returns information including:
Executable name and command line
Process ID (PID) and parent process ID (PPID)
Process owner and host
Process start time and last observation time
Process tags
Agents can filter observations by searching executable names or command lines, or by using exact tags such as host, service, env, Kubernetes metadata, and user:<name> for process ownership. The tool searches for a default window of 15 minutes. Live Processes retains observations for 36 hours, and individual queries can cover up to 1 hour.
Suppose an engineer suspects that PostgreSQL restarted on a production database host. They can ask, “Did the Postgres process on db-prod-03 restart within the last day?”
The agent can search process observations for the specified host and executable, then compare process start times to identify evidence of a restart. Similarly, an engineer could ask which processes the deploy user is running on a host or which command-line arguments NGINX is using on checkout hosts.
In an internal evaluation against live production data, Datadog tested the Live Processes search tool across 10 natural-language scenarios, with three runs per scenario. Answer correctness increased from 10% without the tool to 96.7% with it—i.e., in 96.7% of runs, the returned process records matched the public API. These results indicate how direct access to process observations can improve agent responses for the evaluated questions.
Keep process search results within an agent’s context budget
A single process in a Kubernetes environment can carry more than a hundred tags from its host, container, cluster, and cloud environment. Returning every tag for every process can consume much of an agent’s available context before it has analyzed the results. The Live Processes search tool limits response size to help agents work with process data from heavily tagged infrastructure.
The tool enforces a token budget of 10,000 tokens by default. It also provides pagination cursors and indicates when results have been truncated. Agents can use this information to recognize incomplete responses and refine their searches.
For broad process inventory or counting questions, agents can set include_tags: false to omit detailed tag information. This reduces the size of each process record and allows more processes to fit in a response. For targeted investigations, agents can retain tags to identify the processes associated with a particular service, host, or Kubernetes workload.
Datadog also removes secrets from returned command lines before passing them to the agent. The search tool is read-only and uses the calling user’s Hosts Read permission.
Answer broader process questions with the processes skill
Live Processes search provides evidence about individual processes. For questions involving process discovery, instrumentation coverage, or resource consumption over time, agents need to choose from additional Datadog data sources.
The datadog/infrastructure/processes skill helps AI agents choose the appropriate Datadog data source for process-related questions. The skill provides guidance on process discovery, Live Processes observations, and process metrics, including which data to query and how to interpret the results.
Datadog provides three complementary sources of process information, each suited to different investigation tasks:
Discovered processes: Use DDSQL to investigate service identity, programming language, vendor software, integrations, APM tracer detection, and process placement across hosts, containers, and Kubernetes resources. Discovery provides hourly snapshots and does not require Live Processes to be enabled.
Live Processes: Use
search_datadog_live_processesto investigate observed processes, command lines, ownership, start times, and evidence of restarts.Process metrics: Query per-process CPU usage through
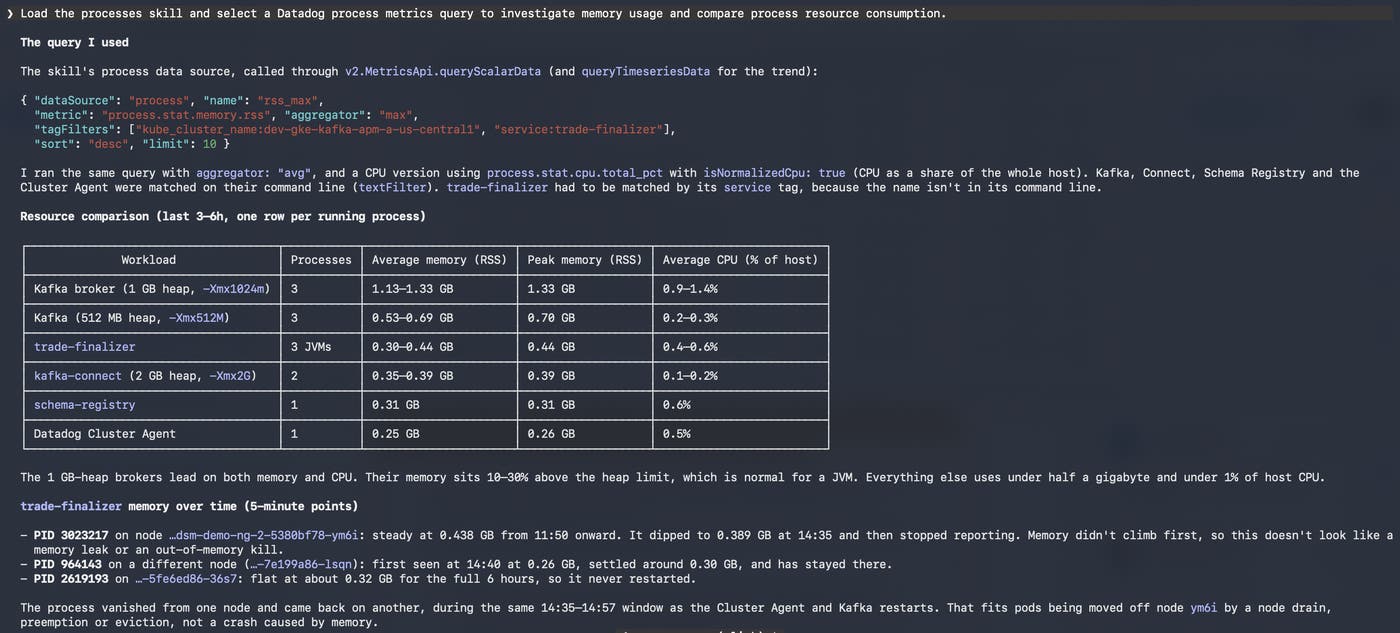
process.stat.cpu.total_pctand resident memory usage throughprocess.stat.memory.rss. Agents can analyze rankings or timeseries covering up to 36 hours by using code execution with the Datadog TypeScript SDK.
The skill helps agents route questions to the source most likely to answer them. For example, asking where Redis is running across a fleet is a discovery question. Asking whether a specific Redis process restarted requires Live Processes observations. Investigating whether a process’s memory usage has increased over the last hour calls for process metrics.
The processes skill can guide an agent through questions that combine service identity with infrastructure context. For example, an engineer investigating instrumentation coverage could ask, “Which services in the payments namespace don’t have APM?” The agent can use discovered process data to identify application processes in the specified namespace and inspect whether Datadog detected an APM tracer. For resource investigations, an engineer could instead ask, “Which process is using the most memory on web-prod-01 over the last hour?” The skill directs the agent toward process memory metrics, enabling it to compare processes over the requested time window.
The processes skill also provides guidance for situations in which an agent might draw the wrong conclusion from an incomplete response. For example, an empty process discovery result does not necessarily mean that the process is absent, but simply that coverage is missing for the relevant environment. The skill also explains how to handle truncated Live Processes search results, instructing the agent to narrow its filters and retry the same page before following the pagination cursor.
When Live Processes is not enabled, the skill provides setup guidance for supported environments, including the Datadog Agent, Docker, Helm, the Datadog Operator, and Amazon ECS Fargate. The guidance also accounts for plan and billing requirements. Any remote configuration change through Fleet Automation requires explicit user approval.
By teaching agents how to select data sources and handle incomplete observations, the processes skill helps them produce answers grounded in the available evidence.
Get started with Kubernetes investigations through the Datadog MCP Server
The Datadog MCP Server makes Kubernetes control plane metrics and process data available to AI assistants through read-only investigation tools. Combined with the processes skill, these capabilities help SREs and platform engineers investigate cluster health, process restarts, resource usage, and instrumentation coverage by using natural-language questions.
To get started, connect your AI assistant to the Datadog MCP Server. Supported clients include Claude Code, Cursor, Codex, GitHub Copilot, and VS Code.
Enable the relevant MCP toolsets for your investigation:
Processes: Enable the
processestoolset to access Live Processes search. The processes skill is available when either theprocessesorddsqltoolset is enabled.Kubernetes control plane: Enable the
kubernetes-ops-centertoolset to query API server, scheduler, controller manager, and etcd health metrics.
Live Processes must be enabled to use the search tool and process metrics. For control plane investigations, Datadog must already be collecting the relevant metrics from the cluster. Available metrics can vary by Kubernetes distribution and managed service.
The processes tools require Hosts Read permission. Control plane tools require Timeseries Query, Metrics Read, and Hosts Read permissions.
For more information, explore the Datadog MCP Server’s Kubernetes tool documentation. If you don’t have a Datadog account, sign up for a 14-day free trial to start investigating your containerized infrastructure and more with Datadog.
