
Tim Nichols
Product Manager

Aurèle Oulès
Software Engineer

Eddie Cai
Technical Content Writer
When a model endpoint returns errors or responses slow down, infrastructure engineers need to trace the root cause across distributed serving resources. Are worker pods ready? Can the cluster schedule the additional capacity the workload requests? Inference frameworks distribute this work across Kubernetes resources, leaving engineers to piece together model configuration, pod state, and scheduling events through separate commands and dashboards.
Datadog’s Kubernetes inference workload, now available in Preview, connects the orchestration configuration declared in custom resources with the resources they manage across the cluster. In Kubernetes Explorer, engineers can compare that configuration with observed pod state and available runtime metrics. Model, component, and pod context helps them identify affected pods, investigate readiness gaps, and understand how scheduling and scaling decisions affect serving capacity. It supports vLLM-backed workloads using KubeRay, NVIDIA Dynamo, and KServe.
In this post, we’ll show you how to:
Bring inference resources into one workload view
According to CNCF’s 2025 survey, 66% of organizations hosting generative AI models reported using Kubernetes for some or all of their inference workloads.
In Datadog, an inference workload is a virtual resource that groups the Kubernetes resources supporting a serving model. In Kubernetes Explorer, model, framework, and cluster context help you identify the workload to investigate. From its workload view, examine related resources such as pods, deployments, replica sets, and the custom resources that control them. The available details depend on the framework and its configuration.
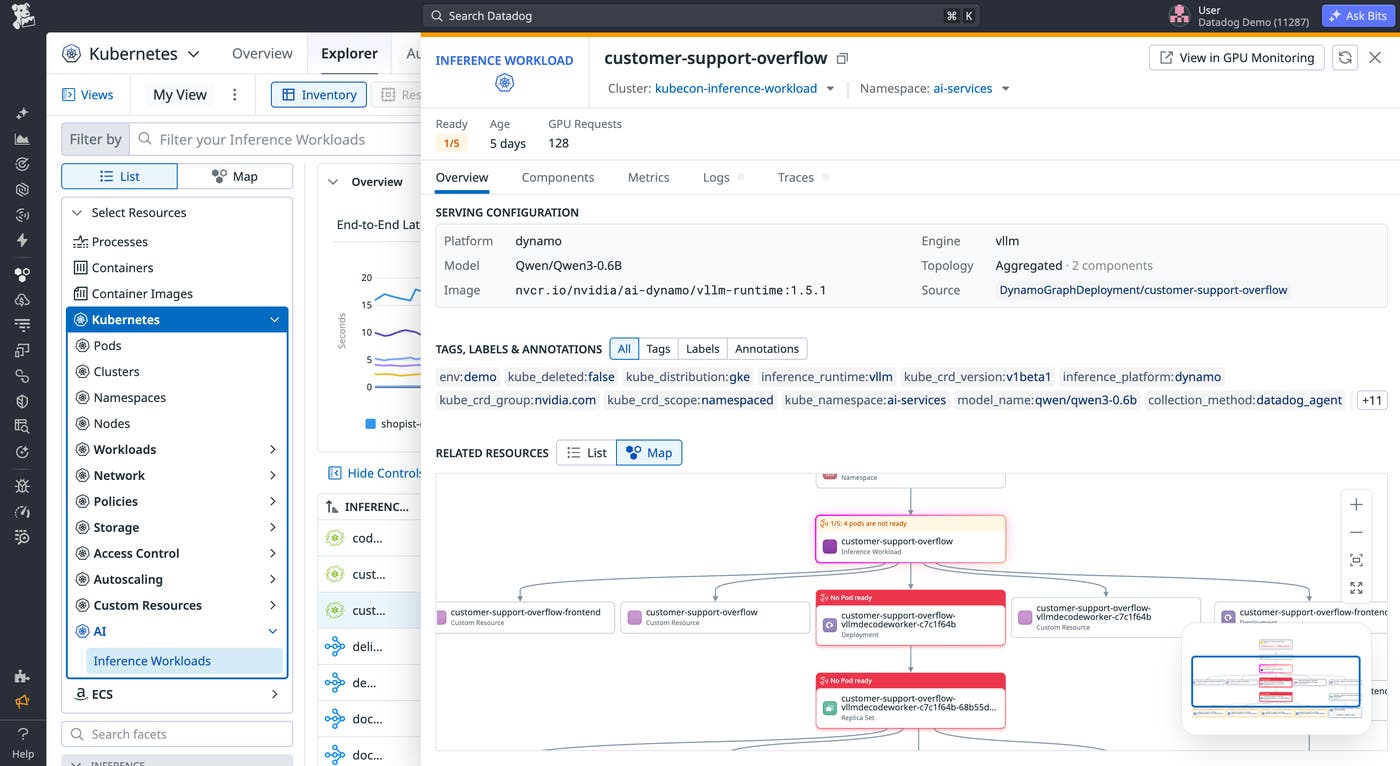
Datadog already lets you inspect custom resources in Kubernetes Explorer. Inference workload monitoring brings the custom resource, its underlying Kubernetes objects, and the inference engine—such as vLLM running inside the serving containers—into one workload view.
Correlate telemetry across workload components
Datadog automatically detects pods running supported inference frameworks and assigns inference_workload and inference_workload_component tags. Metrics, traces, and logs inherit these tags when they can be linked to those pods. You can use the tags to correlate telemetry for a workload or component across Datadog products.
Inference workloads are also exposed through Datadog’s Kubernetes MCP tools. Through an MCP-compatible assistant, you can discover inference workloads and identify their model and framework. Use the Kubernetes resource tools to inspect underlying resource details, parent relationships, and manifests as you investigate pod state and configuration.
Investigate inference readiness and resource usage
A running pod alone does not establish that the serving system is healthy. Routing, cache state, and the relationship between serving components can also affect performance.
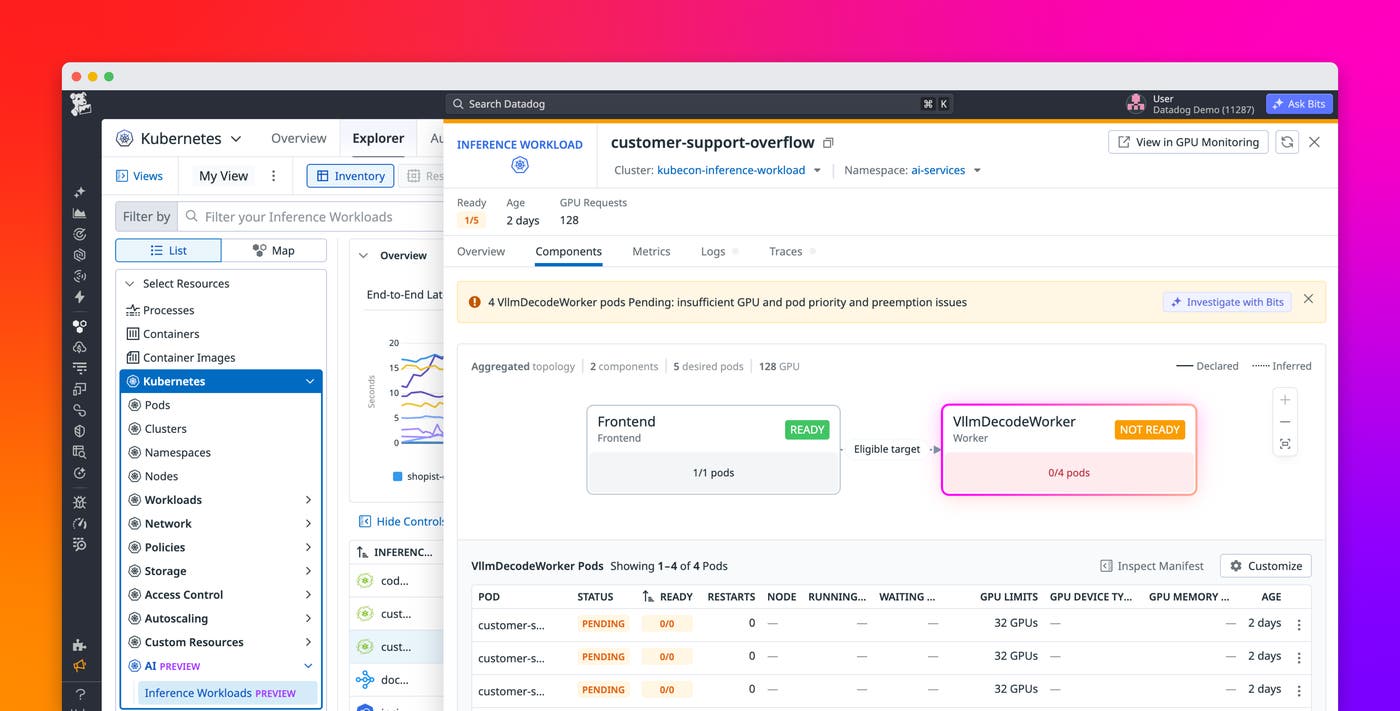
Use the Components tab to inspect pod health within the framework’s serving structure, such as Ray head and worker components or Dynamo frontend and worker components. The topology shows each component’s readiness and pod counts, with the selected component’s pods listed below. Inspect pod status, restarts, node placement, and scheduling details to distinguish pods waiting for resources from running pods that are unhealthy.
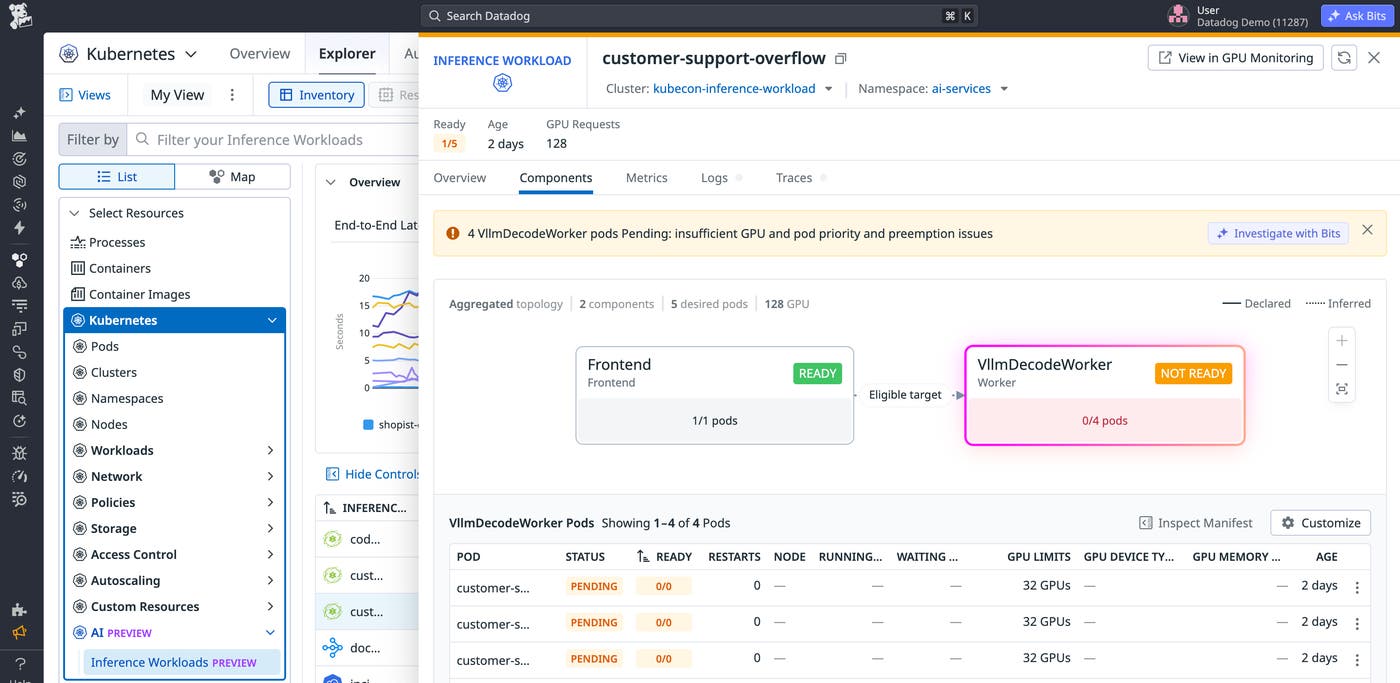
Use the Metrics tab to examine runtime performance and resource usage. For Dynamo workloads with paid GPU Monitoring access and the relevant collection configured, available metrics include GPU memory, activity, and occupancy, plus container CPU and memory usage. Compare these signals across running pods to identify resource pressure, then select View in GPU Monitoring to investigate device health. Together, pod state and GPU telemetry help you determine whether to focus on orchestration, capacity, or hardware.
Investigate GPU capacity constraints
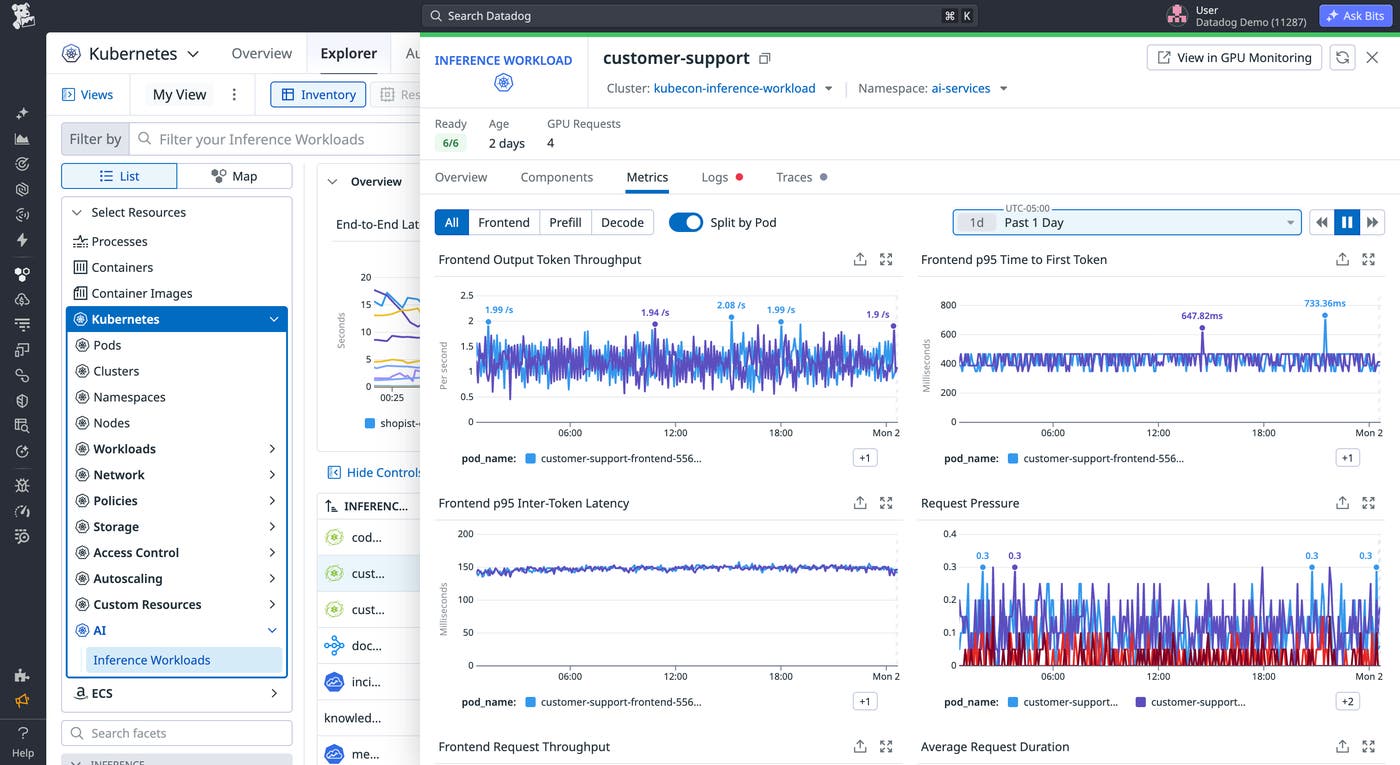
The custom resource defines how the inference workload should run; resource status and pod readiness show whether that configuration is taking effect. Consider a critical Dynamo model with separate prefill and decode components. After noticing an outlier in the main table or receiving a model alert, you open the workload’s Components tab and find a decode worker pod stuck in Pending. Its scheduling details report insufficient capacity for the required GPU type, explaining why the requested serving capacity has not become available.
Find capacity to reclaim
To find capacity you could reclaim, filter the Inference Workloads page by that GPU type and examine other workloads using it. In this example, a lower-priority Dynamo model consumes capacity that the critical workload needs. Review the model demand and resource configuration to assess whether scaling it down is appropriate. For customers with GPU Monitoring enabled, follow the “View in GPU Monitoring” link to examine usage and device health alongside the scheduling evidence.
Investigate with Bits
Investigate with Bits uses Kubernetes MCP tools to gather workload context about the pending pods and recommend next steps. In this scenario, reducing the lower-priority model’s replicas could release GPU capacity for the critical model’s decode worker, provided the released resources satisfy its scheduling requirements.
Start investigating Kubernetes inference with Datadog
Datadog’s Kubernetes inference workload connects orchestration configuration with serving readiness, helping teams move from a model-level symptom to the pods and capacity constraints behind it. Use that context to investigate placement failures, identify opportunities to reallocate GPUs, and evaluate changes to the workloads involved.
Learn more about Datadog Container Monitoring and GPU Monitoring. If you’re new to Datadog, sign up for a free 14-day trial.
