

Angelina Jin

Bo Huang

David Pointeau

Kyler Kang
Associate Product Manager
From point-of-sale terminals to cloud-based applications and mobile devices, reliable connectivity is critical to business operations. Even brief disruptions can negatively impact user experiences, resulting in failed transactions, delayed application responses, or repeated attempts to reconnect.
HPE Juniper Networking is an AI-powered networking platform that provides insights into wireless environments, including access point performance and radio frequency health. Mist’s Marvis AI grades wireless, wired, and WAN service quality through service level expectation (SLE) scores so teams can measure the user experience across every network segment. As Mist-managed infrastructure becomes central to business operations, teams need visibility into device health, client experience, and traffic patterns to diagnose connectivity issues before they reach users.
The Datadog Juniper Mist integration collects device, client, port, and traffic metrics through the Juniper Mist API, enabling teams to correlate user experience with application and infrastructure data to identify which sites, devices, or ports are contributing to connectivity issues.
In this post, we’ll cover how the Juniper Mist integration helps engineering teams:
Monitor device and client health across sites
The Juniper Mist integration surfaces high-level device and client health metrics in Datadog so teams can quickly assess overall network status. The out-of-the-box dashboard tracks totals for access points, switches, gateways, connected devices, and active wireless clients, alongside device health percentages and port utilization. A paired online and offline overview shows when devices drop off the network, and an embedded Monitors panel surfaces active alerts.
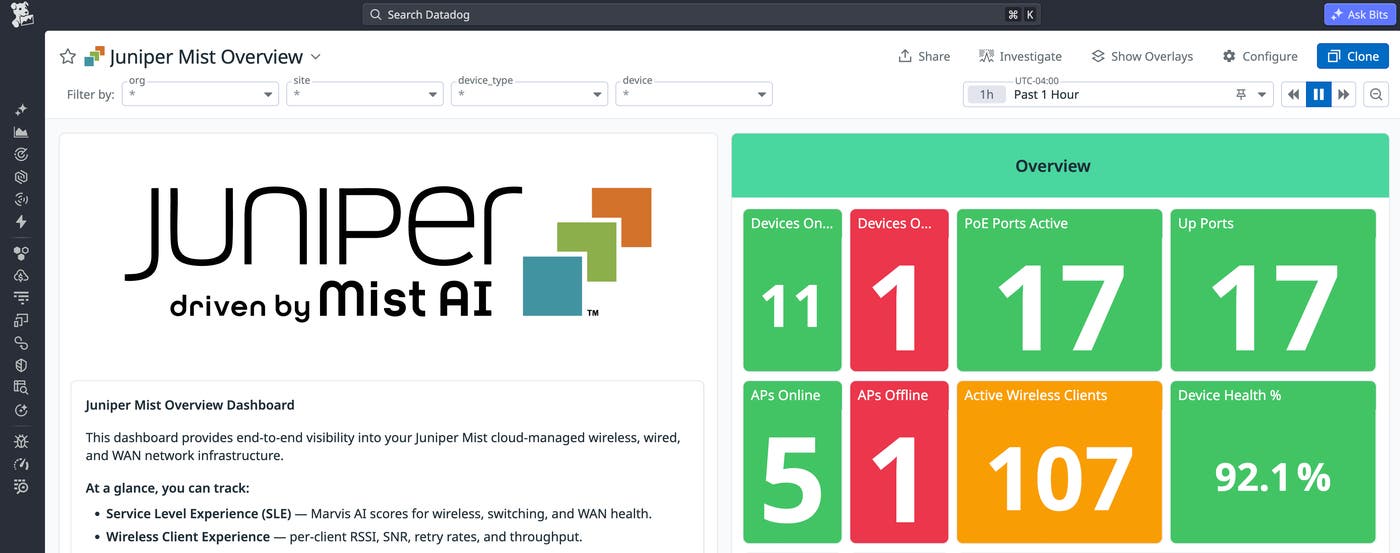
These metrics can be broken down by site to understand how connectivity varies across locations. For example, if one site shows a drop in active devices or a significantly lower device uptime compared to others, this may indicate a local uplink issue, power instability, or WAN connectivity disruption. Related infrastructure metrics, logs, or alerts can help narrow the scope of the issue, isolate impacted locations, and prioritize remediation.
Track service quality and client experience
Healthy devices don’t guarantee a good experience. Marvis AI grades wireless, wired, and WAN quality using SLE scores from 0 to 1 (one score per classifier, per site). Each classifier isolates a specific failure domain. For example, coverage flags clients with weak signals, capacity identifies congested radios, and time-to-connect surfaces association or authentication delays that drive reconnect complaints.
Datadog’s Juniper Mist integration tracks coverage, capacity, roaming, time-to-connect, throughput, access point health, switch bandwidth, switch throughput, gateway health, and WAN link health. When a site’s score drops, teams can identify the affected classifier before users start filing tickets.
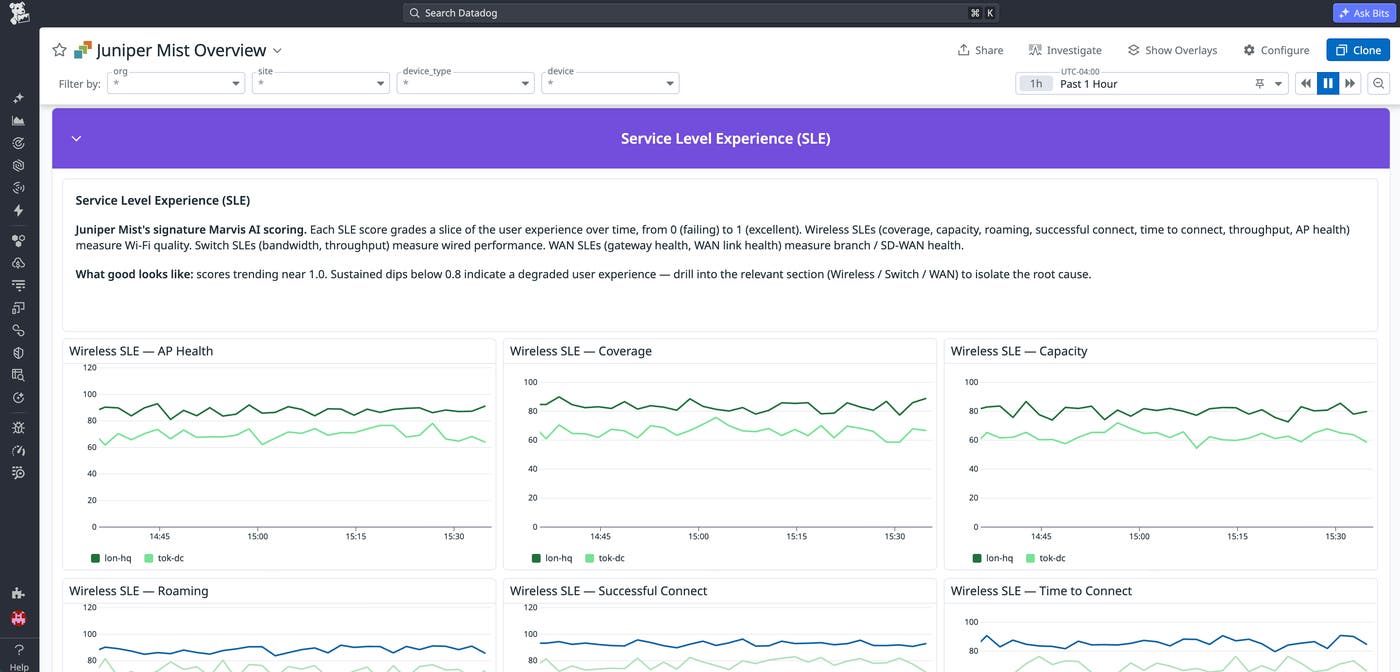
When customers report slow Wi-Fi, signal strength, noise levels, and retry rates for each access point can help teams identify the root cause. A ranked view of access points and network names across a site means teams can prioritize where to act without digging through individual device dashboards.
Analyze port, PoE, and WAN performance
Not all network issues originate at the device level. Sometimes the root cause lies in a specific switch port, a saturated uplink, or unexpected PoE consumption. For example, a sudden spike in PoE draw could indicate newly connected devices exceeding the planned capacity.
The Juniper Mist integration collects detailed port and PoE telemetry, including port status distribution, active uplink ports, and PoE power usage by switch and port. By analyzing the top ports by PoE draw or total errors, teams can detect overloaded or misbehaving endpoints.
Mist-managed switches and gateways handle significant traffic, and shifts in throughput can expose performance bottlenecks or unexpected usage patterns. The Datadog Juniper Mist integration provides metrics for total network throughput, total bytes transferred, and traffic trends by switch. Teams can also identify top switches and ports by total traffic, as well as the top ports by total errors. This enables engineers to distinguish between normal growth in usage and abnormal patterns such as broadcast storms, misconfigured devices, or sudden workload migrations.
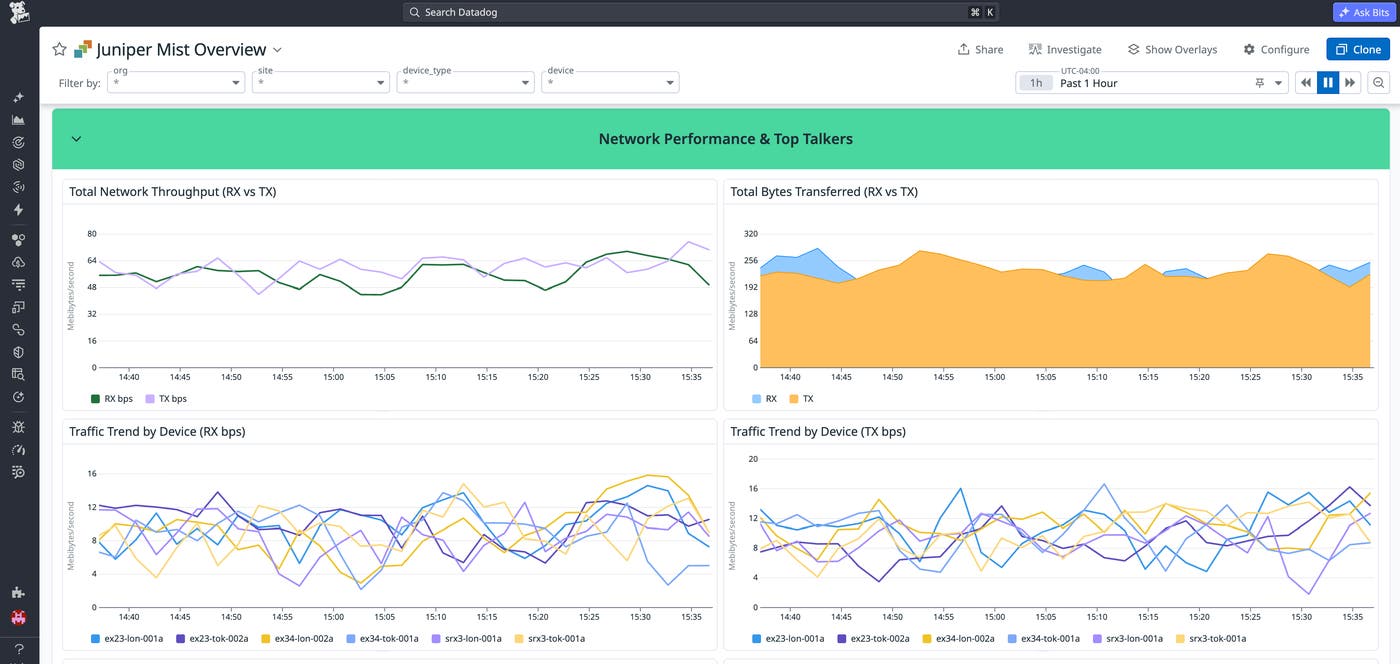
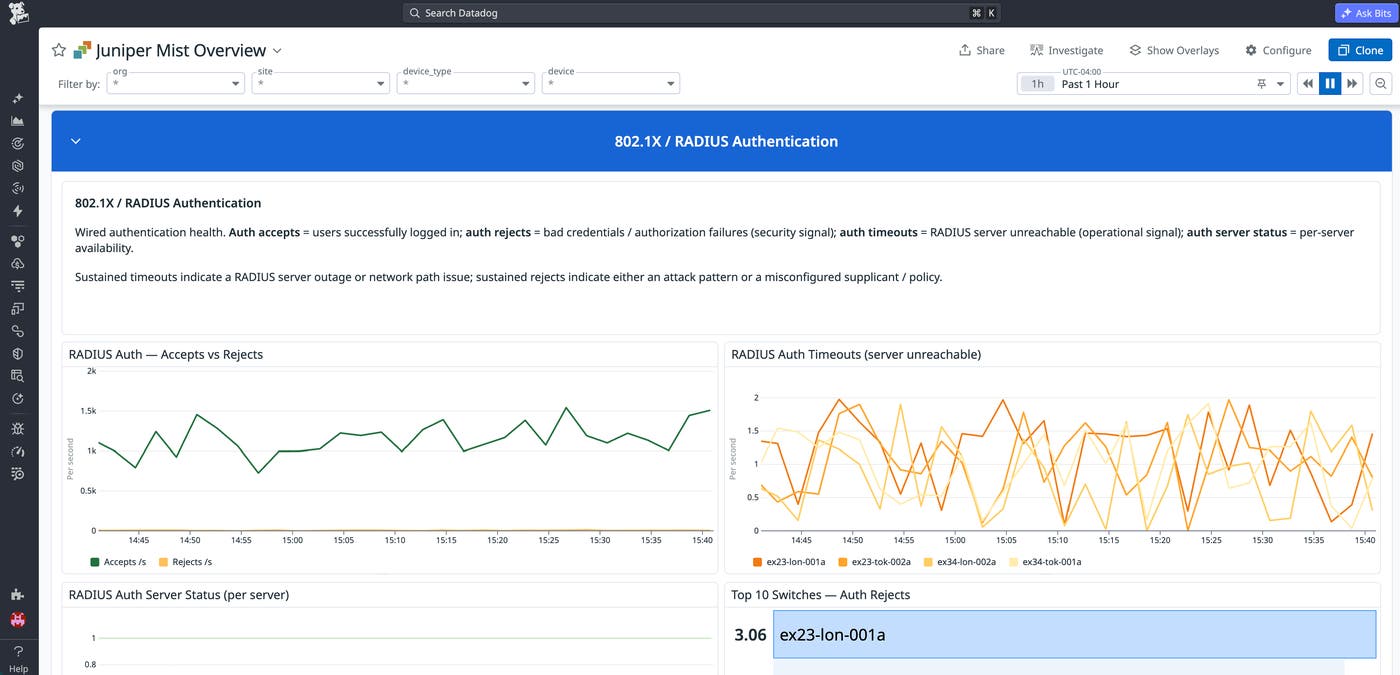
Inbound and outbound traffic rates and error counts on gateway ports extend this visibility to the WAN edge. Teams can correlate gateway port errors with WAN link SLE scores to determine whether a degraded experience originates inside the network or at the service-provider boundary. For environments using certificate-based authentication, RADIUS accept, reject, and timeout counts alongside server status help catch an authentication outage or misconfigured policy that would otherwise appear as customers silently failing to connect.
With these metrics, teams can answer questions such as:
Are uplinks and gateway WAN ports operating as expected?
Is a switch drawing unusually high PoE power?
Are errors concentrated on certain ports, devices, or sites?
Are RADIUS authentication failures or timeouts spiking on a switch or server?
Get started with the Juniper Mist integration
The Datadog Juniper Mist integration connects device health, client experience, port performance, and traffic metrics with application, infrastructure, and log data. By correlating network telemetry with application metrics, teams can narrow down the root cause of connectivity issues and understand how network behavior impacts user experience.
To start monitoring your environments with the Juniper Mist integration, install the integration in Datadog.
If you’re new to Datadog, sign up for a free 14-day trial.
