

Hugo Henley
Engineering Manager

Natasha Silva
Technical Content Writer
Datadog runs around 6,000 internal services and adds an average of one new data center per quarter. For most of that growth, we treated services uniformly when making deployment and reliability decisions. At our current scale, that approach became expensive. A change destined for production rolls out to data centers sequentially, so deployment time grows with every data center we add. Applying a single strict service level objective (SLO) target across all services can lead to over-investing in some while under-protecting others. It can also lead to reliability work getting spread evenly instead of being concentrated where a failure would hurt customers most.
In this context, we needed to answer a hard question: Which services are actually critical? Knowing that would help us decide how fast to deploy a given service, where to keep SLOs strict, and where to concentrate reliability work. But there was no obvious way to agree on a definition of critical that teams could consistently use. Without an agreement on how to classify them, we looked at where the evidence already existed: our own incident history.
To be clear, this is about customer-facing reliability criticality, meaning how much it affects customers when a service is unavailable, slow, or returns incorrect results. Security, compliance, and data criticality are important dimensions, but were outside of the scope of our initial question.
In this post we will share how we used postmortems to develop our first criticality signal, why we built a system that combines signals, and how we use it in production.
Turning years of postmortems into a criticality signal
Datadog has a strong postmortem culture. Over the years, we have accumulated thousands of postmortems written by engineers, mostly as free text. This archive is one of our richest records of what has degraded the customer experience, but we had never structured it in a way that could answer questions about service criticality.
The idea of distinguishing critical services had come up before, but without a practical way to analyze unstructured text at scale, it stalled. Recent advances in LLM capabilities made it worth revisiting.
Instead of debating whether postmortem data could tell us which services mattered, we ran a quick proof of concept. A large language model (LLM) read several hundred SEV-1 and SEV-2 postmortems, the highest-severity subset of the archive, and extracted which services caused an incident and which were affected by one. The entire run finished in under a day and cost approximately $32.
We validated the extracted names against Software Catalog to confirm that they mapped to real services rather than model hallucinations. A second model then reviewed the first model’s service-name extractions for accuracy before we trusted the results.
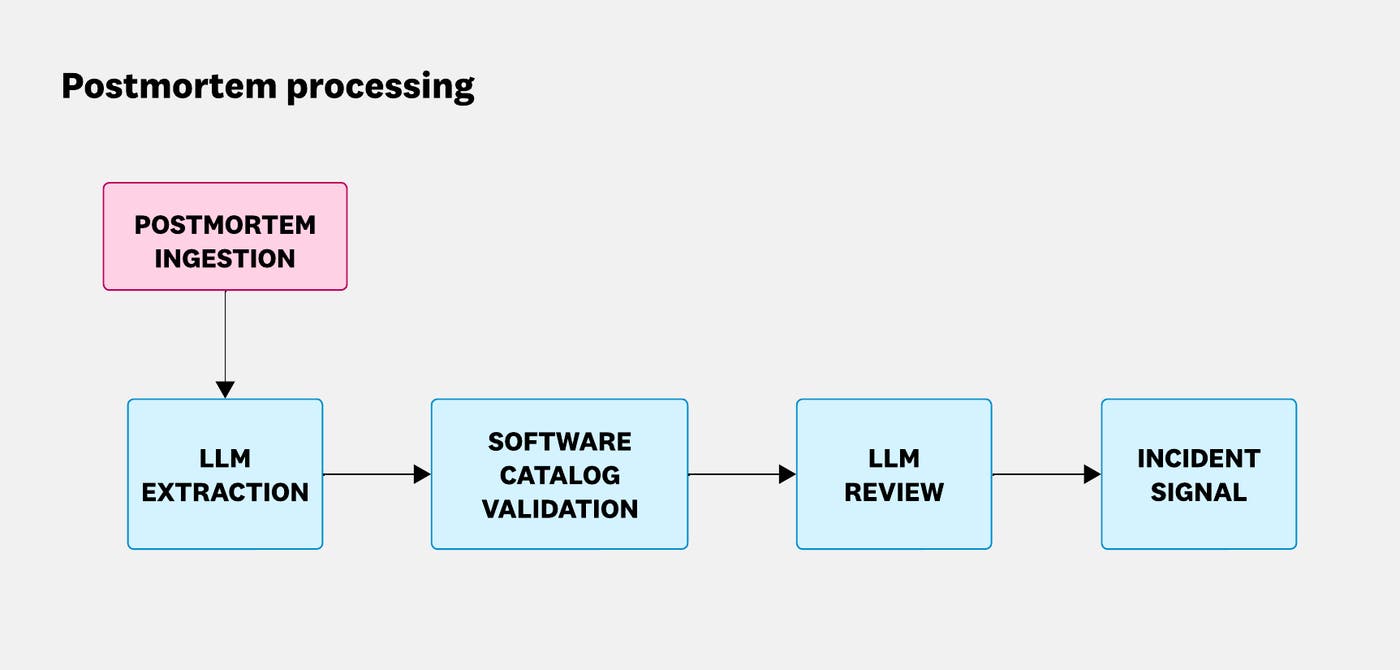
This turned out to be a strong signal. If a service is involved in a SEV-1 or SEV-2 incident, it likely has a track record of affecting the customer experience, about as direct a criticality indicator as there is. Because the postmortems already existed, we could extract that signal cheaply and at scale.
But incident history also has gaps. A highly reliable service that has never caused an incident is invisible to this signal, yet it can still be critical even if it has never failed. It can also appear in several high-severity incidents without ever being the component that took the product down. One service in our data appeared in around 10 SEV-2 incidents without causing a single full outage. That gap is why postmortems became one signal among several, rather than the entire criticality system.
Why one signal isn’t enough
Criticality is ambiguous and depends on perspective. A low-traffic service can sit on a critical user journey, while a high-traffic service may degrade gracefully without causing a major disruption. Any individual team has only a partial view, and any single signal captures part of the picture while remaining blind somewhere else.
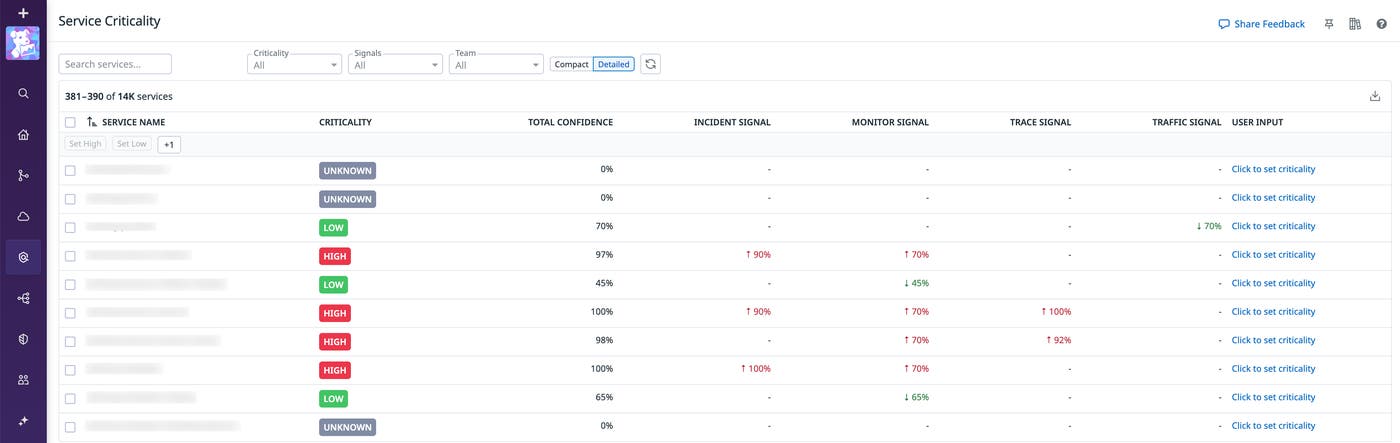
A service criticality system therefore needs to combine multiple signals and account for the limitations of each. At Datadog, some signals can raise a service’s criticality, while one can only lower it:
Incidents: The postmortem signal described above. It raises criticality for services that were identified as the root cause of, or directly involved in, past SEV-1 or SEV-2 incidents.
Traces: Derived from Datadog Application Performance Monitoring (APM) and Real User Monitoring (RUM) error traces, the trace signal identifies services that sit on error paths and connects entry points to critical user journeys. This helps surface services that are implicated in error traffic, including those that have never produced a logged incident.
Traffic: Measures production traffic volume across Software Catalog and flags services with near-zero traffic as low criticality. Services with meaningful traffic produce no signal and leave the decision to the other inputs. High traffic alone does not prove criticality, so this signal can only lower criticality, not raise it.
Monitors: Analyzes monitors tagged to a service and identifies whether any notify an on-call rotation through Datadog On-Call. A paging monitor raises criticality. If a service has tagged monitors but none notify an on-call rotation, the signal lowers criticality, with confidence increasing based on the number of monitors. For services without tagged monitors, the signal provides no evidence about criticality.
Additional signals, including dependency mapping, are in development. Each service receives a criticality level and a total confidence score. The current levels are high, low, and unknown, with unknown representing services for which no evidence exists yet. We plan to introduce a medium level as more signals come online.
The confidence score is a heuristic that combines the confidence of each signal. It reflects how much evidence supports the assigned level. The score is primarily a way to evaluate system performance, but consumers can also use it to avoid false positives.
When two independent signals agree, we consider that stronger evidence than either alone. A signal pointing in the opposite direction cannot change the assigned level, but it lowers our confidence in the classification. For example, a service with a history of incidents but almost no production traffic represents a contradiction worth surfacing.
The system is intentionally asymmetric. In the worst case, a false positive means that we treated a service more carefully than necessary. A false negative means we treated a critical service as safe to move quickly. We tune the system to prefer the less expensive error, deliberately tolerating false positives to avoid false negatives, like a customer-facing incident caused by deploying too quickly to a critical API. Additional signals and human overrides will help us reduce those errors over time.
Putting service criticality into production
Once several signals feed into the system, something needs to combine them into a single answer that teams can act on. Previously, teams defined criticality independently, and those definitions naturally drifted apart. Now, every internal team consumes the same classification from a centralized API. Maintaining one definition in one place turns criticality from scattered knowledge into something teams can use to build automation.
Internally, each signal writes its verdict to a shared store keyed by service and signal type. An aggregator then combines those verdicts into the published criticality level and confidence score.
Service owners can override the classification of their service by providing a reason, and the resulting level is reflected in the API. These overrides provide a human correction layer and capture operational knowledge that no automated signal encodes. An override changes the published level, but the underlying signals continue to run and their scores remain visible. This way we can see where the system and the service owner disagree.
How teams use service criticality
Teams are already using these classifications to make several types of decisions. For deployments, the system enables us to deploy non-critical services faster and in tiers across data centers, recovering some of the speed that uniform treatment used to cost.
The Service Criticality system also contributes to pull request auto-merge decisions. An automated system that ships library and dependency updates uses service criticality to determine how quickly a change can be approved and merged. Changes that touch critical services get extra validation or are held back from auto-merge. For example, a routine dependency update on a low-criticality service can merge automatically, while the same update on a service classified as critical is routed to a human first.
Because every classification includes a confidence score, consumers can also decide how much evidence to require before automating an action. A consumer that is comfortable with some risk can act on lower-confidence classifications, while one that wants to avoid false positives can require high confidence before allowing automation to take over.
Apply service criticality to your systems
Knowing which services are critical gives infrastructure teams something concrete to act on. The data isn’t perfect, so we are continuing to add signals that address the gaps in our Service Criticality system, while manual overrides capture what those signals miss in the meantime.
The same approach can work for smaller organizations. A team with fewer services and a handful of postmortems can apply the same multi-signal thinking by combining its incident history, a rough dependency map, and service-owner knowledge instead of relying on a single definition of critical.
The signals behind our system are built on tools you can use right away: Incident Management for postmortems, Software Catalog for service ownership and metadata, and APM and RUM for trace-level signals.
If you’re not already a Datadog customer, sign up for a free 14-day trial.
