

Alex Weisberger
Senior Software Engineer

Nenad Noveljić
Senior Software Engineer

Bowen Chen
Senior Technical Content Writer
A frequently encountered issue when exploring database optimizations is proving that a proposed query rewrite is actually faster than the existing query. Often, proving this isn’t just as simple as running both queries and comparing their execution times. When your hot queries are measured in milliseconds, factors such as cache states, concurrent queries competing for CPU and I/O, and noisy neighbors can mask the true performance difference between query versions.
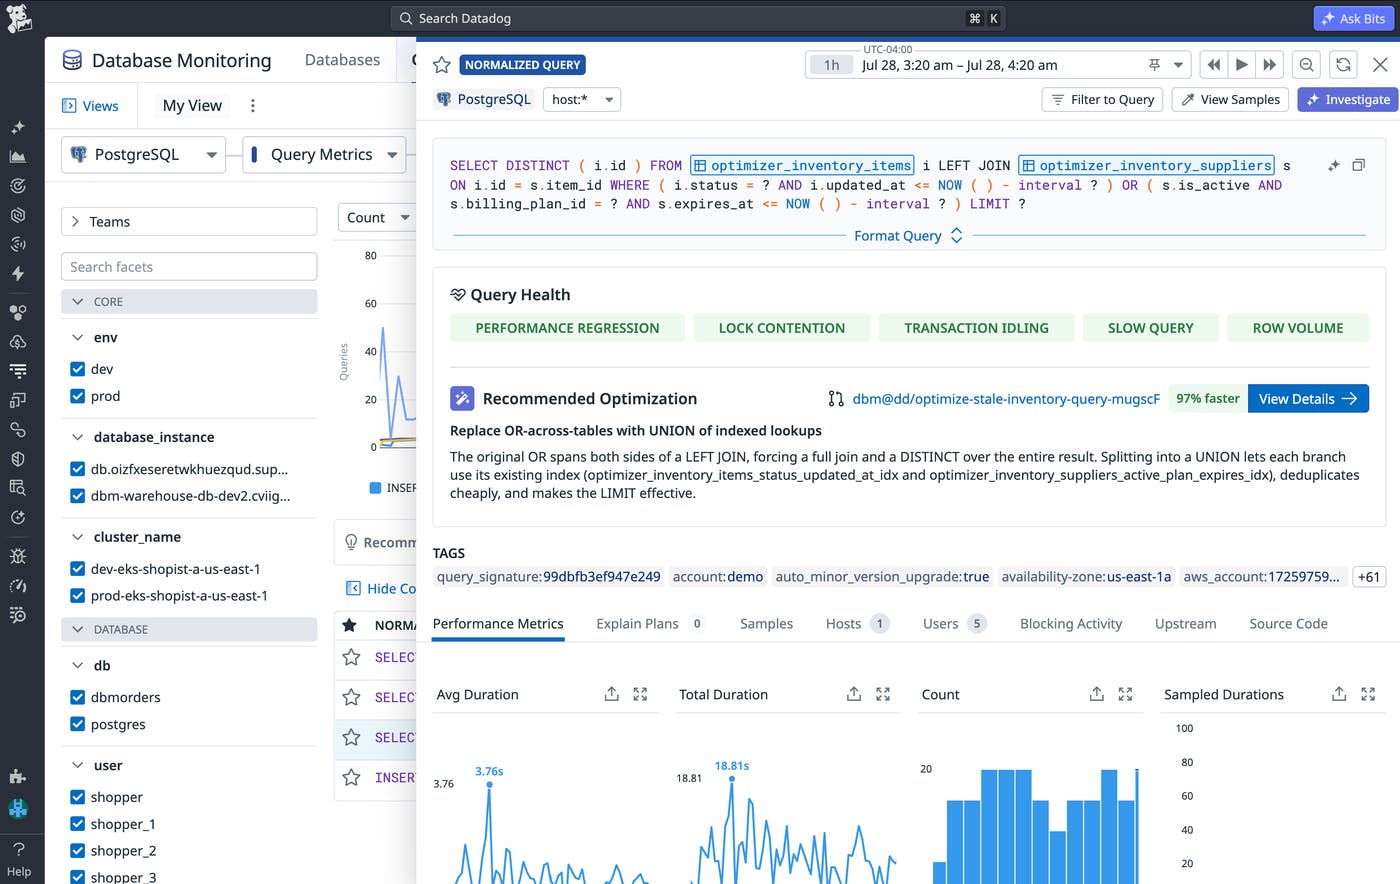
Earlier this year, Datadog announced Bits Database Optimization, a Database Monitoring (DBM) feature that automatically surfaces slow or bottleneck queries and generates a suggested fix. One of the underlying principles behind the feature is to only recommend optimizations that we can prove to be more performant. Several key design choices enable Bits to tackle this challenge of proof using capabilities that distinguish it from other query optimization tools—most notably, its ability to simulate production datasets based on their schema and table and column statistics.
In this blog post, we’ll take a deeper look at how Bits Database Optimization works under the hood and the deciding factors it takes into account when determining whether a query rewrite is actually faster.
Simulating databases using real schemas and synthetic data
Most database optimization tools can surface inefficient query patterns and suggest rewrites based on known best practices. But determining whether a proposed rewrite will actually perform better is harder. Rather than executing the original and rewritten queries under controlled conditions, many tools rely on execution plans, cost estimates, and historical performance to predict the potential improvement. Engineers are then left to decide whether to trust that prediction or benchmark the optimization against production data, where testing can introduce security risks, contend with real workloads, and produce noisy results.
To address this problem, Bits Database Optimization creates a fresh database instance within Datadog’s infrastructure that serves as a controlled environment in which to benchmark the performance of the existing query and the suggested rewrite. The Datadog Agent already collects table and index definitions as part of DBM’s schema collection. Using this information, Bits Database Optimization is able to recreate the schema used by the query so that the tables, indexes, and constraints of the database simulation mirror your production database. It then populates the tables with synthetic data generated to approximate key characteristics of the production dataset, including cardinality and column-level distributions. These characteristics help the database make planning decisions that more closely resemble those it would make against the source data.
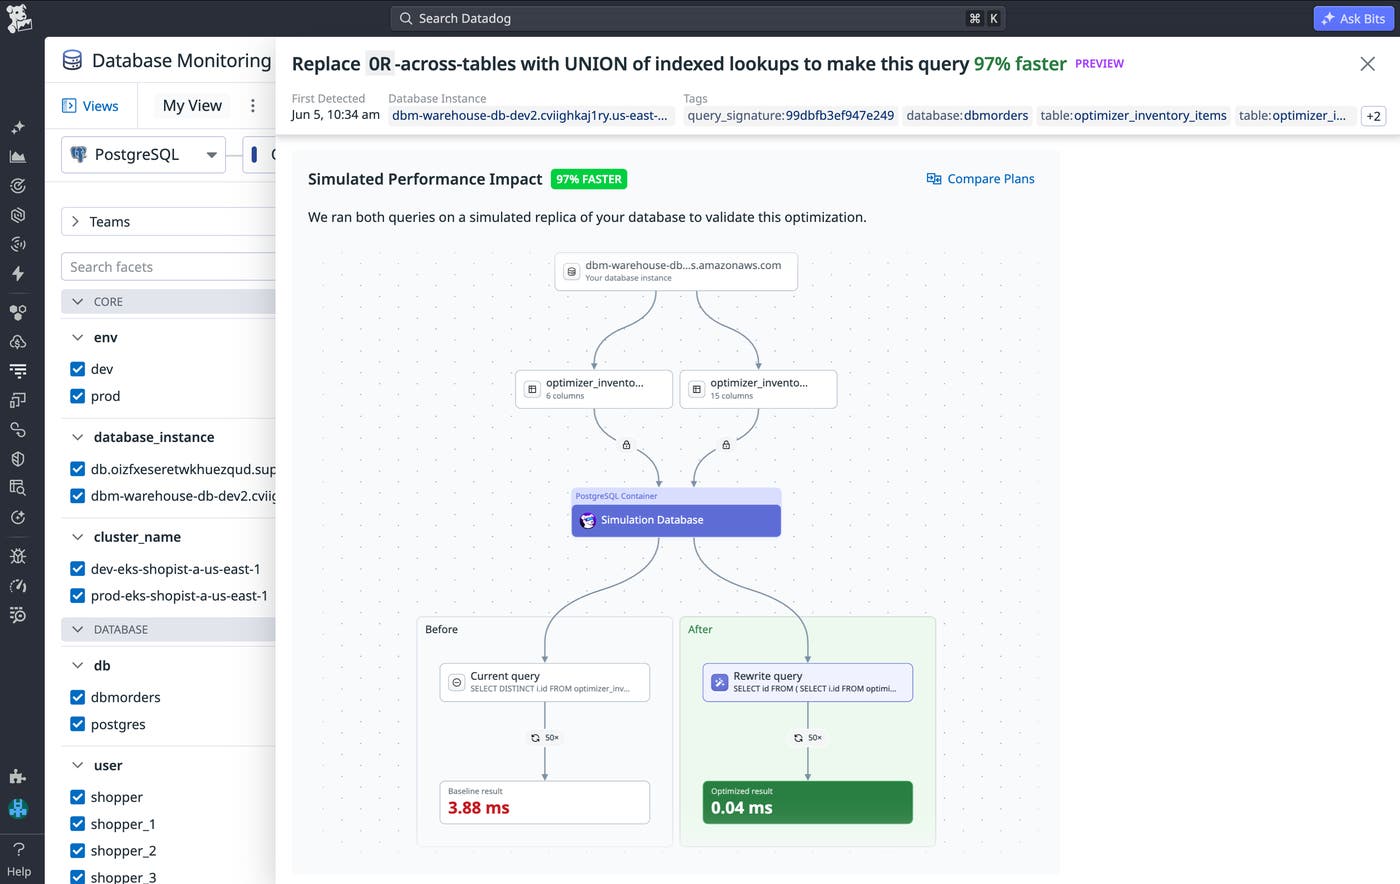
Benchmarking on disposable database instances within Datadog’s environment provides several benefits. It bypasses risk to production data along with the need to manage privileged credentials. It also offers greater control over different variables across your benchmark runs compared to your production environment, where the query being benchmarked may need to wait on database locks, compete for disk I/O or CPU, or be disrupted in other ways due to concurrent production traffic.
Under these controlled conditions, we can keep more variables consistent between benchmark runs. For example, prior to benchmarking the query, we warm up the cache to prevent the first measured run from paying a cold-cache penalty. However, if the query inserts or updates rows, the warm-up itself changes the simulated database state, which could cause a subsequent run to violate a uniqueness constraint or otherwise execute against different data. As a result, the warm-up query is run inside a transaction that we roll back, warming the cache while restoring the database to its pre-warm-up state.
How accurate is the database simulation?
While benchmarking queries against simulated data offers many advantages, the database simulation is only as valuable as its ability to accurately reflect how queries behave against the production dataset. After all, we’re trying to determine whether a proposed optimization performs better in your production environment, not just against any sample dataset.
To do this, we built an evaluation platform that measures how the simulated data and randomly generated control data compare against actual production data across various metrics. Two of the metrics that we use to measure data accuracy are cost fidelity and read fidelity.
Before a database can execute a query, it needs to select an execution plan, which outlines the sequence of operations the database will use to execute the query. The database’s query planner estimates the cost of potential execution plans and uses these estimates to determine which plan to select.
For Bits to accurately simulate the production database, the query planner in the disposable database should make similar decisions to the query planner in production. Cost fidelity—how closely the query planner’s estimated cost for a query on the disposable database matches its estimated cost on the production database—measures one aspect of this. The closer these costs are, the more faithfully the simulated data reproduces the characteristics of the production data that influence the planner’s cost estimates. We express fidelity as the factor by which a metric from the simulated or randomly generated dataset differs from the same metric in production. A value of 1.00x represents an exact match, while larger values indicate greater divergence. Across the query types we evaluated, median differences ranged from 1.00x to 1.05x, while p95 differences ranged from 1.00x to 1.24x.
| Query class | Random (median) | Random (p95) | Bits (median) | Bits (p95) |
|---|---|---|---|---|
| Range scan | 1.26x | 18.70x | 1.01x | 1.10x |
| Equality filter (=) | 7.17x | 36.14x | 1.03x | 1.24x |
| IN-list (IN) | 5.38x | 19.39x | 1.05x | 1.13x |
| Null check (IS NULL) | 1.78x | 104.98x | 1.05x | 1.12x |
| Sort + limit (ORDER BY + LIMIT) | 1.22x | 1.85x | 1.00x | 1.00x |
| OR condition | 1.17x | 28.13x | 1.00x | 1.01x |
| AND condition | 3.53x | 3.69x | 1.02x | 1.02x |
| GROUP BY (200 distinct values) | 1.86x | 1.94x | 1.01x | 1.01x |
| Join fan-out | 4.19x | 4.27x | 1.01x | 1.01x |
While cost fidelity compares the planner’s overall estimate of the work required to execute a query, read fidelity provides a more granular view by measuring the number of data blocks the database actually accesses during execution. Two queries can have similar estimated costs while accessing different numbers of blocks, so read fidelity helps reveal actual performance differences that an aggregate cost comparison may obscure. Our evaluations show strong read fidelity at the median across most query classes, with several benchmarks approaching a 1.00x match with the source database. The results also reveal a longer tail for certain query classes, whose p95 read counts diverged more substantially. Improving read fidelity for these tail cases is an area our engineers are continuing to work on.
| Query class | Random (median) | Random (p95) | Bits (median) | Bits (p95) |
|---|---|---|---|---|
| Range scan | 2.32x | 34.20x | 1.59x | 8.89x |
| Equality filter (=) | 29.33x | 81.00x | 1.33x | 10.37x |
| IN-list (IN) | 14.00x | 81.67x | 1.75x | 5.07x |
| Null check (IS NULL) | 1.60x | 129.50x | 1.04x | 3.25x |
| Sort + limit (ORDER BY + LIMIT) | 9.54x | 87.84x | 1.81x | 4.82x |
| OR condition | 3.68x | 39.82x | 1.15x | 3.24x |
| AND condition | 82.75x | 120.75x | 2.34x | 2.72x |
| GROUP BY (200 distinct values) | 1.24x | 1.54x | 1.00x | 1.00x |
| Join fan-out | 1.31x | 1.73x | 1.00x | 1.00x |
These evaluations help us determine where the synthetic data accurately reproduces the source database’s query behavior—and, just as importantly, where the simulation still has room to improve. For example, our engineers are working on ingesting PostgreSQL extended statistics to improve fidelity for queries with AND conditions across multiple columns. When these columns are correlated, their combined behavior may not be accurately represented by statistics collected for each column independently. By ingesting extended statistics, Bits will be able to more accurately reproduce relationships among multiple columns, improving read fidelity for these queries.
The evaluation results shown in this section were achieved using column-level statistics collected by the Datadog Agent. To achieve the highest data fidelity when using Bits Database Optimization, configure the Agent to collect these statistics from your databases.
How Datadog measures a query improvement
With a representative environment for running the comparison, the next question is what evidence Bits Database Optimization requires before declaring a rewrite an improvement.
Once Bits Database Optimization has benchmarked the existing query and proposed a rewrite using the database simulation, it needs to determine whether the measured improvement is large and consistent enough to trust. Query performance is often evaluated primarily by execution time. While this is still one of the dimensions that Bits takes into consideration, it’s not the only one. To determine whether a query is actually faster, Bits measures the following:
Execution time: The database’s own server-reported time, not the wall-clock time
Logical reads: The number of blocks accessed during query execution, whether served from cache or read from storage
Dirtied blocks: The number of blocks modified during query execution that must eventually be persisted to storage
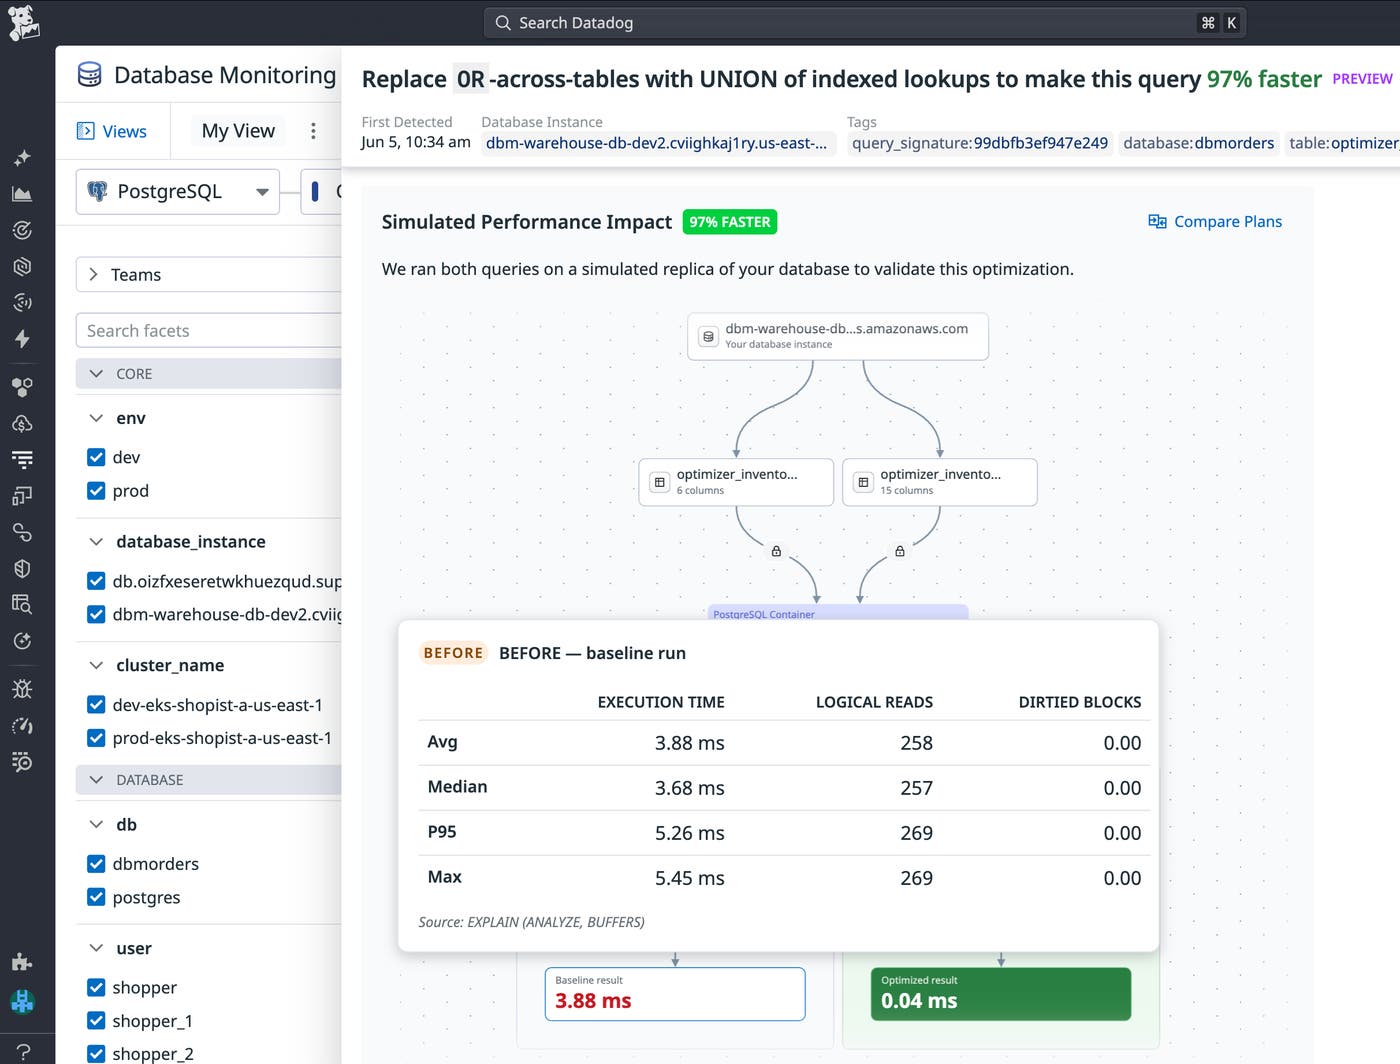
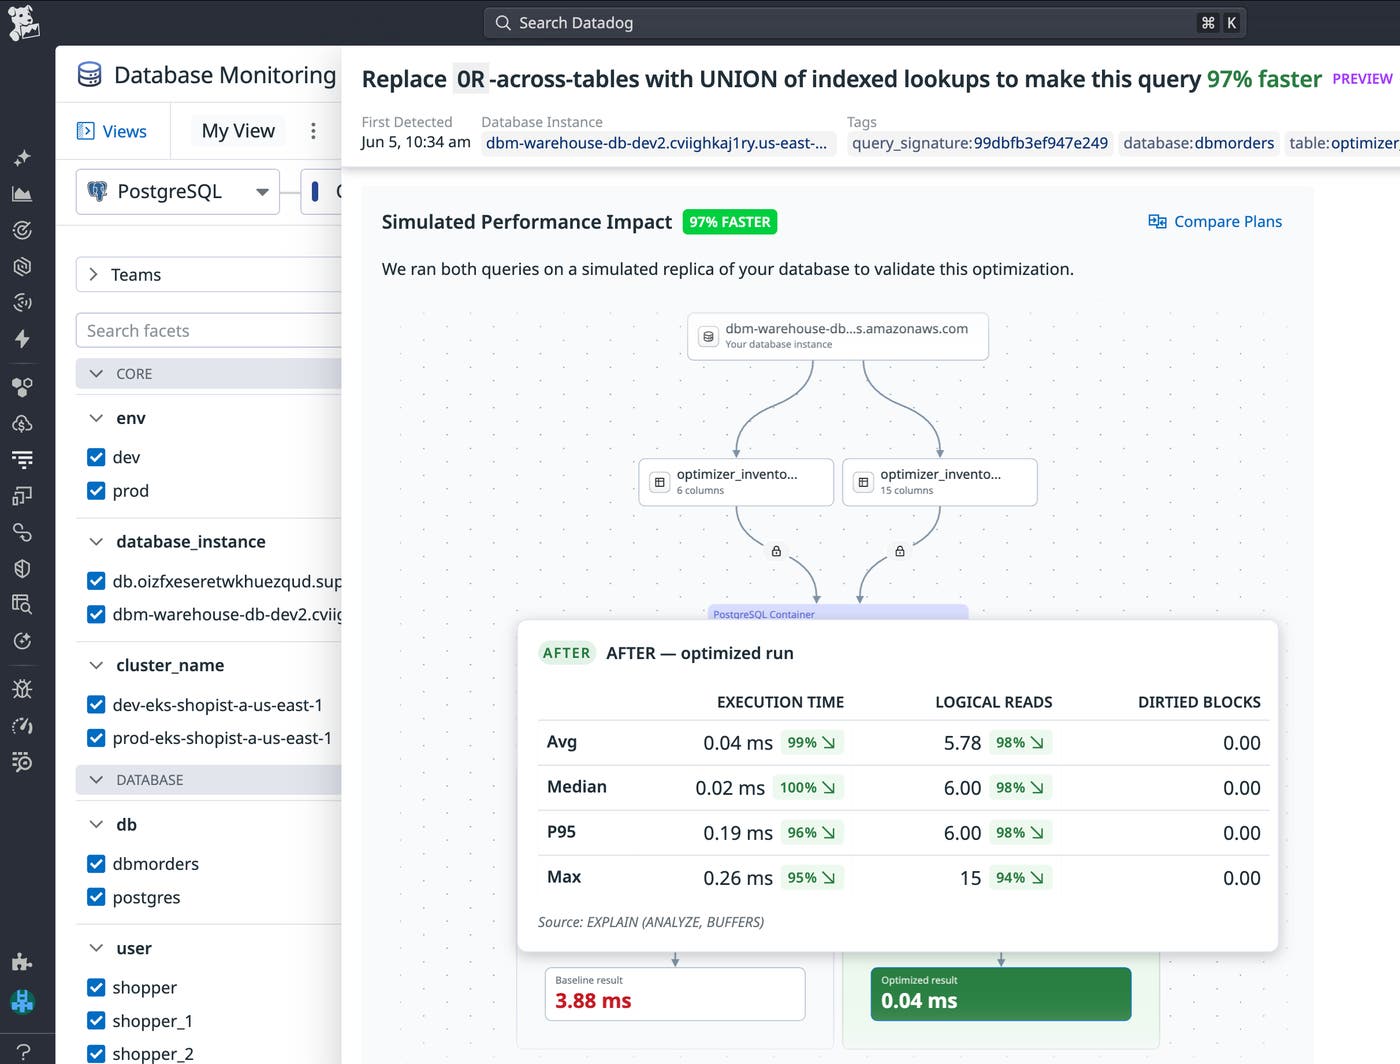
When determining whether a query rewrite actually improves performance, we want to measure not just time but also the amount of database work that the query execution requires. Bits Database Optimization compares all three measurements across repeated executions rather than relying on a single benchmark run. It runs both the baseline query and proposed rewrite 50 times, then evaluates the average, median, p95, and maximum values across those runs.
For each measurement category, Bits looks for an improvement of more than 20% relative to the baseline. The improvement must clear that threshold in at least three of the four summary statistics—average, median, p95, and maximum. The 20% threshold helps prevent normal measurement noise from being mistaken for an optimization, while the three-of-four rule ensures that the improvement is consistent across the benchmark results rather than being driven by a single summary statistic or outlier.
Start optimizing your queries with Datadog
Bits Database Optimization identifies query rewrites and index changes and validates them against a controlled database simulation before surfacing them to users. Recommendations that don’t meet Bits’s performance improvement criteria are withheld, so you can spend less time manually validating optimizations and troubleshooting slow queries.
Bits Database Optimization currently supports Postgres, with future support planned for MySQL, Microsoft SQL Server, and Oracle. You can learn more about the feature’s capabilities in our product announcement blog post or in our documentation. If you’re not already a Datadog customer, sign up with a free 14-day trial to get started.
