

Jaroslav Bachorík
Staff Engineer

Scott Gerring
Senior Technical Advocate
For a long time, Java engineers have had access to a powerful performance diagnostic tool: Java Flight Recorder (JFR). Built into the runtime, JFR gives engineers almost everything they need to diagnose performance issues—from garbage collection to algorithm optimization. But in some cases, it falls short.
As Datadog’s Java profiler matured, we repeatedly ran into CPU-bound investigations where existing Java Virtual Machine (JVM) sampling produced biased or incomplete results, especially in always-on production workloads at scale. In this context, biased means that samples were not collected in proportion to actual CPU time, making some hotspots appear more or less significant than they really were. As a result, the profiler output didn’t clearly explain where CPU time was actually being spent.
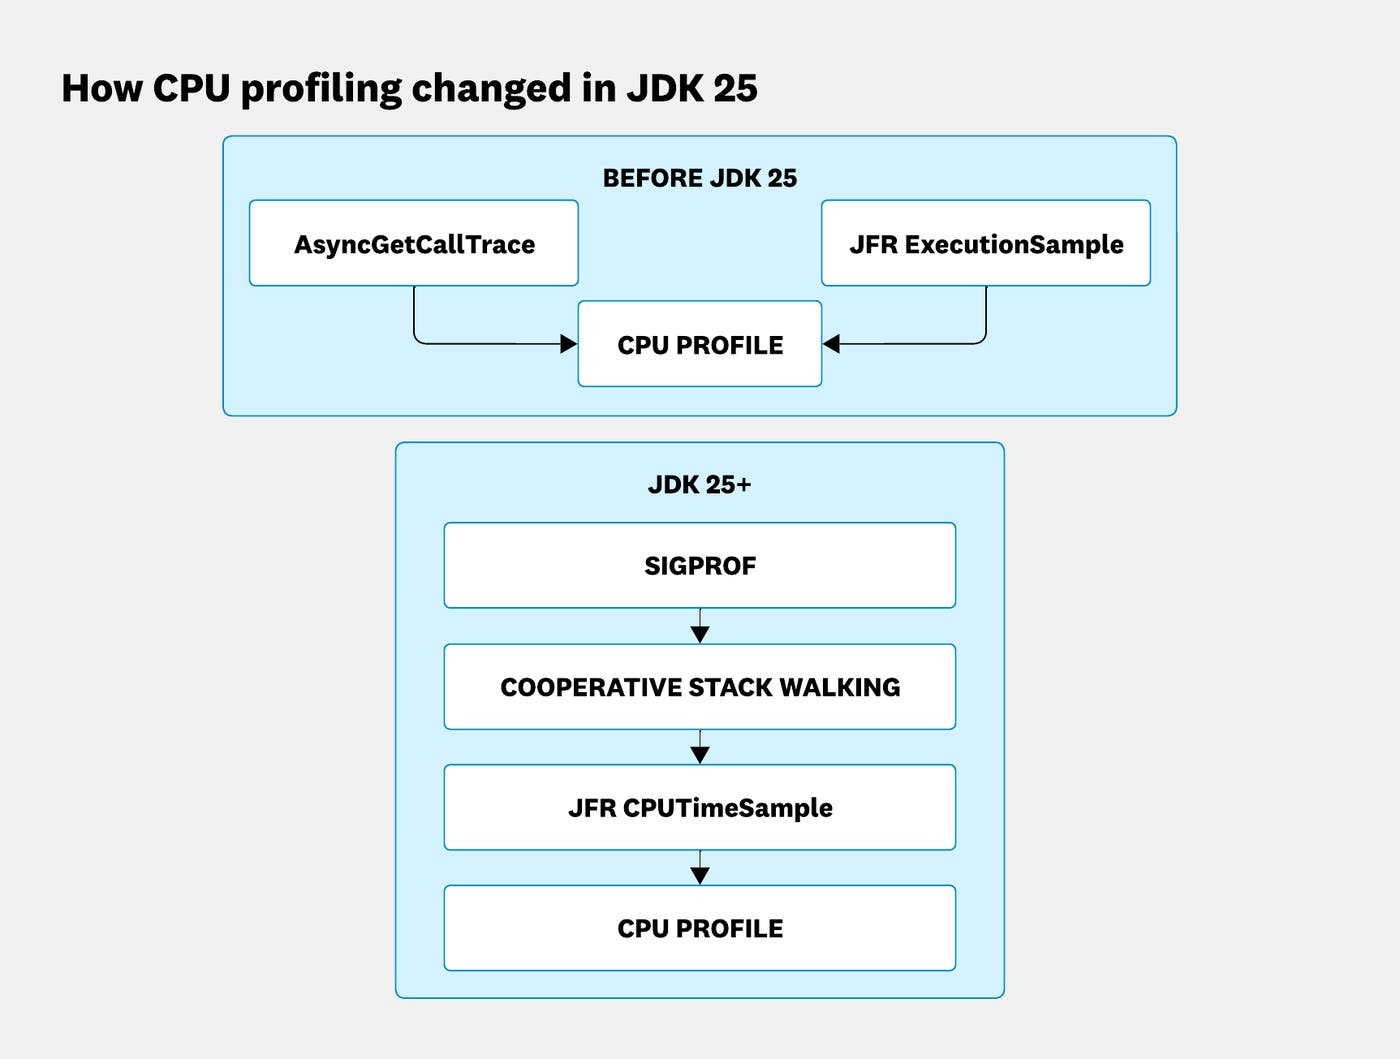
At the center of this is the JFR’s ExecutionSample event, which many profilers rely on. It makes specific decisions about when to capture stacks, which can make CPU-bound hotspots harder to identify. As a result, modern profilers, including ours, combine JFR with agents built on the Java Virtual Machine Tool Interface (JVMTI) and other low-level mechanisms such as AsyncGetCallTrace to produce more accurate results.
In this post, we’ll show how modern Java profilers are built, why existing JVM sampling falls short for CPU-bound workloads, and how we worked with SAP, Amazon, and the OpenJDK community to introduce a new, first-class CPU profiling event.
How profilers work
Performance problems are different from obvious failures. Instead of a clear error, you get a slow leak, or an intermittent spike in latency that is hard to reproduce. Continuous profiling exists to help address these issues by collecting stack traces over time and aggregating them so patterns emerge.
At its core, a modern sampling profiler repeatedly asks: “What is executing right now?” or “What was executing when this event fired?” Over time, this builds a statistical picture of how your application behaves. In practice, profilers differ mainly in when they ask that question.
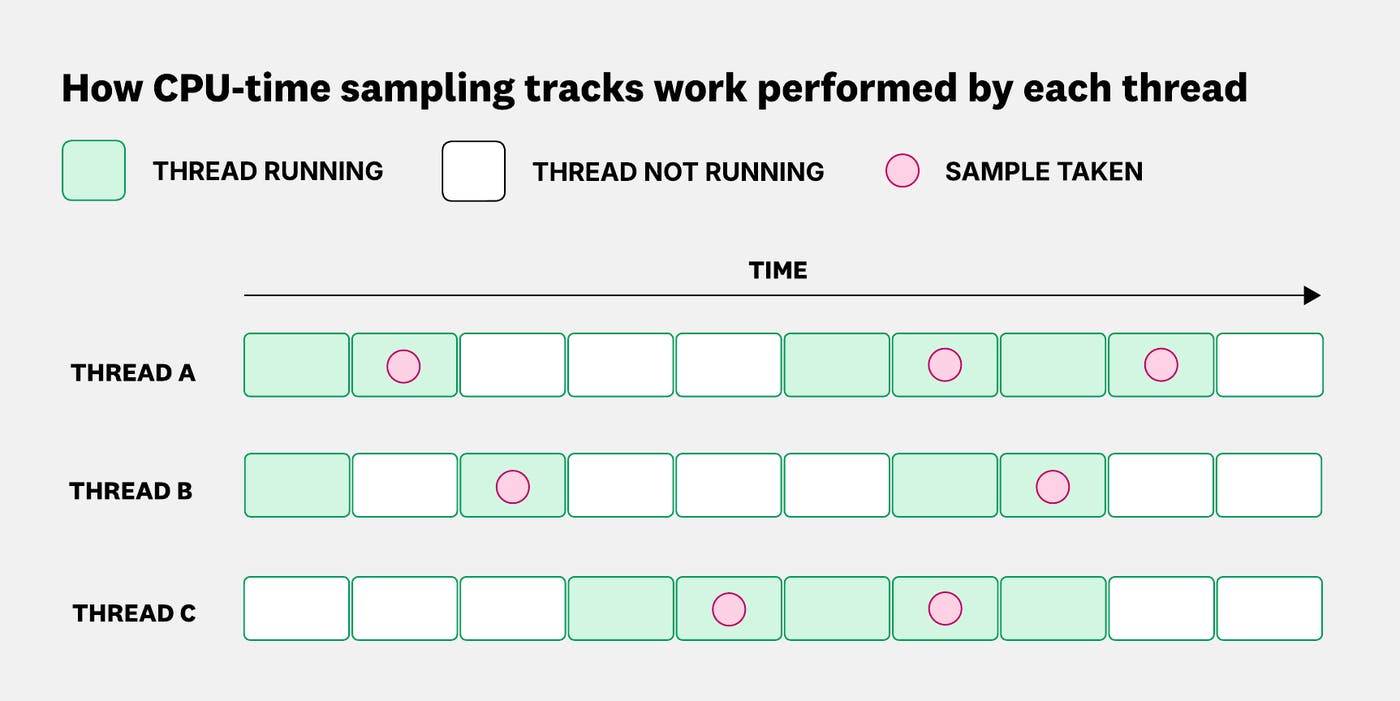
A CPU profiler typically samples on a timer. Every N milliseconds—say, 20 ms—it captures the stack currently running on the CPU. If a method appears frequently, it is likely consuming a meaningful share of CPU time. The milliseconds may be counted in two ways: in CPU time, which accumulates when a thread is actively executing, or in wall-clock time, which advances whether the thread is running, waiting on I/O, or blocked on a lock.
The choice matters. CPU-time sampling finds computation hotspots—the methods burning the most cycles. Wall-clock sampling finds latency sources—the places where time passes whether or not work is happening. A slow database query barely shows up in a CPU-time profile; a tight loop burning a core won’t stand out in a wall-clock profile. Most performance investigations benefit from both.
Other profilers use different triggers. For example, allocation profilers sample when memory is allocated and ask what code path caused that activity.
More generally, profilers are event-driven. Time passing is one event, but so are memory allocation, lock contention, thread parking, and garbage collection. Regardless of trigger, the core mechanism is always the same: capture a stack, associate it with an event, and aggregate the results over time.
What changes—and what matters a great deal on the JVM—is how those stacks are actually obtained.
Profiling on the JVM today
In modern JVMs, profiling increasingly means JFR. It is a low-overhead system built into the JVM and designed for continuous, always-on use. JFR emits structured events from inside the runtime, covering everything from garbage collection and class loading to thread scheduling and allocation.
For CPU profiling, JFR relies on the ExecutionSample event. It looks like a conventional sampling profiler, capturing stacks at regular intervals. However, it samples threads as observed by the JVM, not strictly based on CPU time. In practice, this means JFR samples a small, rotating subset of runnable threads. While CPU-heavy threads tend to appear more often, the sampling is not strictly proportional to actual CPU time. In most cases, this is good enough—but sometimes it isn’t.
At Datadog, we’ve seen CPU-saturated systems where ExecutionSample alone did not clearly identify the underlying hotspot. The profiler wasn’t wrong, but the data was incomplete. One common example involved reactive Java applications, where the ExecutionSample sampling model could underreport thread CPU usage because of the way reactive workloads are scheduled. As a result, accurately diagnosing performance hotspots became much more difficult. In practice, this gap can mean the difference between a quick fix and a long investigation.
Another path: AsyncGetCallTrace
There is another approach: A profiler can attach via JVMTI and use operating system signals such as SIGPROF to sample based on CPU time. When the signal fires, it runs inside the sampled thread and calls HotSpot’s internal AsyncGetCallTrace API to walk the Java stack asynchronously. This avoids safepoint bias and allows stacks to be captured on arbitrary events, not just those defined by JFR.
Tools like the open source async-profiler popularized this approach. By combining operating system–level sampling with AsyncGetCallTrace, they produce profiles that more closely reflect real CPU usage, especially for CPU-bound workloads.
But there is a catch: AsyncGetCallTrace is not a supported public API, but rather an internal HotSpot mechanism (although it is now also supported in other JVMs like OpenJ9 and Zing). It is widely used and effective, but it was not designed as a stable interface. In rare cases, especially under heavy load, it can trigger faults that must be carefully handled to avoid destabilising the JVM. Production profilers must invest significant effort to guard against this, and unfortunately no solution is fully reliable here.
At Datadog, our Java profiler uses this combination. We rely on JFR for low-overhead telemetry data and use AsyncGetCallTrace and another technique—vmstructs walking, pioneered by async-profiler—for accurate CPU sampling. The vmstructs walking technique reads JVM internal metadata structures directly to recover stack and runtime state information that standard APIs do not expose. It works well, but it means depending on JVM internals that are powerful, widely used, and officially unsupported.
In practice, this leaves profiler authors with a tradeoff: Use JFR for safety and stability, or use AsyncGetCallTrace for accuracy. Most modern profilers, including ours, combine both.
Improving the foundation
By this point, it was clear that the tradeoff was not unique to Datadog. Other profilers relied on the same combination of JFR for telemetry data and AsyncGetCallTrace for accurate CPU sampling. The pattern worked, but it meant much of the ecosystem depended on an internal, unsupported HotSpot API to produce accurate results. That was not a healthy long-term foundation.
Conversations between engineers at Datadog, SAP, and Amazon revealed a shared frustration. JFR was already the right place for production-safe, low-overhead profiling. What was missing was a first-class CPU sampling event that could deliver accurate results without relying on unsupported JVM internals.
Datadog engineers had been discussing these limitations in the OpenJDK community for years. We helped articulate why existing JVM sampling was not sufficient for accurate CPU profiling, participated in the design and review of earlier proposals such as AsyncGetStackTrace, and worked with engineers across Oracle, SAP, and Amazon to explore alternative approaches. Those conversations helped build consensus that the problem was worth solving inside the JVM itself.
Instead of continuing to layer workarounds on top of the JVM, we focused on improving the platform itself.
From workarounds to a first-class solution
The first serious attempts to address this began in 2022, following discussions across the JVM profiling community. The initial direction was straightforward: If AsyncGetCallTrace was widely used, why not formalize it?
Early proposals explored several paths, including exposing a supported replacement API, extending JVMTI, or introducing JVMTI extensions for async stack walking. This led to a proposal for a supported replacement API, AsyncGetStackTrace, defined in its own JDK Enhancement Proposal (JEP).
Over the next 2 years, the AsyncGetStackTrace effort reimplemented the functionality in a more robust and testable way. However, it ran into a fundamental obstacle: Introducing a new native API at this level of the JVM proved difficult to justify, and the proposal did not move forward.
This forced a rethink. Instead of adding a new API alongside existing mechanisms, the focus shifted to improving what already existed, especially JFR. What emerged was an informal collaboration between engineers from Oracle, SAP, Amazon, and Datadog, working together to evolve the JVM’s profiling capabilities directly.
The breakthrough came from rethinking how stack walking itself could work. Instead of unwinding stacks in potentially unstable states, the idea was to record lightweight execution points—snapshots of where a thread was running—and walk the stack only at safepoints, where JVM structures are guaranteed to be consistent.
This approach, known as cooperative stack walking, originated from work by Erik Österlund (Oracle), who observed that Java stacks are stable between arbitrary instructions and the next safepoint. By deferring unwinding to a safe state, it avoids the instability of fully asynchronous techniques while preserving many of their benefits.
Markus Grönlund (Oracle) then implemented the initial stack-walking support in JFR, making it possible to build a first-class CPU profiler on top.
With this foundation, work accelerated. A new JFR-based CPU sampling mechanism took shape, combining the safety of the JVM with the accuracy expected from async profiling. This led to the first JFR-based CPU profiler landing in JDK 25. For a deeper look at the design, see the detailed write-up by one of the JEP authors.
This is just the beginning. The same approach opens the door to further improvements, including native frame support, richer profiling context, and new event types built on cooperative sampling.
The outcome
The result of this collaboration is a new, first-class CPU profiling event in JFR, introduced as an experimental feature in JDK 25. It provides an unbiased CPU-time sampling primitive built directly into the JVM, reducing the need to rely on unsupported internal mechanisms for accurate profiling.
The Datadog Java profiler uses this event when available, allowing us to deliver more reliable results with a simpler architecture. In practice, adoption of new JDK versions takes time, so modern profilers will need to bridge both worlds for the foreseeable future.
More broadly, this change benefits the entire ecosystem. Profilers no longer have to choose between safety and accuracy, and can instead rely on a stable, built-in CPU sampling mechanism.
For vendors like Datadog, Amazon, and SAP, this means delivering production-safe profiling without depending as heavily on unsupported APIs.
For the OpenJDK community, it establishes a new foundation for profiling directly within the platform. As newer JDK versions are adopted, this event can become the basis for a new generation of Java profiling tools.
What’s next?
Shipping the event as an experimental feature in JDK 25 is an important milestone, but it is not the end of the story. The next step is stabilizing the feature and graduating the event as it sees broader adoption and real-world validation.
There is more to build on this foundation. Support for native frames is already under development and will further close the gap between JVM-level profiling and whole-system visibility.
We are also exploring ways to safely capture stacks on demand, for example around events such as deadlocks or latency spikes.
In some cases, profilers still rely on AsyncGetCallTrace, particularly for unbiased wall-clock sampling. Reducing—and eventually eliminating—that dependency remains a shared goal with one possibility being proposed in an OpenJDK JEP.
Continuing to improve JVM profiling
Profiling can look straightforward from the outside, but the implementation—particularly in Java—can be more complicated than it first appears. The JVM provides an exceptional foundational technology for building diagnostic tools, but it continues to evolve alongside the systems that depend on it.
For those of us building production profilers, that means contributing back to the platform itself. In this case, improving profiling accuracy required changes deep inside the JDK, developed collaboratively across the OpenJDK community.
The work is not finished. We still need to stabilize the event and continue expanding what this approach can support. Areas of ongoing work include:
Capturing native frames in the new JFR event, which is currently under development with Amazon contributors.
Safely capturing stacks on demand around events such as deadlocks or latency spikes, an area Datadog contributors are actively working on alongside SAP and Amazon engineers. Today, this still requires
AsyncGetCallTrace, along with the tradeoffs and failure modes described earlier. For more detail, see JEP 8380294.
We will continue working with other OpenJDK contributors to improve profiling capabilities in ways that benefit the broader Java ecosystem.
If you’re experimenting with newer JDK releases, JDK 25 offers a glimpse of where JVM profiling is heading, and we’re excited to learn from early adopters.
If solving hard systems problems at scale sounds exciting, explore engineering opportunities at Datadog.
Resources
Johannes Bechberger: Java 25’s new CPU-time profiler (1) (deep dive)
FOSDEM 2025: Advancing Java profiling: Achieving precision and stability with JFR, eBPF, and user context (presentation by Jaroslav Bachorík and Johannes Bechberger)
JEP 8380294: Native Profiler Hook for Unbiased Stack Traces
