
Maël Lilensten
Senior Product Manager

Bridgitte Kwong
Group Product Marketing Manager
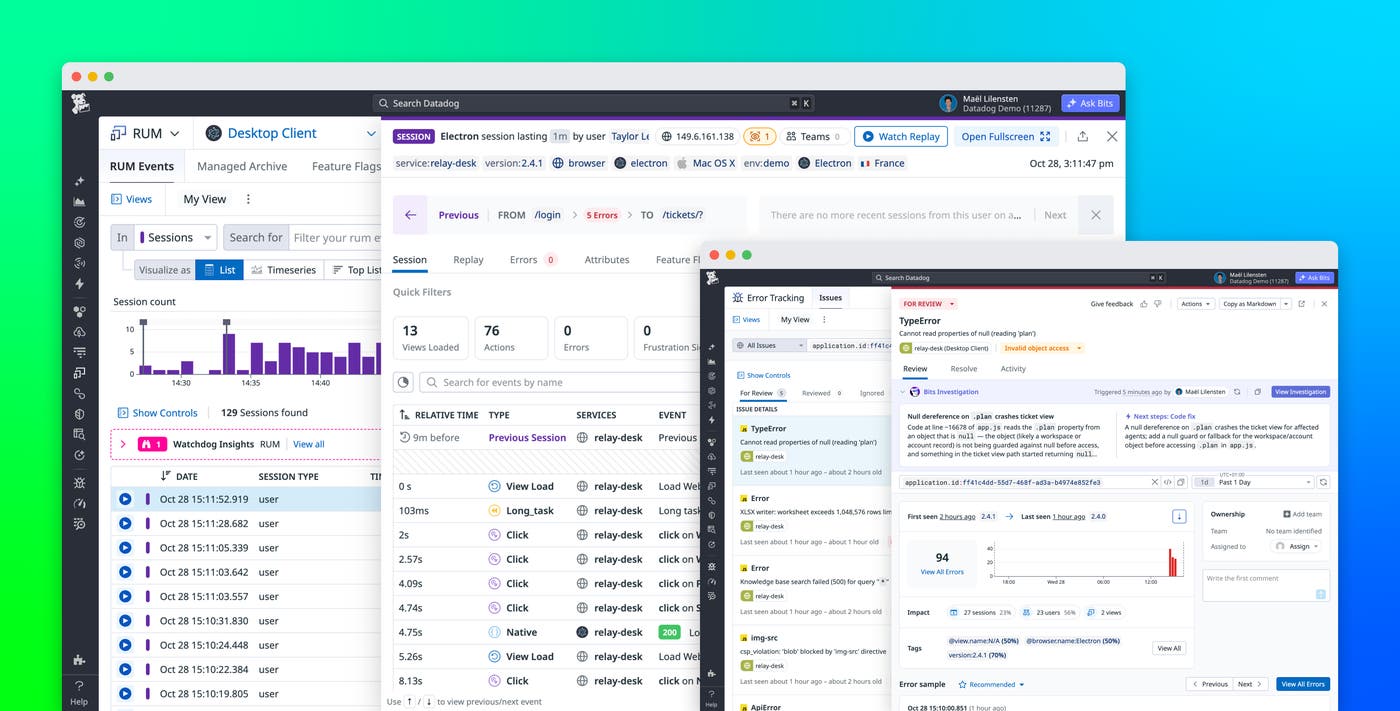
An Electron desktop application doesn’t run as a single browser page. Chromium renderer processes display the interface, while a Node.js main process manages the application life cycle, OS integrations, background work, and interprocess communication (IPC). As teams move authentication, background synchronization, model requests, and network orchestration into the main process, renderer-only monitoring leaves critical behavior out of view. A crash or failed request in Node.js can end a user session or leave the UI showing stale data without producing the Real User Monitoring (RUM) data that engineers need to investigate.
The Datadog Electron SDK extends RUM to the Node.js main process and combines main process and renderer events in one session timeline. It captures errors, crashes, views, and outgoing network requests from Node.js as RUM events, while the Browser SDK continues to collect user activity in Chromium. The Electron SDK also uses the Datadog Node.js tracing library to connect IPC and network work to backend traces, so teams can follow a request from a user action to the services that handled it.
In this post, we’ll explain how to:
Close the Electron main process observability gap
Consider a desktop app that closes during an overnight background sync. Support receives user reports, but the RUM session from the renderer simply stops. The failure occurred in the main process, so the browser-level timeline contains no error, failed resource, or stack trace that explains the exit. Engineers must reproduce the issue locally or piece together unrelated logs and backend traces.
This gap comes from Electron’s process model. Each renderer runs web content in Chromium, while the main process controls windows, native modules, file system access, subprocesses, and IPC between application components. A user click may begin in the renderer, trigger work in Node.js, and then call a backend API. Monitoring only the first and last parts leaves the process that coordinated the request unobserved.
That missing middle matters more as desktop applications move work out of the renderer. A dropped WebSocket connection in the main process, for example, can stop background updates even though the interface remains responsive. Users see stale data, while frontend telemetry suggests that the app is healthy. Capturing main process activity alongside renderer activity gives engineers the context to identify where the behavior diverged.
Unify RUM sessions across Node.js and Chromium
The Electron SDK uses a Node.js component in the main process to manage the RUM session, correlate events, batch data, and send it to Datadog. The Browser SDK continues to run in renderer pages, but it forwards renderer events through the Electron bridge so that both runtime layers use the same session context. The result is one RUM session that includes views, actions, errors, and resources from across the desktop application.
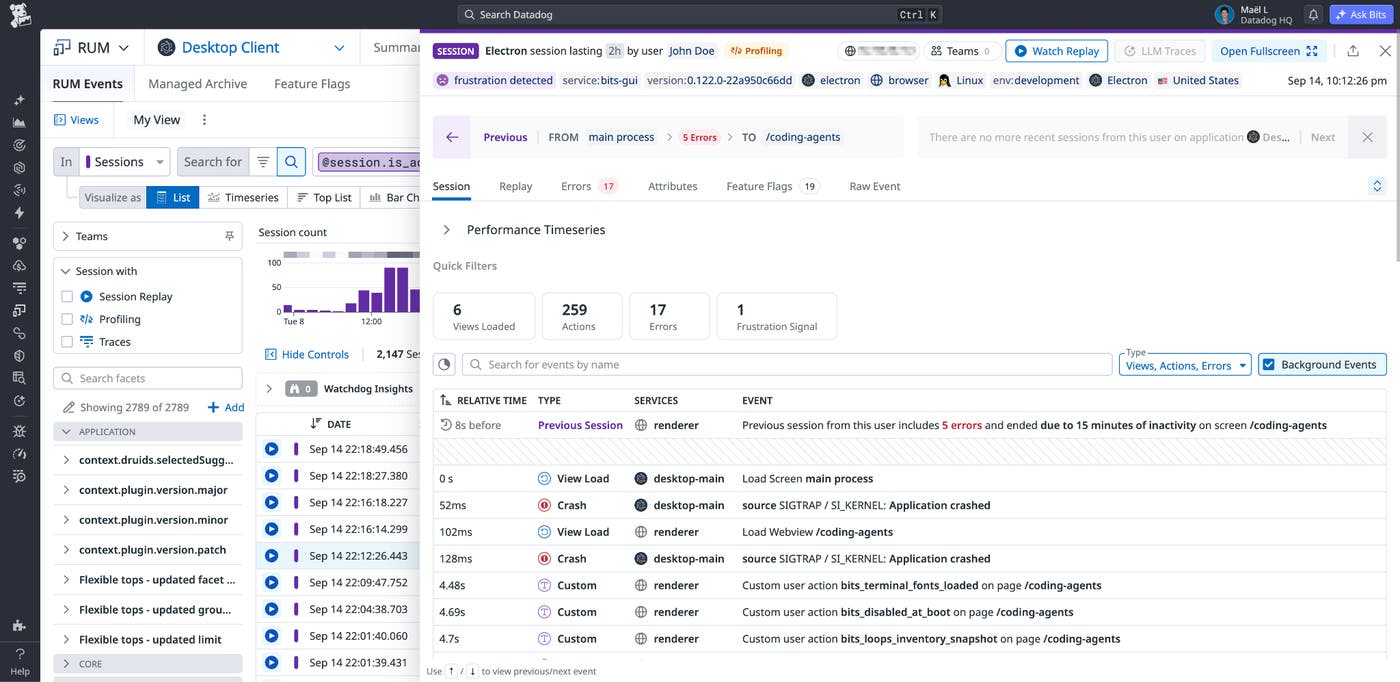
Events retain context about the process and runtime that produced them. This lets you distinguish Node.js activity from Chromium activity while keeping both in the same timeline. Electron, Node.js, and Chromium version information also helps you isolate issues that affect a specific desktop release or runtime combination.
In the background-sync example, the main process failure now appears in the same session as the user’s preceding renderer activity. Engineers can review the actions and resources that led up to the failure without matching separate session identifiers or switching between disconnected datasets. That shared context makes the RUM session a useful starting point for desktop support and incident investigation.
Capture crashes and network requests from the main process
Main process failures are especially disruptive because they can close the entire application. The Electron SDK automatically reports unhandled exceptions and native minidump crashes as RUM errors. Datadog places those errors in session context, so engineers can inspect the failure alongside the activity that preceded it instead of seeing only an abruptly ended session.
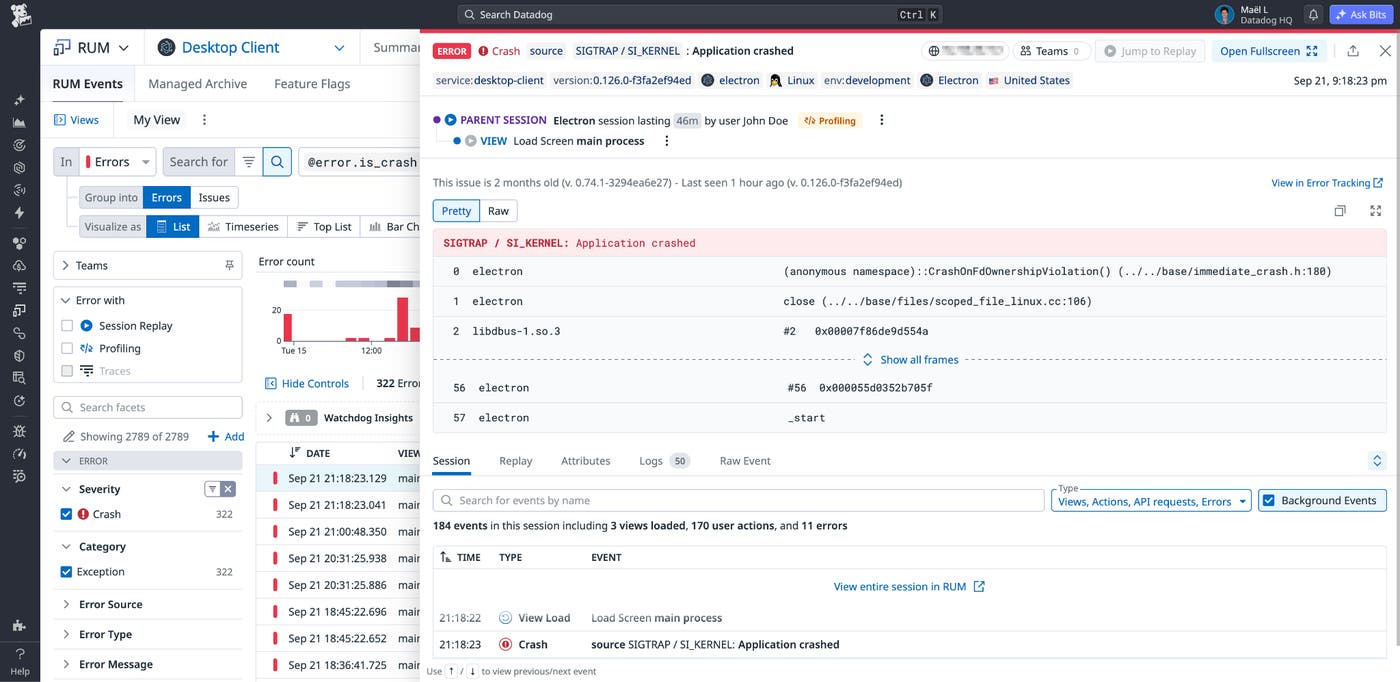
The SDK also records outgoing HTTP requests from the main process as RUM resources and creates a RUM view for the main process instance. This brings background API calls, synchronization requests, and other Node.js network activity into the same analysis workflow as renderer resources. When a request fails or slows down, you can compare it with the surrounding errors, views, and user actions.
This broader event coverage helps teams distinguish a UI symptom from a main process cause. A renderer may continue displaying cached data after a Node.js request fails, for example, or the application may exit after an unhandled exception during an OS-level operation. In both cases, the session contains evidence from the layer where the failure originated.
Trace work from the renderer to backend services
RUM events explain what the user experienced, but some investigations require code-level timing across process and service boundaries. The Electron SDK uses the Datadog Node.js tracing library (dd-trace) to capture traces for main process network calls, command execution, and IPC messages. When a renderer action starts work in Node.js, trace context can follow that work into an instrumented backend service.
The SDK associates Application Performance Monitoring (APM) spans from the Electron application with the RUM session. From a user action or resource in the RUM Explorer, engineers can pivot to the related trace and inspect the span waterfall across the main process and backend. This preserves the user context while exposing latency, errors, and dependencies at each step.
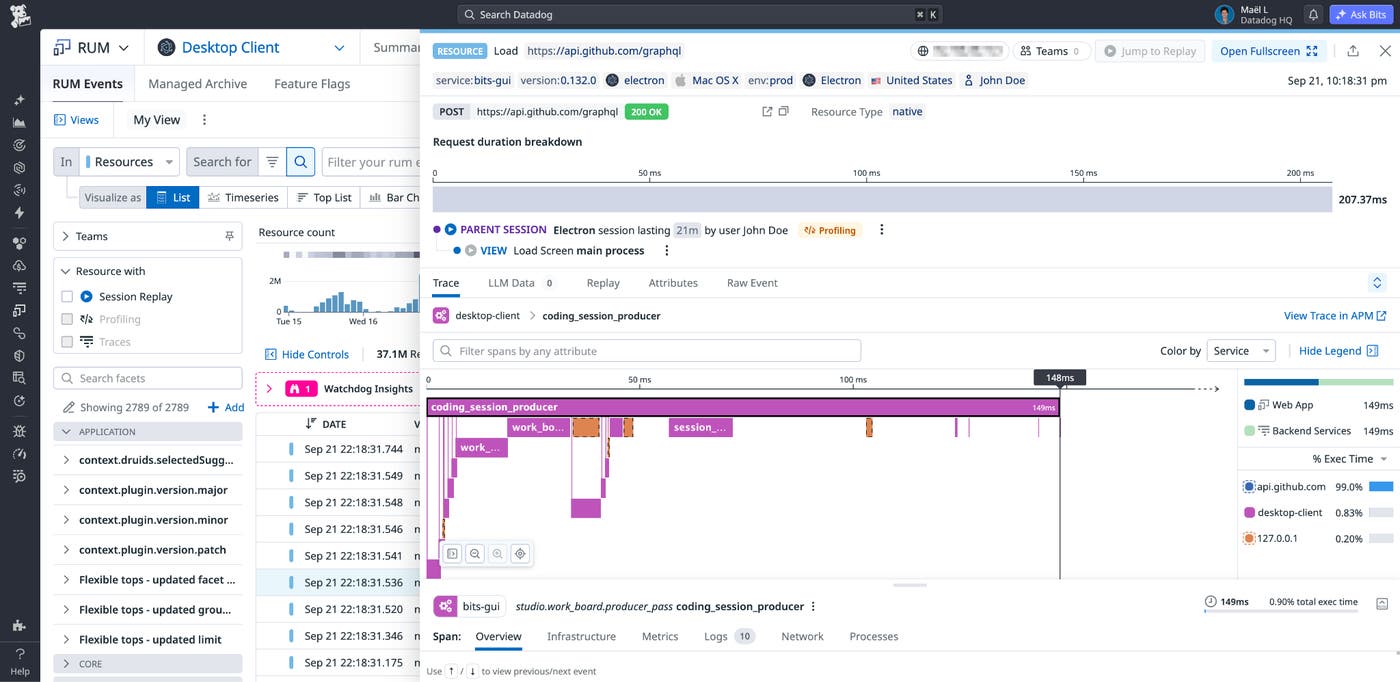
Suppose a button click sends an IPC message to the main process, which then calls an API that returns an error. Renderer-only monitoring might show the click and a generic UI failure, while backend monitoring shows the API error with no clear user context. With the Electron SDK, the trace connects the IPC work and backend request to the RUM session, making the path easier to follow.
Get started with the Electron SDK
By bringing main process errors, resources, and traces into the same context as renderer RUM events, the Datadog Electron SDK helps teams investigate failures that previously disappeared at the boundary between Chromium and Node.js. A single session can show what the user did, what the main process handled, and which backend services participated, reducing the manual correlation required to debug desktop applications across process boundaries.
Getting started takes two steps: Install the @datadog/electron-sdk package and initialize it in the main process, and add the Datadog Browser SDK to each renderer page. From there, the RUM Explorer and APM give you one workflow for moving between a user session and the trace behind it.
The Datadog Electron SDK is generally available for Electron 39 and later. If you are new to Datadog, sign up for a 14-day free trial.
