
Ethan Perez

Zhengda Lu
Software Engineer

Joel Marcotte
When your database performance degrades, diagnosing the root cause is rarely quick or straightforward. Your existing tools might surface metrics like CPU utilization, wait events, and query duration, but then leave you to correlate the data and identify what went wrong. Worse, what first appears to be the root cause can often just be a downstream effect of multiple interrelated issues. Cutting through all that complexity to get to an actionable fix requires deep database expertise, application knowledge, and institutional context.
Database Monitoring contributes a set of specialized tools and skills to Bits Chat, giving it deep query-, plan-, and resource-level diagnostics for databases. It draws on Datadog’s context about your database and application, and layers in experience from real-world incidents, to handle the diagnostic heavy lifting of root cause analysis. Engineers can ask questions and get answers in plain language about what broke, why it happened, and how to resolve it. For DBAs, platform teams, and application developers without deep database expertise, this means faster mean time to resolution (MTTR), fewer escalations, and the ability to find and fix performance issues.
In this blog post, we will cover how Bits Chat makes it easy for teams to:
Diagnose database issues without deep expertise
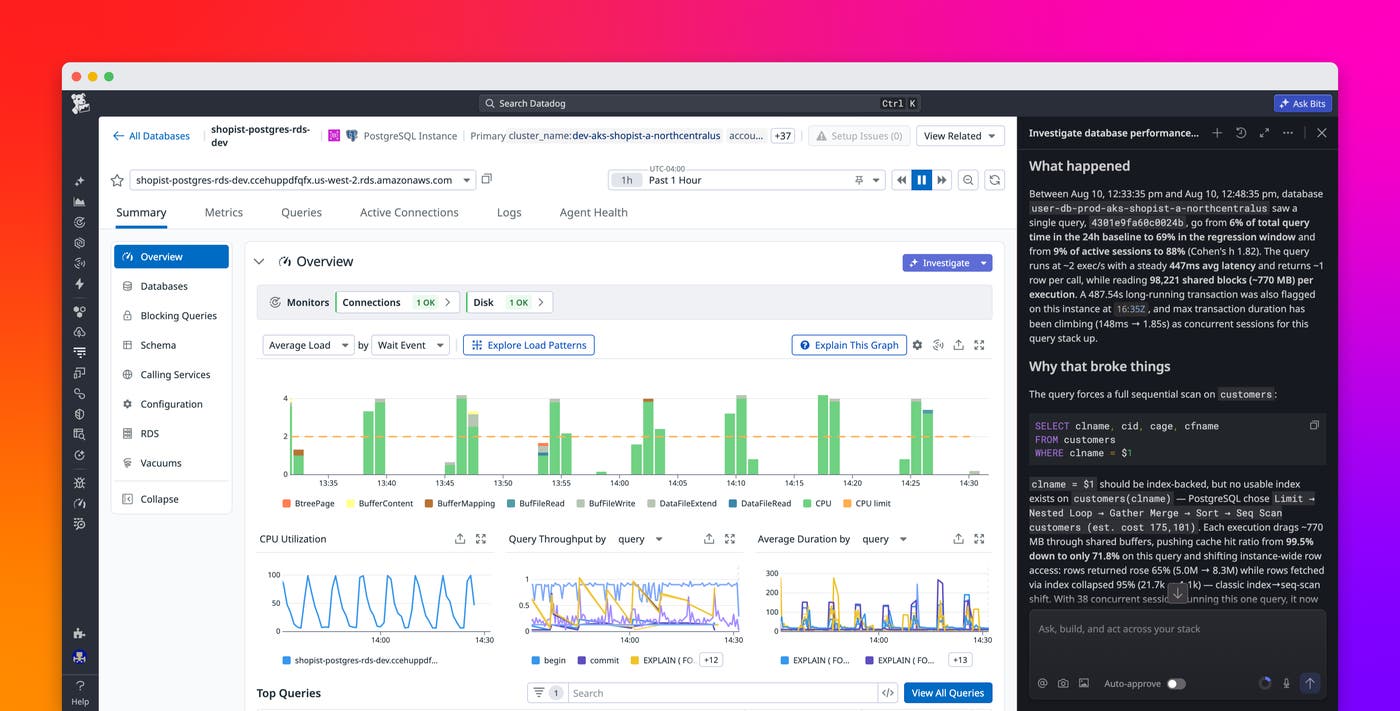
With database investigations in Bits Chat, any engineer can diagnose and resolve database performance issues. It independently examines workload metrics, query samples, execution plans, and logs across your stack, then points to a root cause along with concrete remediation steps. Each suggested step includes links to the relevant queries, services, and database instances, with live graphs displayed to confirm symptoms or verify fixes. And after reviewing the results of an investigation, engineers can refine the analysis by asking follow-up questions or adding context.
Trace a latency spike back to its source
When a deployment causes a performance regression, identifying whether the database is involved can be surprisingly difficult. Traditional tooling forces you to bounce between Application Performance Monitoring (APM) traces, deployment logs, service health dashboards, and execution plans, leaving you to stitch that data together yourself. Bits Chat does that work for you by correlating distributed traces, query metrics, and node-level execution plans in a single view. With all this information at its disposal, Bits Chat can quickly tell you which query regressed and on which instance.
Here’s an example of how this works in practice: Imagine an on-call engineer is paged because the p95 latency of a service endpoint has just tripled. The engineer follows the traces through APM to Database Monitoring and launches a Bits Chat investigation. More than 15 health checks run immediately. The health checks reveal that query latency has jumped from 15 ms to 447 ms, that 770 MB of shared blocks are read with each query, and that cache hit ratio has dropped from 99.5% to 71.8%. Bits Chat uses this information to identify the latency spike as a query-level regression, not instance saturation.
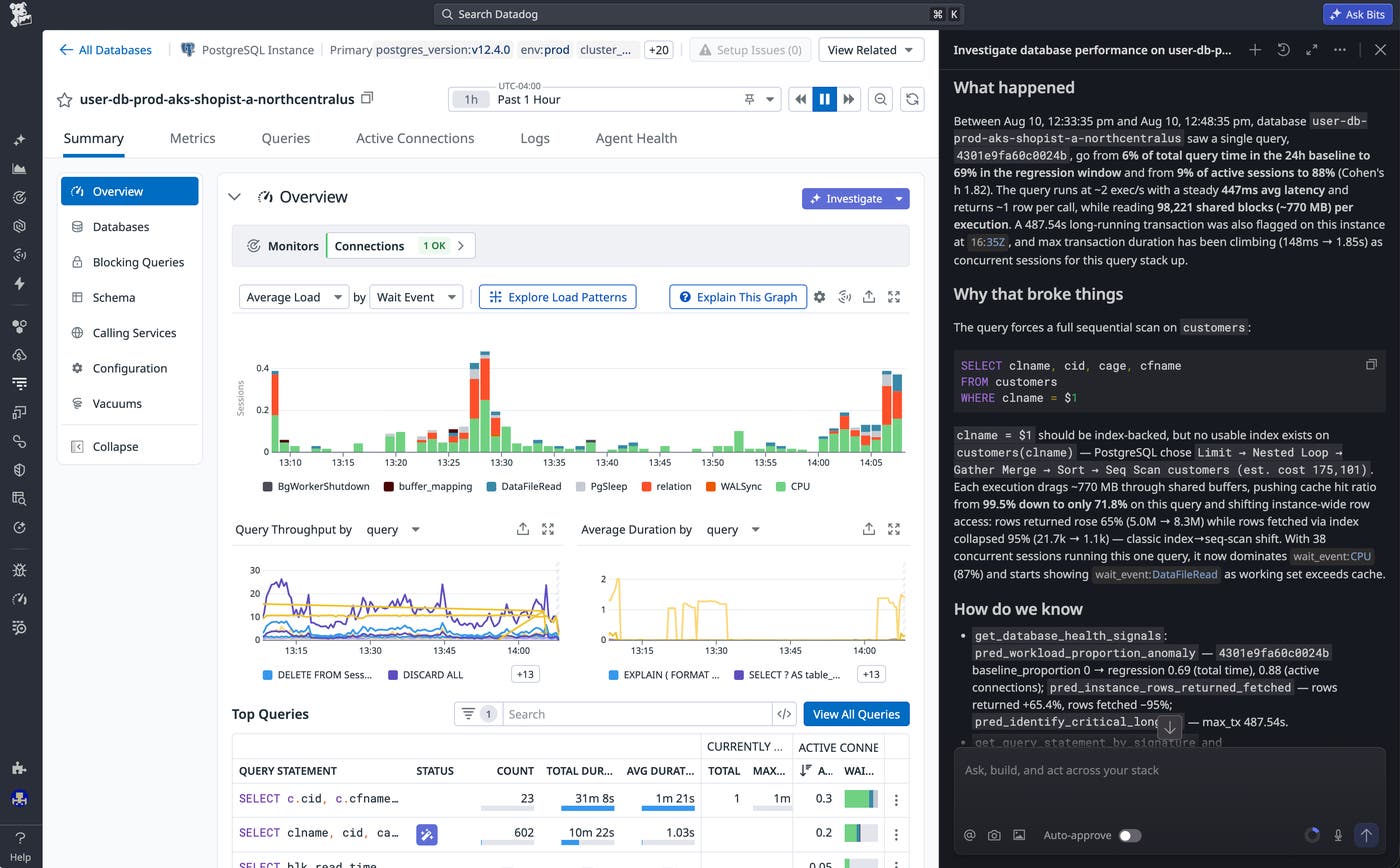
Pulling sampled execution plans, Bits Chat then identifies the cause: An index scan has flipped to a sequential scan on a large table, and the sequential scan is reading the entire table from disk. Cross-referencing schema and plan data, Bits Chat determines that the WHERE predicate in the updated query is not covered by an index. APM correlation ties the deploy directly to the latency spike and scan flip. The engineer adds a composite index and validates the fix by asking Bits Chat to re-check performance metrics. Logical reads are back to baseline, latency is at 16 ms, and execution plans are back to index scans.
Detect connection pool exhaustion
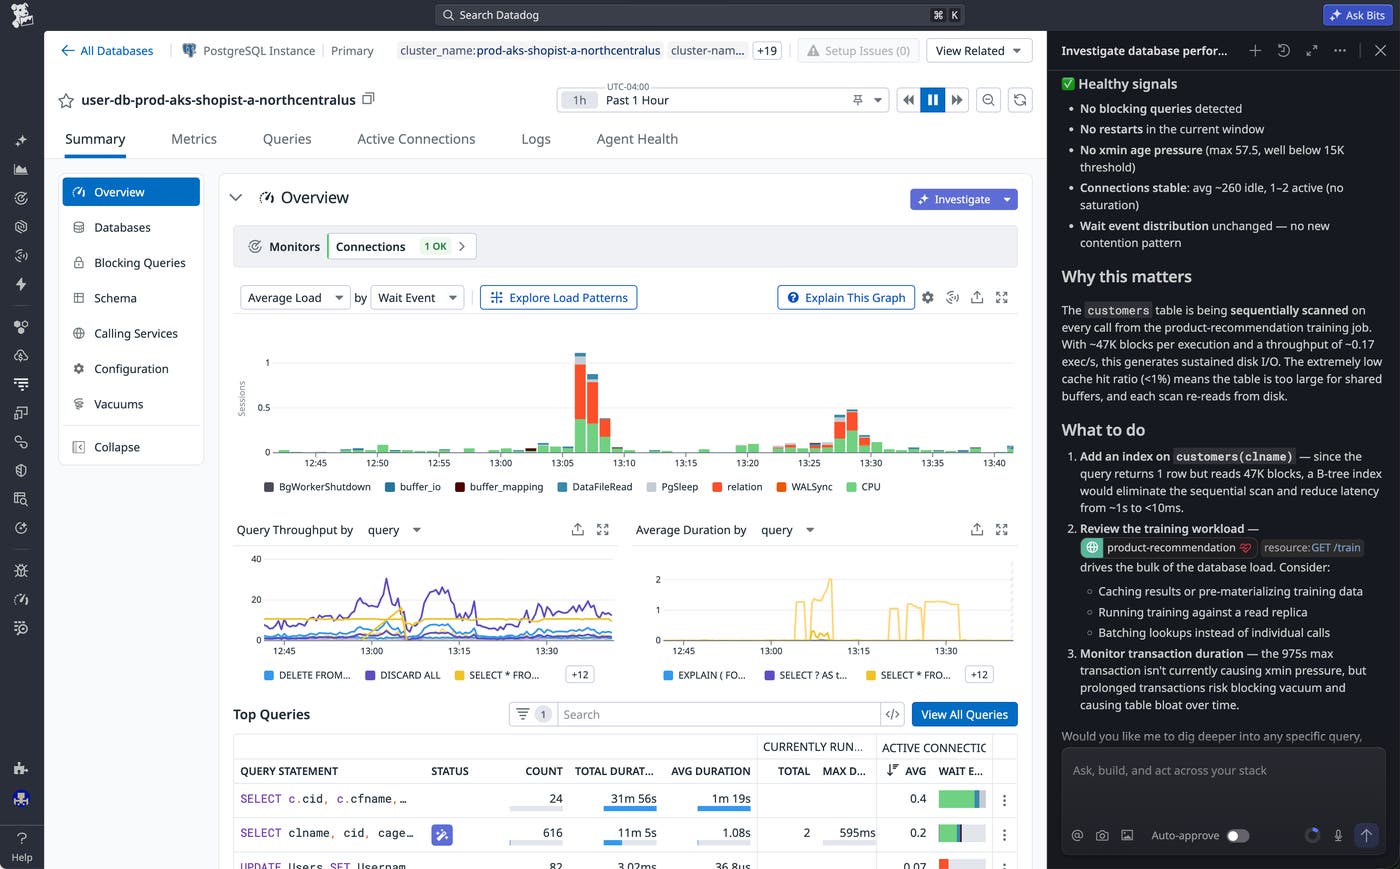
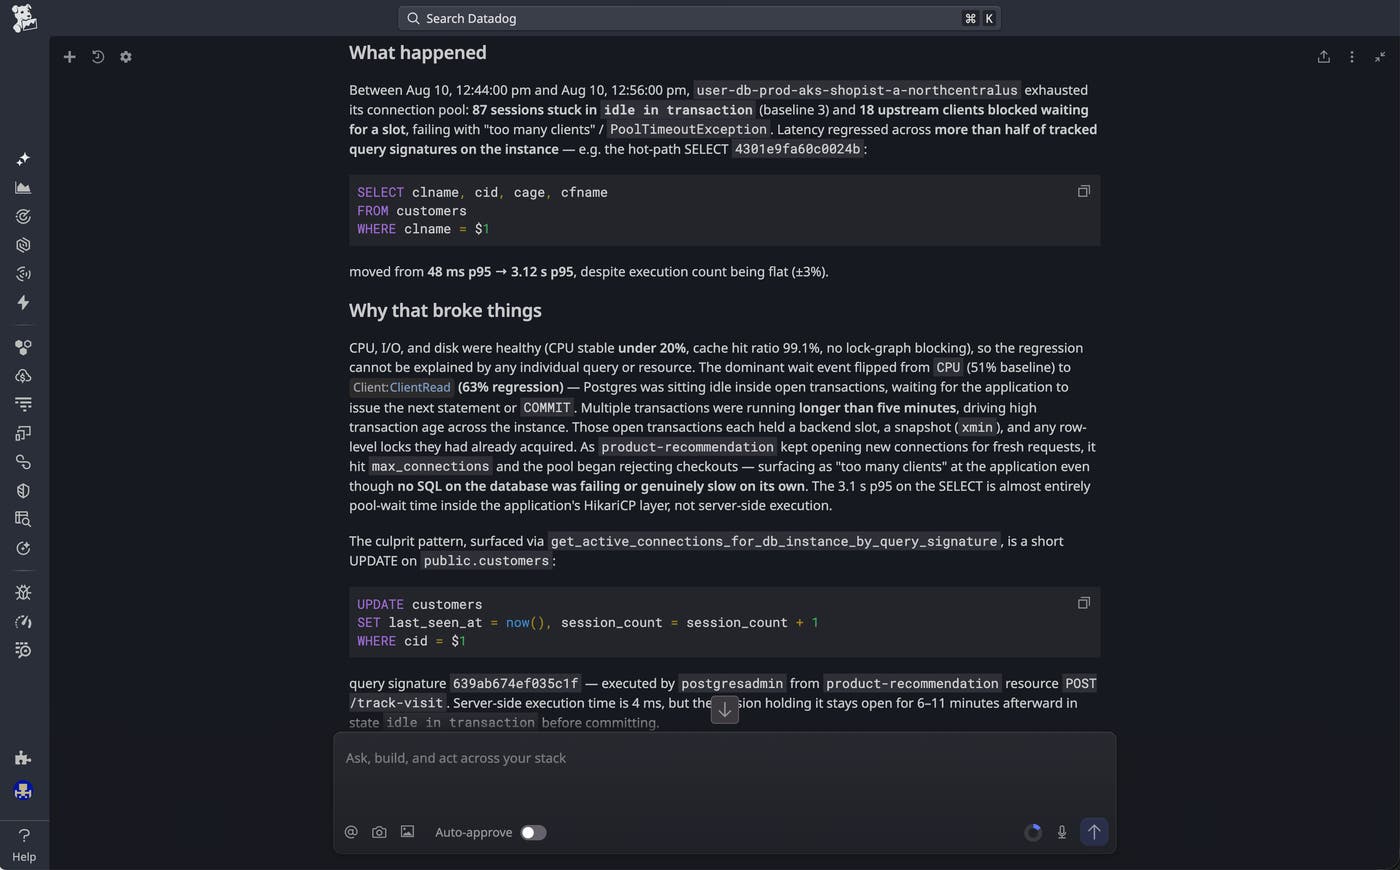
Connection pool exhaustion is notoriously difficult to identify as the root cause of poor database performance. When this is the case, the application might be throwing errors, but CPU utilization is often low, disk space is ample, and no individual query is failing. Without the right tooling, the root cause is effectively invisible.
Bits Chat can detect this type of problem because it can see the low-level interactions between application behavior and connection state. It also analyzes connection state breakdowns, transaction durations, and wait events together to surface what individual metrics cannot.
Catch replication lag before it affects your data
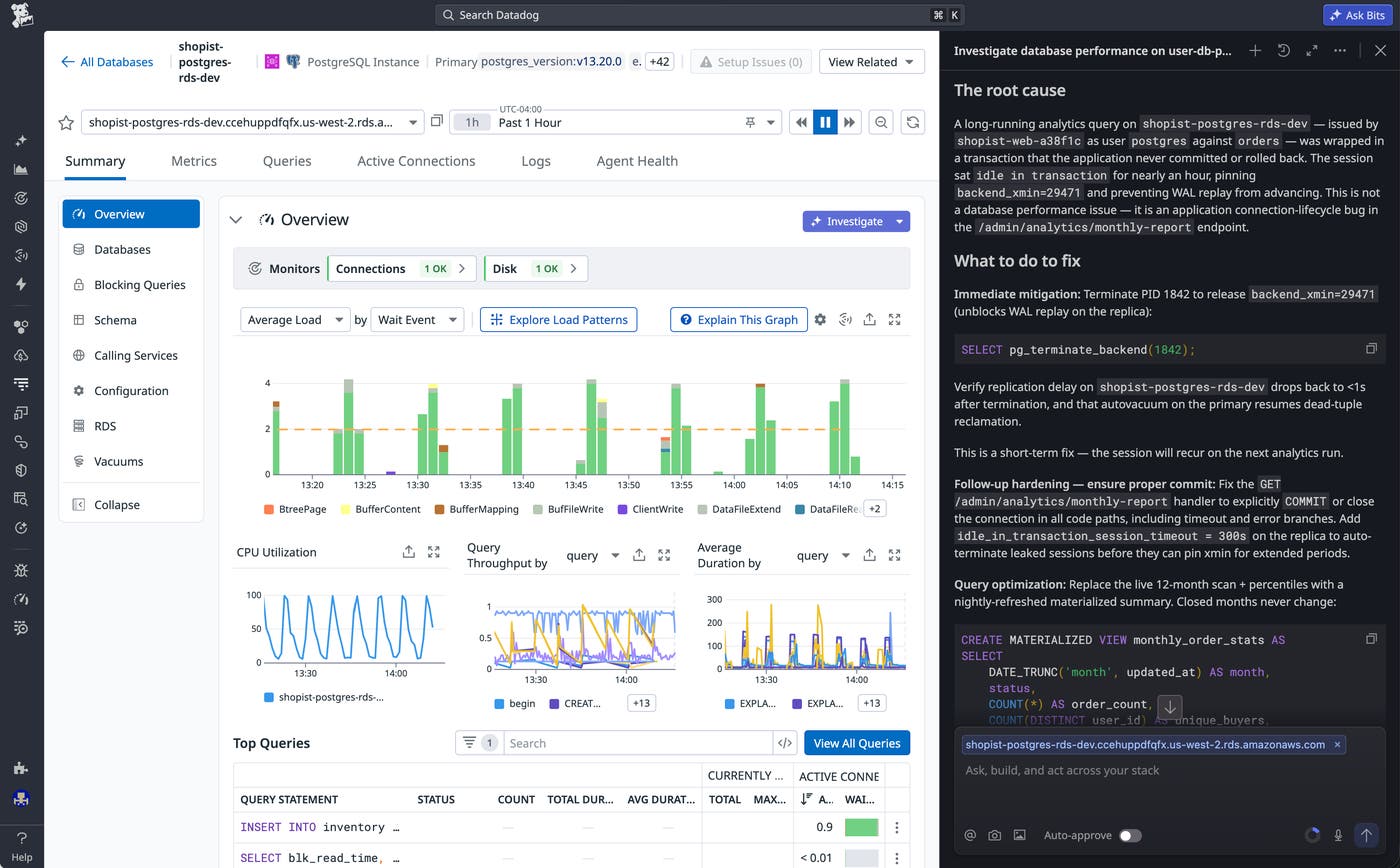
Replication lag is another database issue that is difficult to diagnose, specifically because the symptoms and their root cause can live in different parts of the cluster. Stale data returned from replicas can point to the primary’s write throughput or the replica’s own I/O as the culprit, but often neither is the main problem. The real issue is that write-ahead log (WAL) replay has stalled. Bits Chat helps you diagnose replication lag by reasoning about replication internals across your entire cluster. It can trace a lag spiral to the specific query and service that are blocking WAL replay, giving you specific steps to address the root cause.
As an example, consider a scenario where your analytics reports are displaying data that is growing increasingly stale. You know the reports read from a replica, so you perform a quick check on the primary. Everything looks fine, though WALs are starting to accumulate on disk. Your team then starts a Bits Chat investigation on the replica. Initial health checks reveal a long-running transaction and a high replication transaction ID age. Pulling instance-specific telemetry data, Bits Chat finds that replication replay has climbed exponentially and is still growing. WAL write and flush lag are both normal on the primary, which rules out the primary as the source of the lag.
Resolve database performance issues faster with Bits Chat
Database investigations in Bits Chat gives DBAs, platform teams, and application developers a fast and accessible way to resolve database performance issues. It examines the evidence across your entire stack and delivers a root cause together with concrete remediation steps, enabling engineers at all levels to resolve issues with confidence.
To read more about database investigations, visit the documentation. To learn more about how Bits AI is bringing agentic AI across the Datadog platform, see our Bits AI documentation. If you’re new to Datadog, you can sign up for a 14-day free trial.
