Prashant Jain

Amina Bouabdallah

Priyanshi Gupta
OpenTelemetry (OTel) is an open source, vendor-neutral observability framework that supplies APIs, SDKs, and tools for the instrumentation of cloud-native applications and services. OTel enables you to collect metrics, logs, and traces from a variety of sources and route them to various backends. By itself, however, it can’t help you analyze this data or correlate telemetry from different parts of your stack. To get the full picture, you need to pair OTel with a monitoring platform that enables you to visualize telemetry data across your application’s frontend and backend.
Datadog’s APM and RUM integration already provides full visibility into the journey of an API request issued from an application through your entire backend stack. This is done by automatically connecting distributed traces to RUM resources captured from web and mobile apps. As part of Datadog’s ongoing support for OTel, our Browser and Mobile RUM SDKs now support W3C and B3 trace headers, so you can bring this full-stack visibility to your OTel-instrumented applications with minimal added configuration. In this post, we’ll describe how our enhanced OTel header support enables you to:
- Gain full-stack visibility into OTel-instrumented apps
- Pinpoint the root cause of increased latency and failed requests
Gain full-stack visibility into OTel-instrumented apps
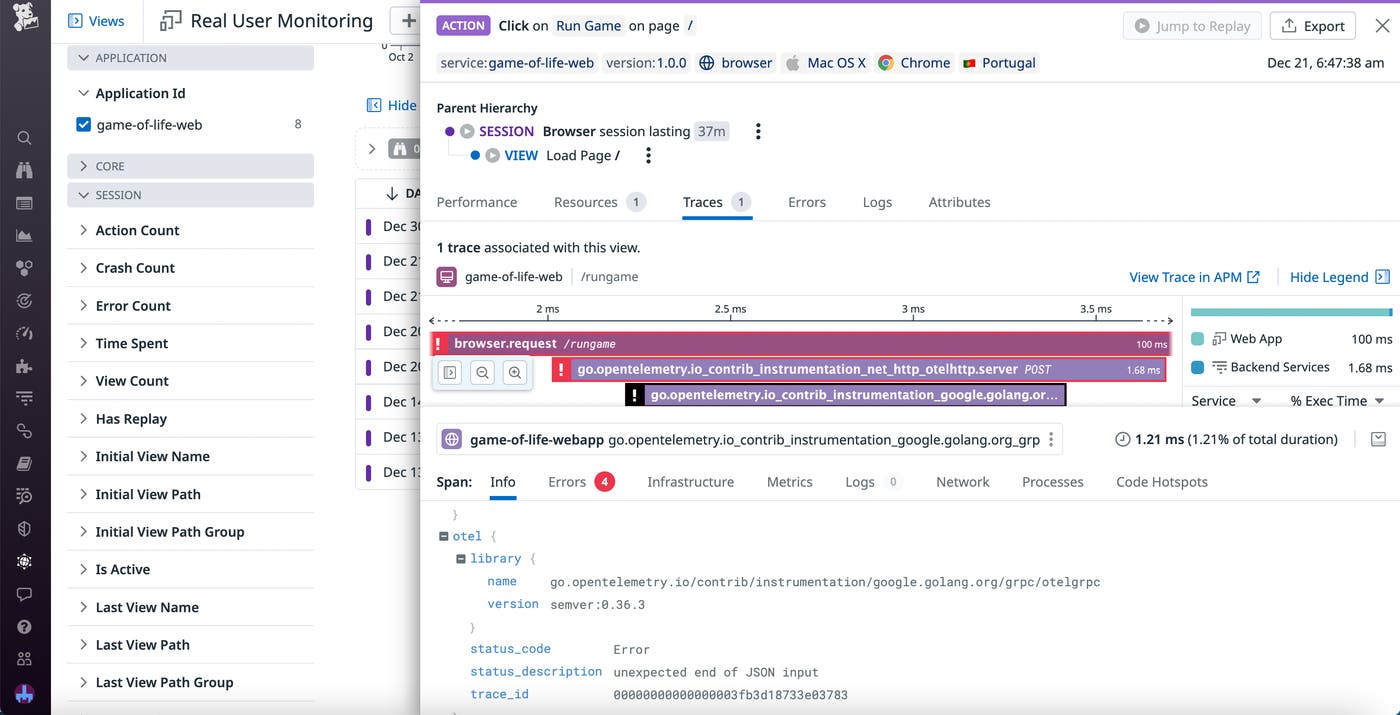
Datadog already allows you to ingest and view traces from OTel-instrumented apps directly in APM, enabling you to live-query traces in real time, visualize dependencies in the Service Map and Request Flow Page, and automatically detect anomalies, outliers, and root causes of critical failures. With the addition of support for W3C—the OTel default—and B3 trace context formats in the Datadog RUM SDKs, you can now access traces from OTel-instrumented apps inside Datadog RUM as well. This full-stack visibility streamlines the collaboration between frontend and backend teams, enabling them to easily understand the sequence of events behind issues for users in both the web and mobile environments.
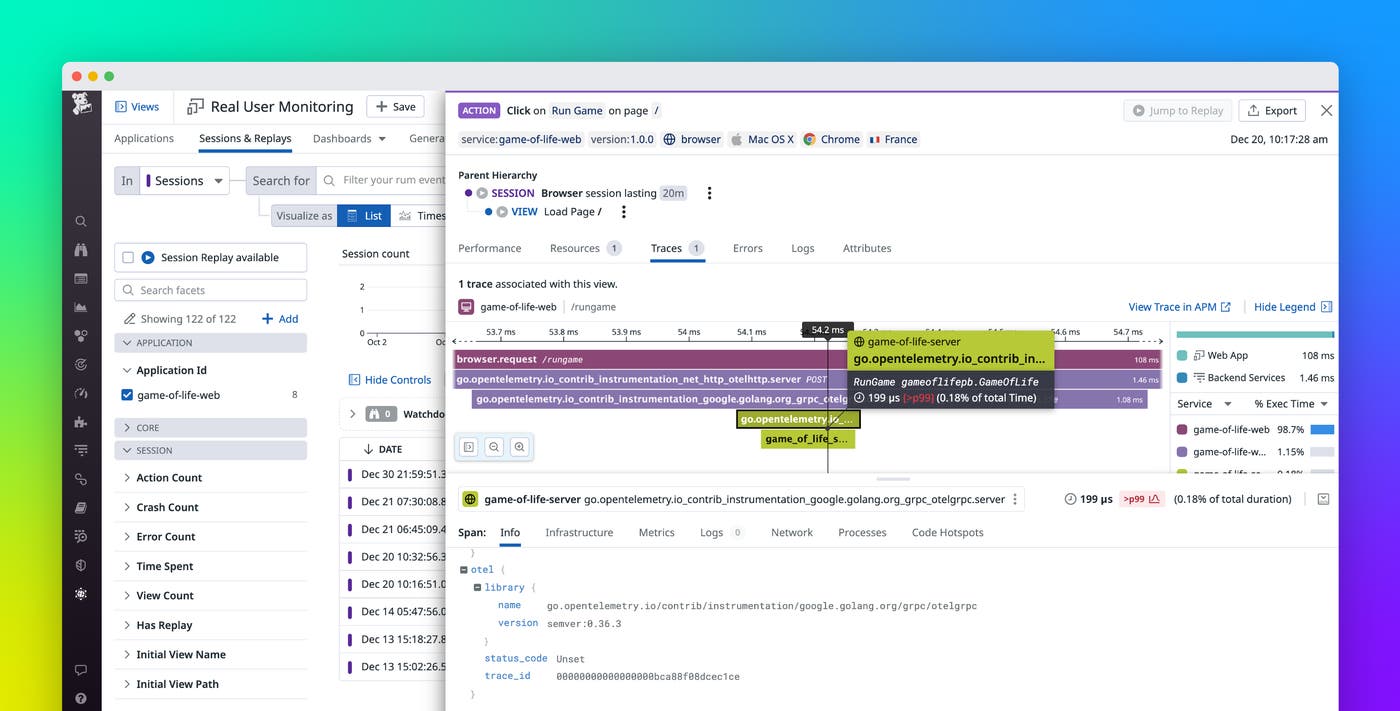
By giving you the ability to link these traces to related resources directly within RUM user sessions, this integration enables you to leverage powerful RUM features for quick troubleshooting and effective root cause analysis for your OTel-instrumented apps. After ingesting your OTel-generated traces via the Datadog Exporter or Datadog Agent, you can get visibility into the user activity that triggered the trace capture. Use a session link to pivot from viewing a trace in APM to a related Session Replay to analyze the steps a user took before and after an issue occurred. Or view your OTel-instrumented traces alongside detailed product analytics and a wide range of out-of-the-box web and mobile performance metrics to gain additional context from frontend impacts.
Pinpoint the root cause of increased latency and failed requests
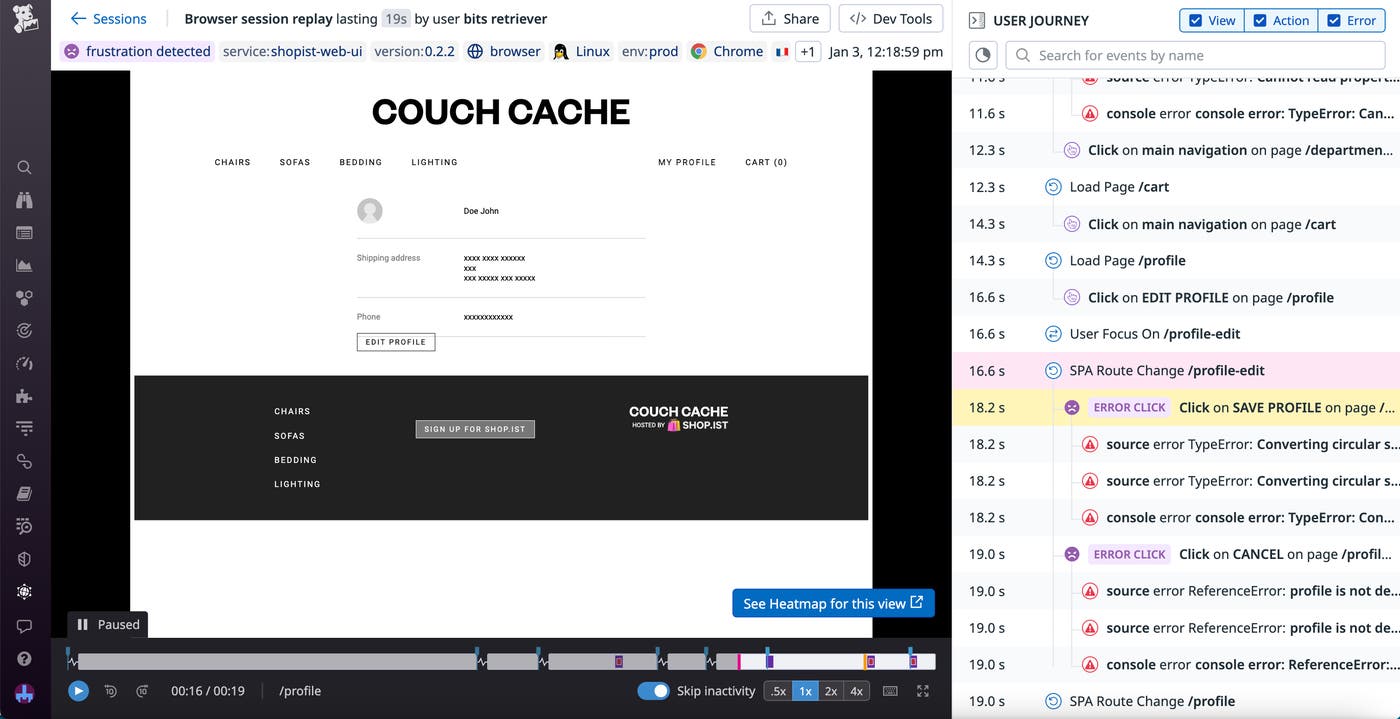
With the end-to-end correlation of user actions, requests, and backend traces that RUM provides, you can easily investigate issues by working your way from frontend impacts to backend root causes without ever leaving the page. This helps you identify which backend services are the culprit when your OTel-instrumented app is responding slowly to user requests or failing altogether.
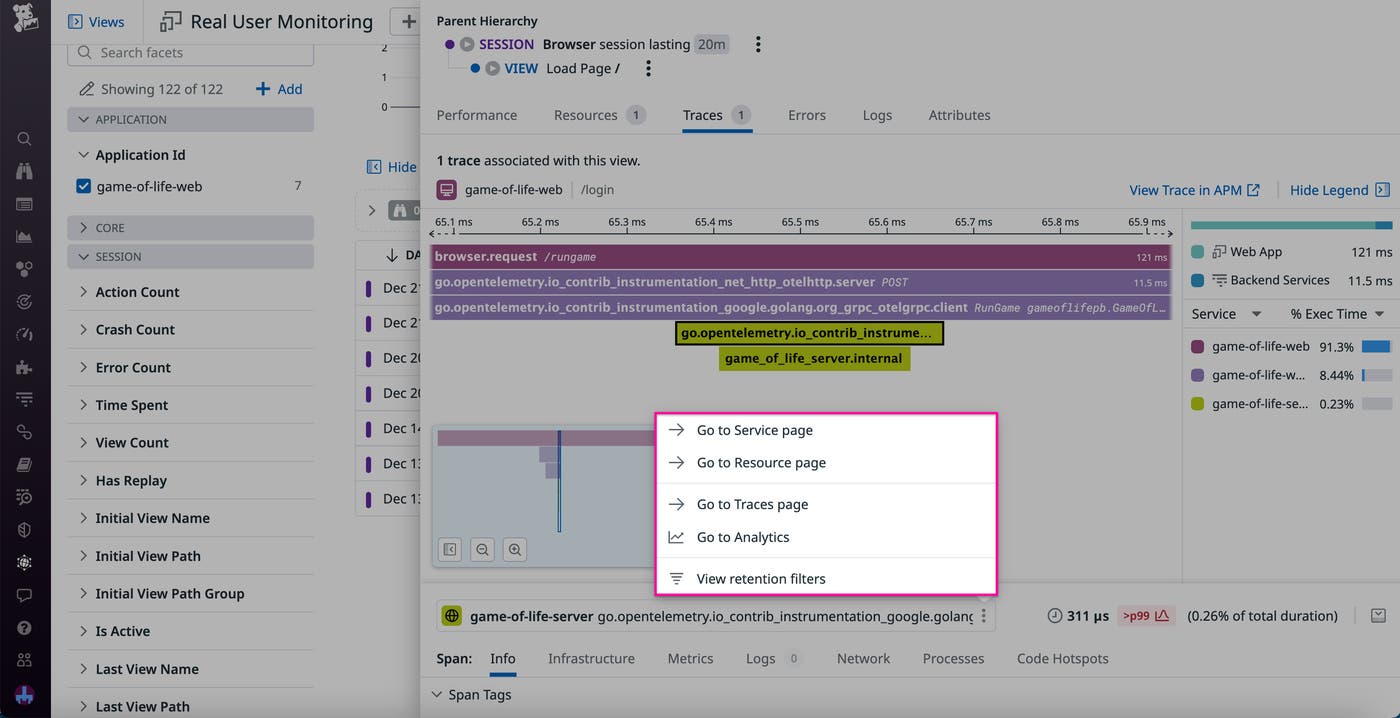
Let’s say you receive an alert that frustration signals on the login page have dramatically increased within the past hour. By accessing details for the login action within the impacted RUM user session, you discover that login requests have been experiencing high latency, which has led to an increase in rage and error clicks. As shown in the following screenshot, the APM-RUM integration enables you to then jump directly from the trace in RUM to the associated APM Service page, where you can identify and troubleshoot the problematic authentication service.
You can also leverage the APM-RUM integration to identify the root causes of failed requests. Say that while investigating the login issue, you receive an alert that your authentication services have stopped accepting new requests altogether. After viewing the alert in Error Tracking, you can use the session link on the error message to jump to a related session. There, you observe that not only can users no longer log in, they can’t perform any authentication-related activities whatsoever, such as changing their passwords or creating new tokens via two-factor authentication. Thanks to the automatic correlation between traces from your OTel-instrumented backend and RUM events, you can pinpoint the authentication API that seems to be denying your requests, and by looking at the list of related resources, you can confirm that this API has indeed started to throw error codes.
Start correlating your OTel-instrumented traces across APM and RUM today
With our expanded support for W3C and B3 headers in the Datadog RUM SDKs, you now have end-to-end visibility of the journey that an API request makes from a RUM-monitored web or mobile app through your entire OpenTelemetry-monitored backend stack. This gives you the full picture of what happens when a user or application makes a request, enabling your frontend and backend teams to troubleshoot through a single lens.
To get started, see our documentation to learn how to collect traces from OTel-instrumented apps in Datadog, enable the Datadog APM and RUM integration, and add W3C and B3 trace context to your RUM SDKs. Or, if you’re not yet a Datadog customer, you can sign up for a 14-day free trial today.
