

Tarun Kothandaraman
Associate Product Manager
Instrumenting a tech stack for distributed tracing is a complicated process that often takes weeks. For large fleets running services written in multiple languages, the timeline could be months. Every service needs a tracing library added, configured, and redeployed, and that work has to fit into each team’s release schedule.
Datadog’s Single Step Instrumentation (SSI) cuts the time it takes to instrument your applications to send traces to Datadog APM down to minutes. Because of this time savings, we recommend SSI as the default instrumentation option. However, there are still some cases where manual and custom instrumentation may make sense, if SSI can’t reach or see deep enough into a service.
In this post, we’ll cover the distinction between auto-instrumentation and SSI and explain why the latter is our default recommendation for instrumenting your applications to send traces to Datadog APM. Then, we’ll discuss some less common scenarios when manual instrumentation still makes sense, when to add custom instrumentation, and how to determine if your situation fits one of these categories.
Auto-instrumentation vs. SSI
While the terms auto-instrumentation and SSI sometimes get used interchangeably, they describe different things. The rest of this guide will be easier to follow once we distinguish between them.
Auto-instrumentation is a capability of the Datadog tracer. Once the tracer is loaded into an application, it integrates with the libraries already in use—e.g., the web framework, the database client, the cache, and the message queue—and produces spans for them automatically. No tracing code is required from the developer. Every Datadog tracer provides auto-instrumentation by default, regardless of how it was installed.
Single Step Instrumentation is a method for getting the tracer into the application in the first place. Instead of a developer adding the tracer as a build dependency, the Datadog Agent detects supported runtimes on the host and injects the tracer at process startup. The application code and build configuration are untouched. SSI is one of two installation methods; the other is manual instrumentation, where the tracer is added to the application as a dependency.
The tracer that ends up running is the same in either case, and so is the auto-instrumentation it provides. The choice between SSI and manual instrumentation is about installation methods, not tracing approaches.
OpenTelemetry (OTel) has its own equivalents for this same delivery problem, the OTel Operator on Kubernetes and OpenTelemetry eBPF Instrumentation (OBI) chief among them. If you’re already standardized on OTel, those are the building blocks to look at; this guide focuses on the SSI path specifically.
Why we recommend SSI as the default instrumentation method
When manually instrumenting services to send traces to APM, a developer adds the tracer as a build dependency, configures it, and redeploys the service. For a fleet of hundreds of services across a dozen or more teams, this process could take months, as it has to be coordinated across every team’s roadmap and release calendar.
SSI removes that coordination problem. You install the Datadog Agent with APM Instrumentation enabled, and the Agent detects supported runtimes on the host and injects the tracing library at process startup. Because there are no code changes, build changes, or service-team involvement, the time to first trace across an entire fleet drops from weeks or months to minutes.
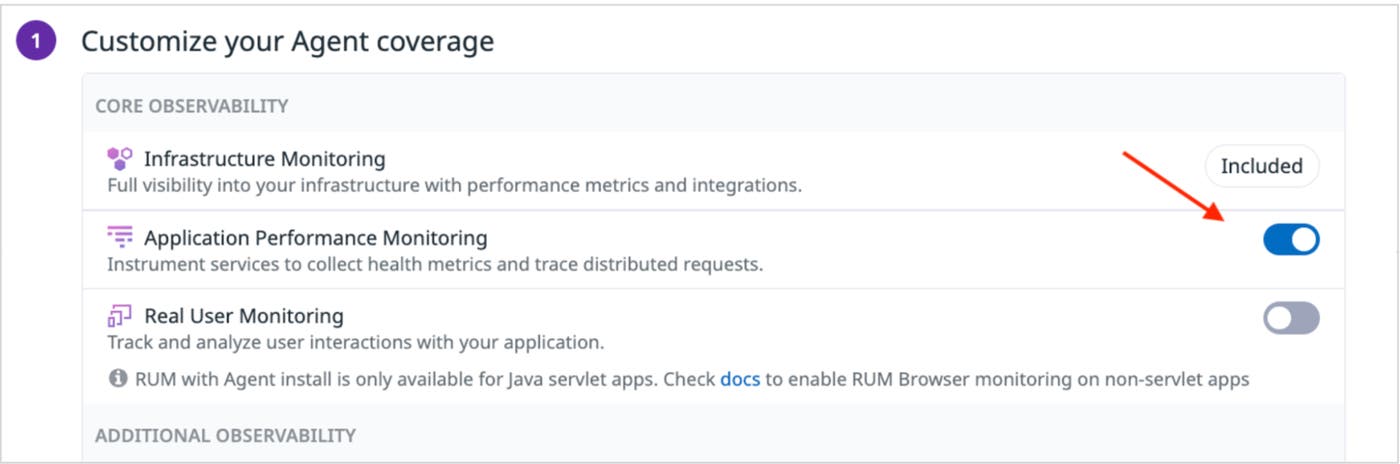
The magnitude of this reduction in the time and complexity required to instrument your services for APM is why we recommend SSI in almost all cases.
When to fall back to manual instrumentation
SSI works by injecting a tracing library at process startup. That mechanism has some structural limits that teams may encounter, including:
Go services: Go compiles to statically linked binaries, so there’s nothing for SSI to inject into at process startup. Manual instrumentation with
dd-trace-gois one path. Compile-time instrumentation is another: Datadog and Alibaba joined forces to build the OpenTelemetry Go Compile-Time Instrumentation project, which just reached its first stable release (v1.0). It instruments your code, its dependencies, and the standard library at compile time with no manual span code required.Unsupported runtime versions: SSI supports a specific range of language versions. If a service runs on something older, SSI will skip it silently.
Platforms without host-level Agent control: SSI needs the Datadog Agent positioned to inject into your processes, which works on Windows, Linux hosts, Docker, and Kubernetes. On platforms like Amazon ECS, you don’t have that control, so SSI can’t operate.
In these scenarios, manual instrumentation remains the fallback method to get your services sending traces to Datadog.
The process for determining if manual instrumentation is needed is simple. First, enable SSI across your fleet. The services that don’t show up in APM are the ones that need manual instrumentation. The only trade-off is that your team owns the tracer’s version and upgrade cadence, instead of the Agent doing it for you.
When to add custom instrumentation
Adding custom instrumentation is a different decision altogether. Here, you’re not choosing between SSI and custom instrumentation; you’re choosing whether to add spans of your own, on top of whichever method you used to get the tracer running. Whether you’re using the Datadog SDK or the OpenTelemetry SDK, both implement the OpenTelemetry API, so you can just use it and be sure the same spans and attributes will reach Datadog either way.
Auto-instrumentation stops at the framework boundary. Anything happening inside your handler—such as a fraud check, a pricing calculation, or a feature flag lookup—is invisible. From the trace’s perspective, your handler is one opaque span.
Usually, that opacity is not a problem, but there are two situations where it may become one:
A slow endpoint with no detail in the flame graph:
POST /checkoutshowing as one long bar tells you something is slow but not what. Wrapping cart validation, fraud check, and inventory reservation in their own spans turns that bar into a flame graph, which gives you a level of detail you can act on.Business context on traces: Adding custom tags like
user.tier,order.value, orpromo.codeto your spans lets you ask more targeted questions than you can with auto-instrumentation, such as “Are premium customers seeing higher latency?” or “Is this campaign driving the load spike?”
If business needs require this level of granularity, you can add custom instrumentation to your application code that will enable you to programmatically create or modify traces sent to Datadog. While managing and maintaining additional tracing code comes at some operational cost, it may be worth it for increased precision in your tracing data.
How to decide between SSI and manual or custom instrumentation
Here’s a framework for deciding whether you need to instrument your services manually or add custom instrumentation beyond what SSI offers.
Default to SSI: Use SSI to cover as many of your services as deeply as you can. For most services, you’ll likely be able to stop at this step.
Use manual for the gaps SSI can’t reach: If you have services that use Go, unsupported runtime versions, or ECS, you can fall back to manual instrumentation. You don’t need to predict or resort to guesswork as to where these gaps lie; you’ll be able to determine what’s missing in step 1.
Add custom instrumentation where auto-instrumentation isn’t enough: In cases where business context changes how you need to investigate issues, add custom instrumentation to get more granular visibility into your spans.
SSI is generally available on Linux hosts, Docker, and Kubernetes for Java, Python, Node.js, .NET, Ruby, and PHP, with Windows IIS support GA for .NET. Check out the SSI documentation for detailed setup instructions.
If you’re new to Datadog, sign up for a 14-day free trial.
