Steve Harrington

David Tepper
Canary releases are a powerful technique for updating large-scale production environments safely. The idea is simple: deploy the update to a subset of your environment, pause and monitor to ensure everything is healthy, and then deploy to the next subset.
But implementing these staged releases can be challenging, as you’ll need to retool your deployment pipeline and build programmatic health checks to validate the success of each canary release. Microsoft’s new Azure Deployment Manager (ADM) helps streamline this process by adding new functionality into Azure Resource Manager.
Datadog is proud to join Microsoft as a launch partner for the public preview release of ADM. By using Datadog monitors as automated health checks in ADM, canary releases in Azure are easier to set up and more effective than ever.
What is ADM?
Azure Deployment Manager is a new feature set for Azure Resource Manager that helps you run canary releases. With this new functionality you can define stages for deployments (e.g., by gradually rolling out updates across one region at a time) and use automated health checks to monitor the health of your services at specified points within each stage before proceeding to the next step.
Microsoft uses this exact approach internally to facilitate safe, reliable deployments across hundreds of services. It allows Microsoft to prevent or dramatically reduce service unavailability caused by regressions in updates, and it can help your organization do the same.
To set up ADM canary releases in Azure, you’ll need to configure what are known as Service Topologies and Rollouts within Azure Resource Manager.
-
A Service Topology is a template that describes and orders the resources you want to deploy to Azure
-
A Rollout defines the order for deploying the Service Topologies and where to interject wait periods and integrated health checks
If a health check fails during the wait period, Azure will automatically stop the deployment, helping to limit any problems that might result in rolling out to more regions. For full documentation and tutorials see the ADM documentation and Microsoft blog.
Full coverage with Datadog
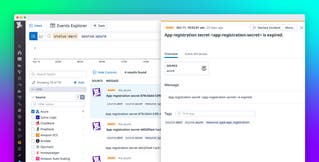
Integrating Datadog health checks into your ADM deployments is easy—you can use the monitors you’ve already set up in your account, or define new monitors (using our advanced alerting capabilities) to help determine the health of your services at each phase. By instrumenting your ADM Rollout with the monitoring service you use already, troubleshooting is simplified. If a failed health check prevents your deployment from progressing, you can immediately start investigating the root cause of the failure by looking at the relevant triggered monitors in the Datadog platform.
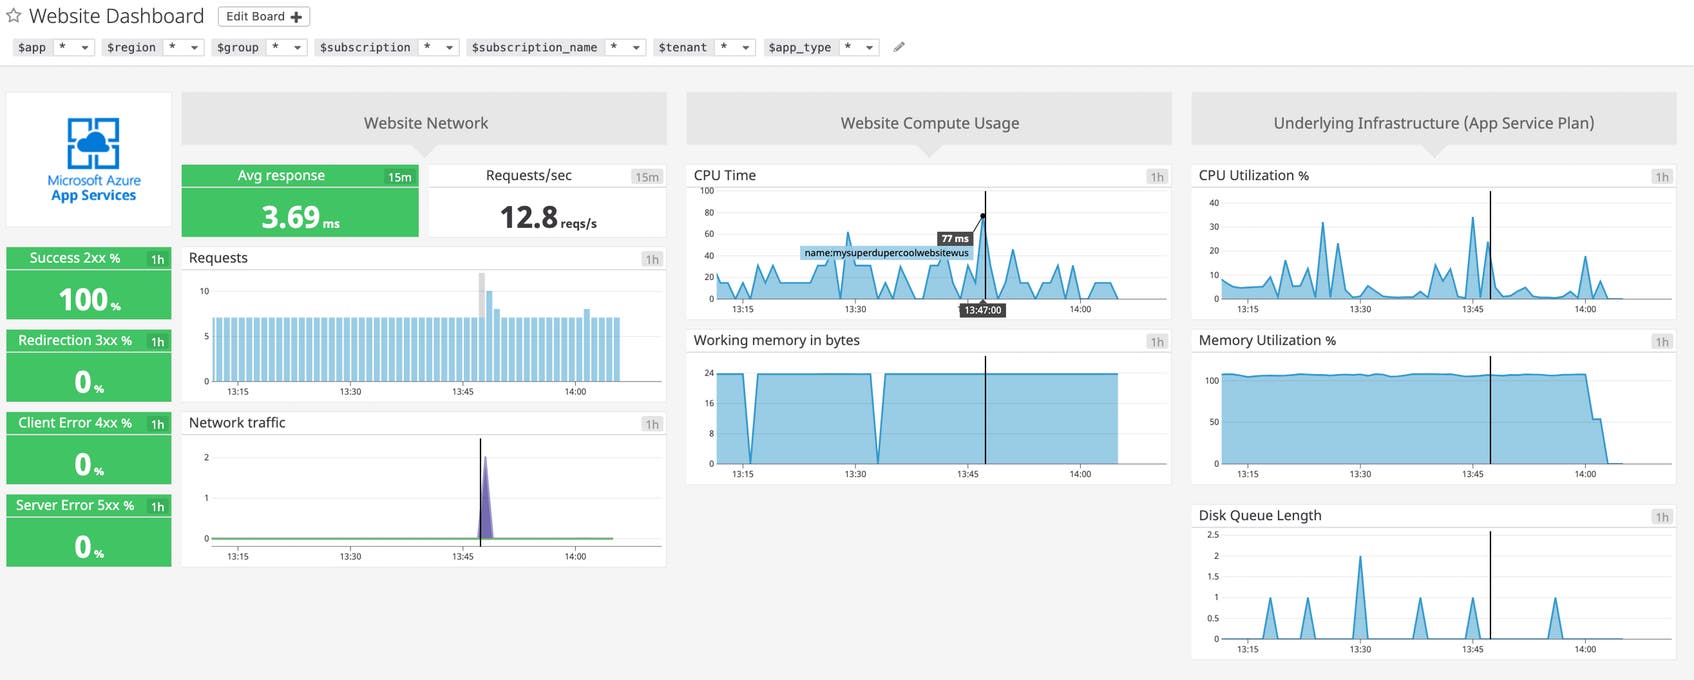
From there, you can quickly jump across relevant metrics, logs, or request traces to understand and resolve issues with canary releases like you would any other problem. Datadog includes many out-of-the-box dashboards for Azure services, or you can create custom dashboards like the one shown below.
Integrate Datadog for health checks
The first step in using Datadog for your ADM health checks is to create monitors that accurately portray the health of the affected resources during each deployment phase. Then, you configure health check steps in your ADM Rollout template that reference their respective monitors to confirm deployment health for that step before moving on.
Create monitors for ADM Rollouts in Datadog
Health check steps in ADM work best when they are checking for the status of a single monitor, so we recommend using Datadog’s composite monitors. This allows you to monitor multiple criteria and logically combine their states into a single healthy/unhealthy status for each ADM health check step.
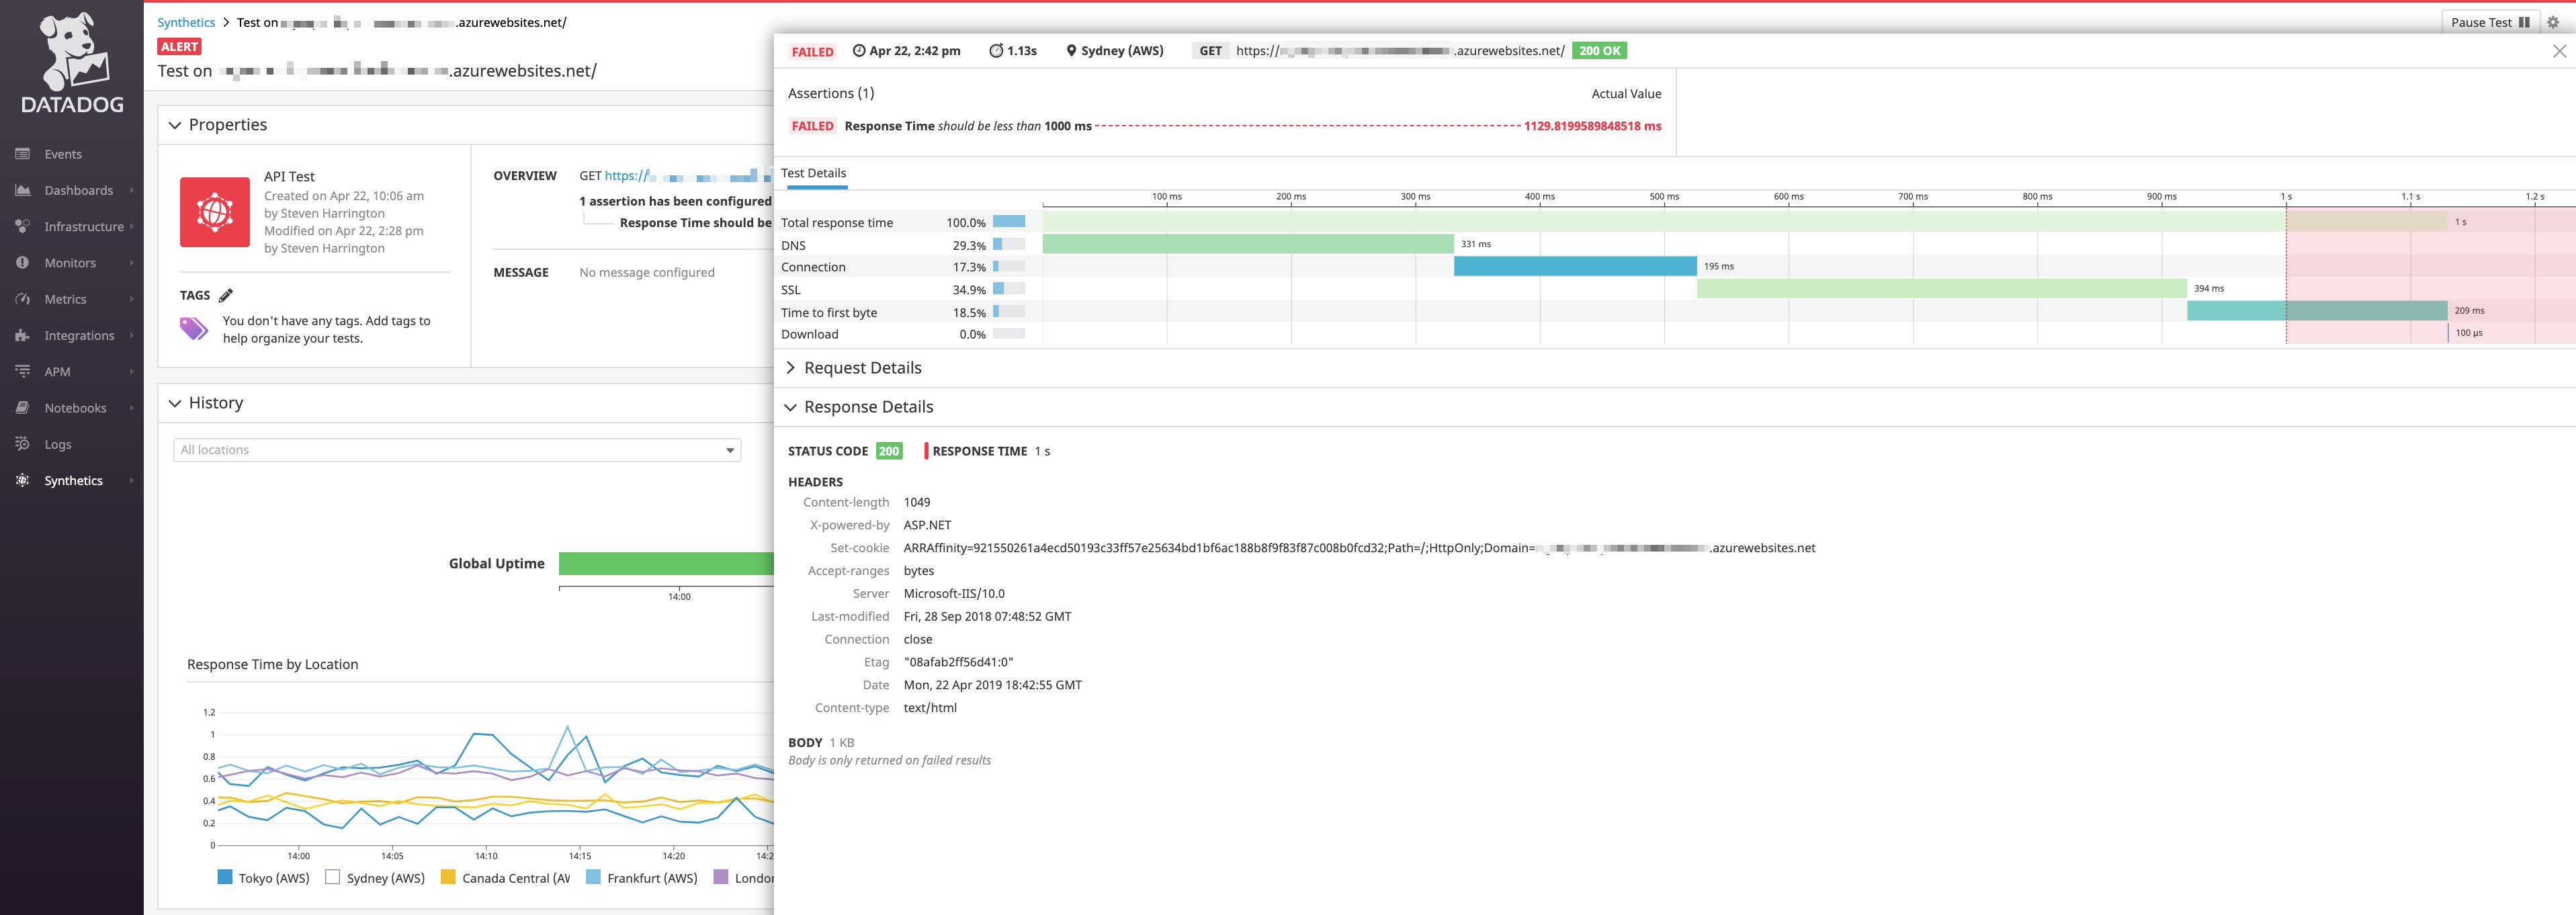
For example, we can configure an API test to validate that users can access our website from several locations. In many cases, this type of synthetic monitoring check would be useful to include as part of a health check in an ADM deployment phase.
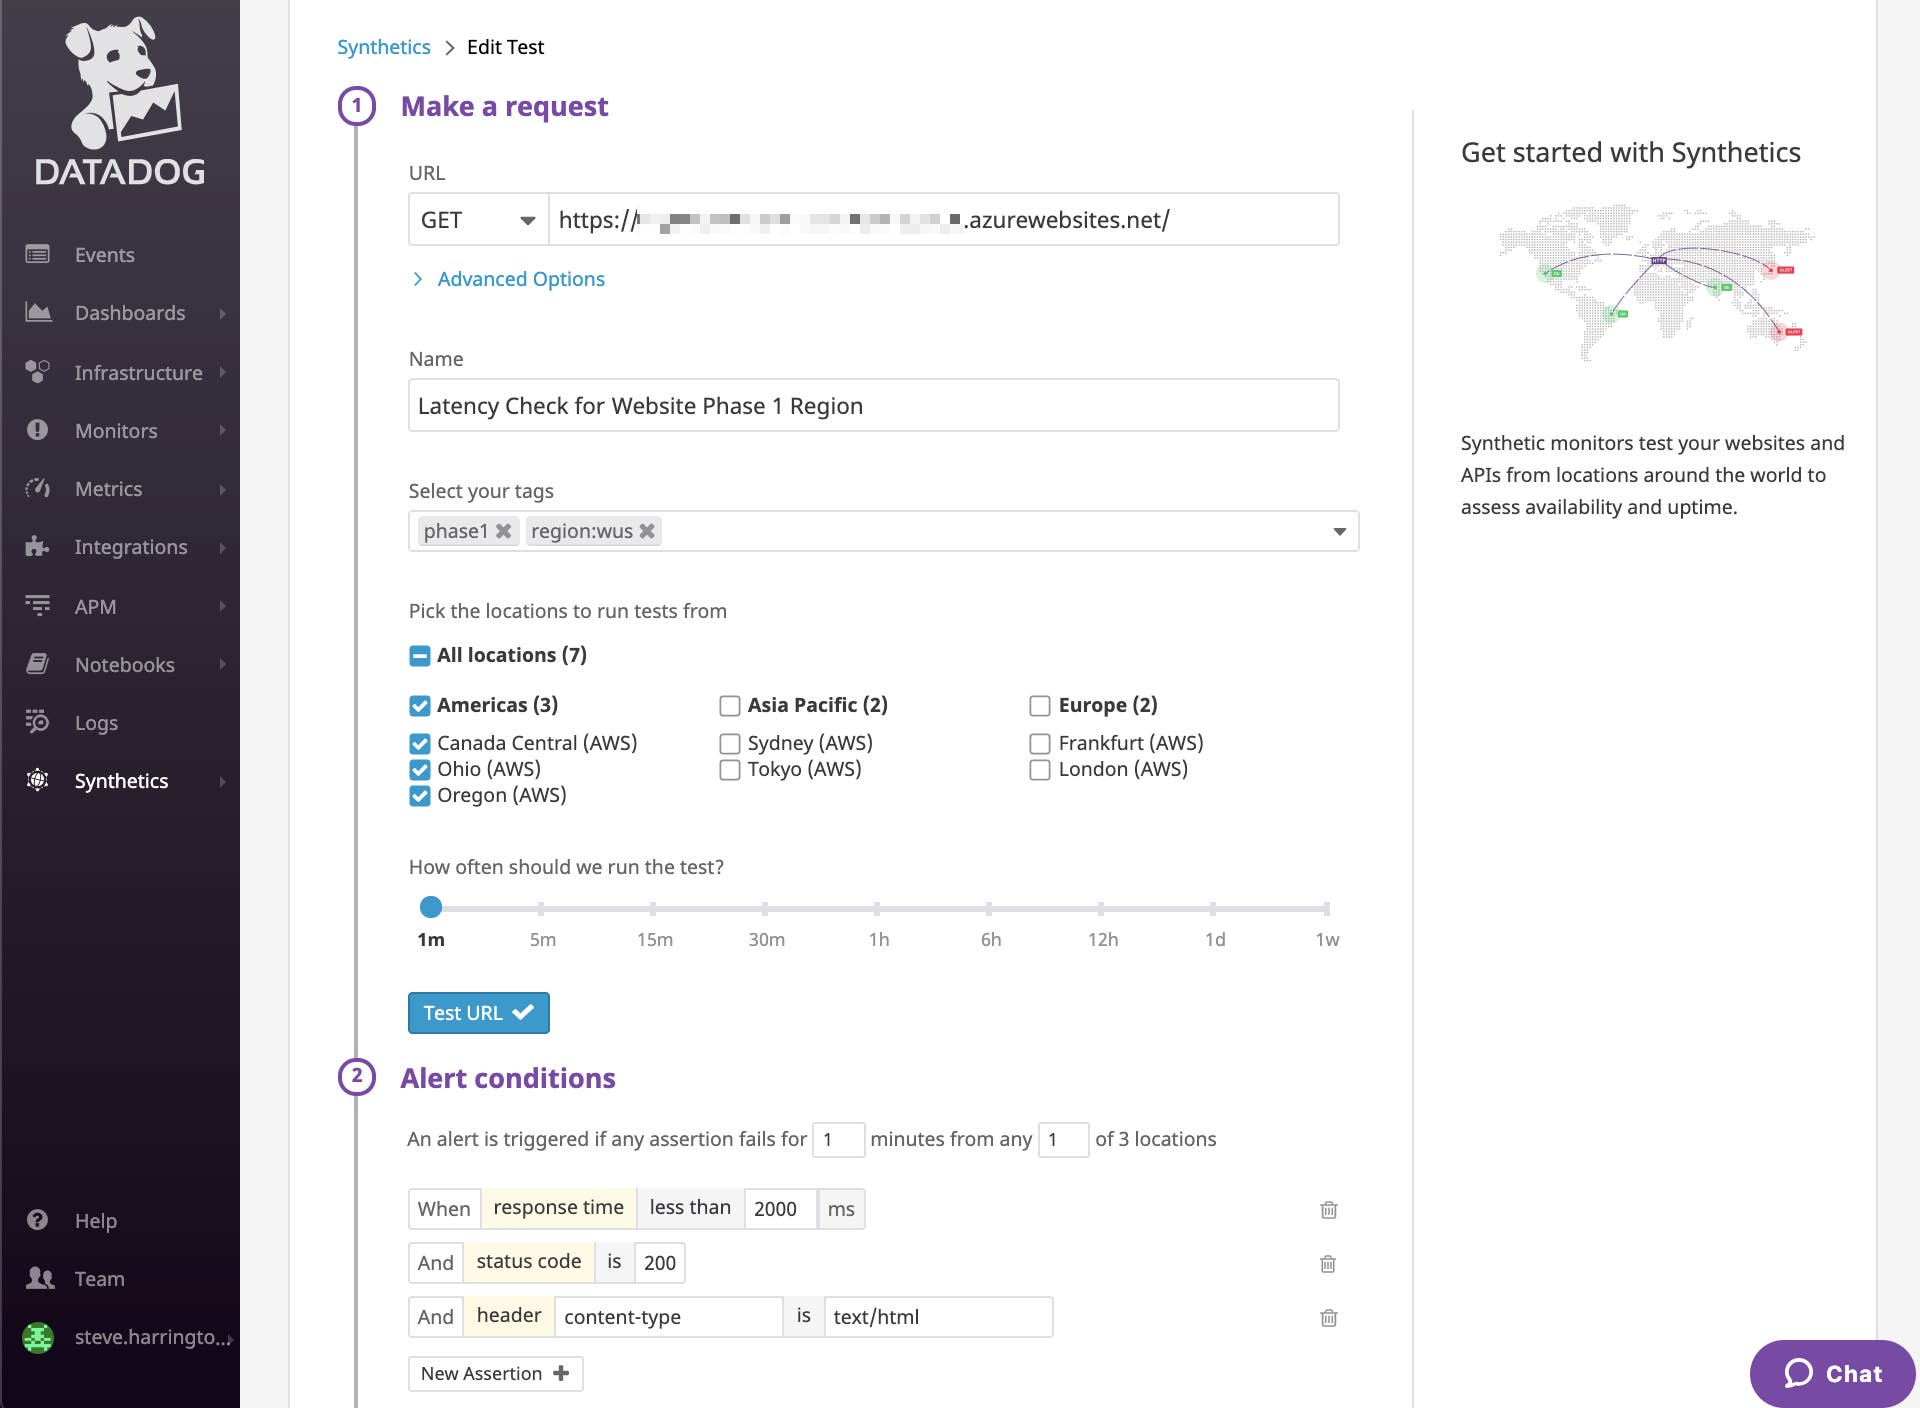
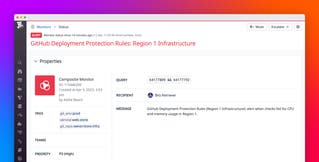
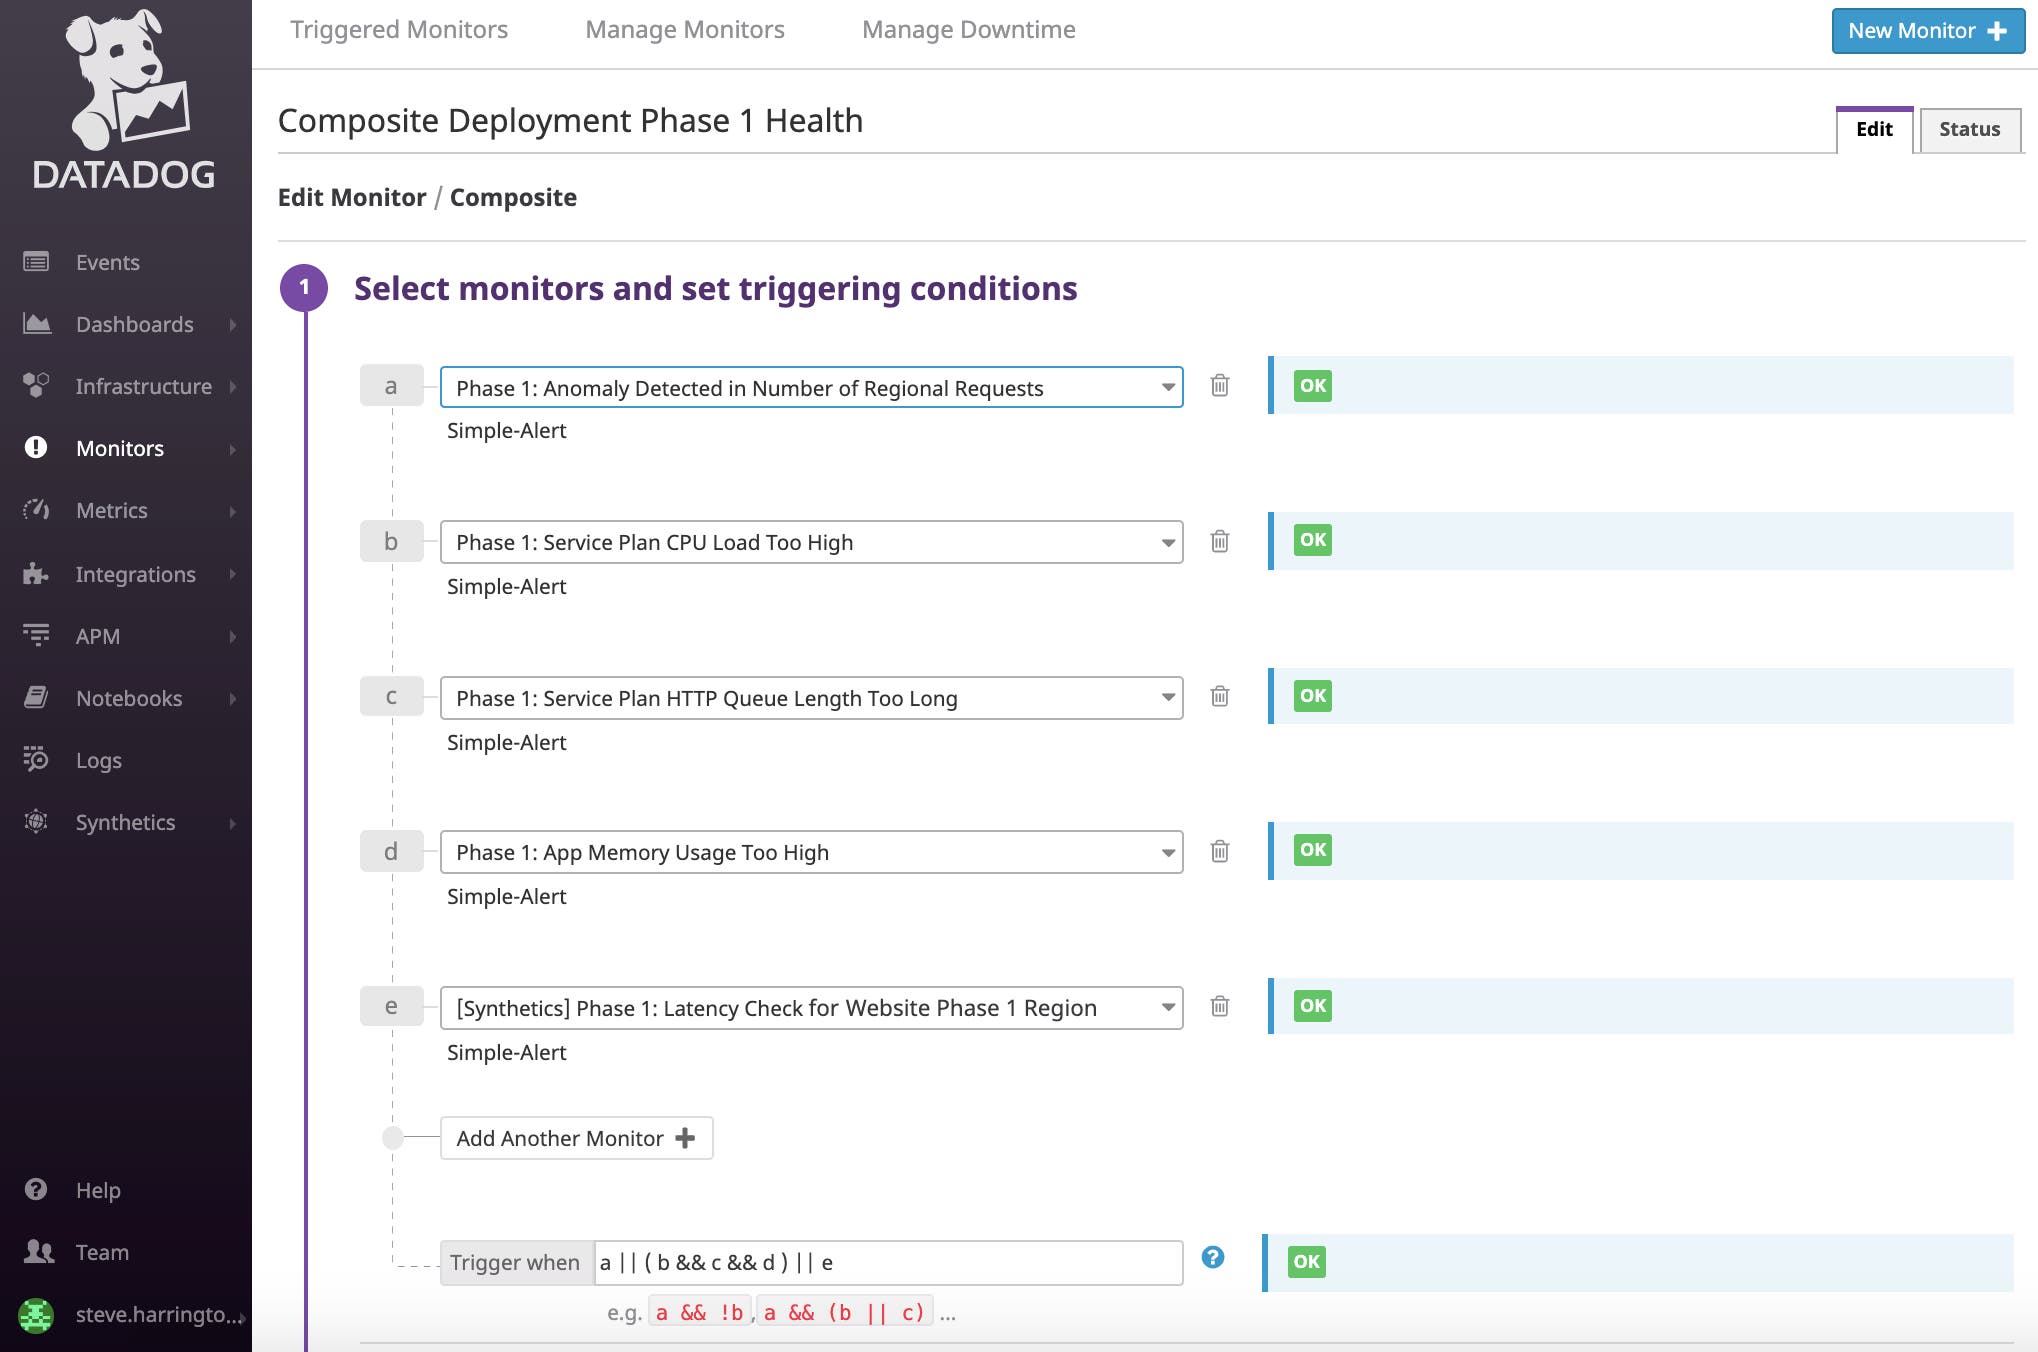
Then, in the example below, we configured a composite monitor that references this synthetic check along with other monitors for infrastructure metrics and anomaly detection. We then defined a rule for when this composite monitor should trigger based on the status of the individual monitors (i.e., when either the synthetic or anomaly detection monitor has triggered, or all three of the infrastructure monitors have triggered). By setting up a composite monitor for each phase of an ADM Rollout, you can utilize all of the relevant monitoring data you’re already collecting with Datadog and get more flexibility and control over defining your ADM health checks.
What to monitor and what thresholds define a “healthy” deployment step are highly dependent on the service and architecture in question. But broadly speaking, some monitors to consider are:
| Datadog monitor type | Possible triggers |
|---|---|
| Synthetics | Latency and timeouts at public-facing endpoints |
| Machine learning | Outliers and anomalies in relevant metrics |
| Metrics | Spikes in read/write latency, CPU/memory utilization, queue length, network throughput, replication lag |
| Logs | Increase in total errors, presence of specific types of errors |
| APM | Spikes in average, p90, or p99 latency; total number of errors |
| Events | Build failures, unexpected status changes |
For more advice and best practices on how to effectively monitor your environment, see our Monitoring 101 blog series.
Preparing your Datadog monitors for use with ADM Rollouts
Once you have your Datadog composite monitors set to track the health of your environment, you can add them into the health check steps of your ADM Rollout template. These templates will instruct ADM to use your Datadog monitors to evaluate the deployment’s health by querying the status of the appropriate composite monitor for each phase.
You may also want to consider applying tags to your monitors. As the number of monitors grows in your Datadog environment, this can be an effective tool for keeping them organized. For example, you can use a phase tag to quickly find the monitors that are related to a specific step of an ADM deployment. You can also use tags to correlate monitors with events and other data when building dashboards.
Below, in the Manage Monitors UI, you can see the status of a series of monitors we’re using to track the health of a deployment across two ADM health check steps, or phases. Each monitor includes a descriptive name and tags, so we can get instant context around how it fits into any specific ADM deployment.

Datadog provides documentation and a sample template for creating an ADM Rollout health check step using Datadog monitors.
Deploy safely with Azure + Datadog
Our partnership with Azure means that you can immediately start using Datadog to monitor your Azure Deployment Manager Rollouts along with the rest of your Azure environment. Review the docs to get started with this new integration today. If you’re not yet using Datadog, start a free 14-day trial.


