
Steve Harrington
Datadog Product Manager
With the growing number of customers monitoring Azure in Datadog, we saw a great opportunity to help our users get faster visibility across their dynamic cloud environments. We’re happy to announce the release of new out-of-the-box dashboards for several Azure services:
Azure DB for PostgreSQL: Fully managed PostgreSQL database as a service
Azure DB for MySQL: Fully managed community MySQL database as a service
Azure Blob Storage: Massively scalable object storage for unstructured data
Azure Table Storage: A NoSQL key-value store for rapid development using semi-structured data
Azure Queue Storage: Durable message queues for large-volume cloud services
Azure Service Bus: Cloud messaging as a service
We’ve also enhanced our existing template dashboard for Azure VMs to ensure that you continue to get critical visibility into your infrastructure. All of these dashboards are now available in your account if you've enabled our Azure integration.
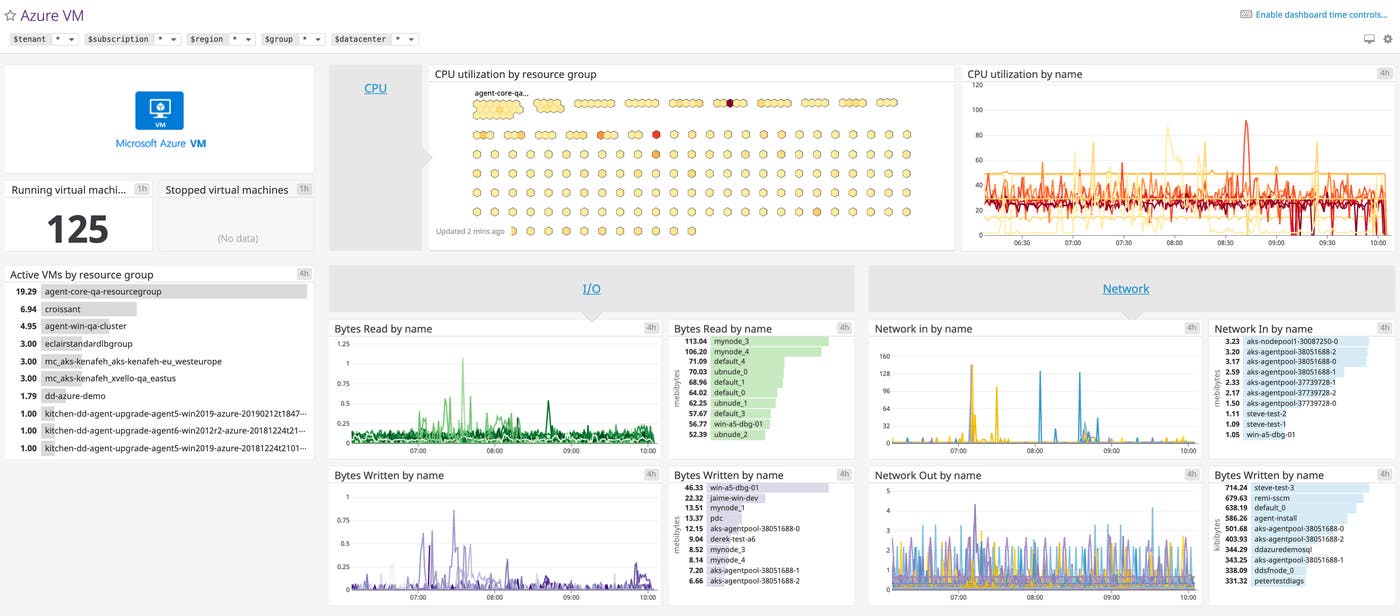
Exploring your Azure environment
Whether you're just getting started with dashboarding in Datadog or you already use dashboards every day, out-of-the-box dashboards are useful because they allow your team to:
Start viewing meaningful information about your services immediately
Identify a pre-selected set of metrics that are likely to be useful
Clone a template dashboard and add data from other sources to quickly build custom views of your environment
To see these new dashboards in action, just go to the Dashboard list from the main navigation bar of your Datadog account, and you’ll see them listed as “Preset” dashboards.
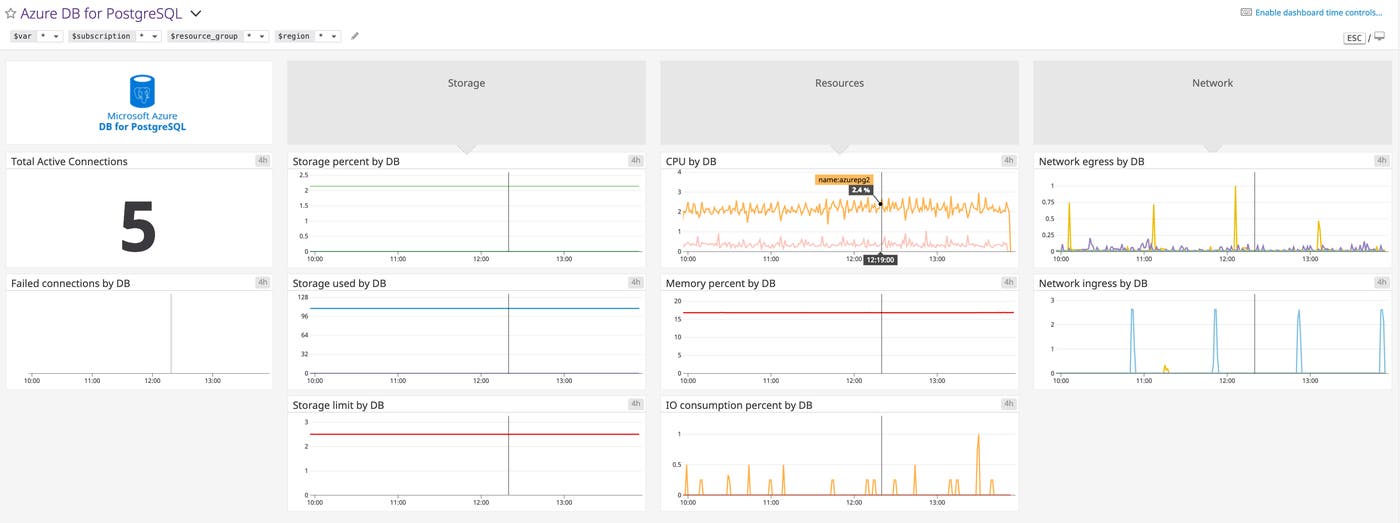
Each out-of-the-box dashboard displays an overview of key metrics collected from that particular service, so you can assess its health and performance in real time. For example, if you click into the dashboard for Azure DB for PostgreSQL below, you can see a structured view of active and failed connections, as well as timeseries metrics for storage, compute resources, and network traffic. You can then use default or custom tags to sort through or filter any of the charts. You can also utilize template variables at the top to scope down all of the visualizations to just the resources or services you’re interested in.
Getting more out of your Azure dashboards
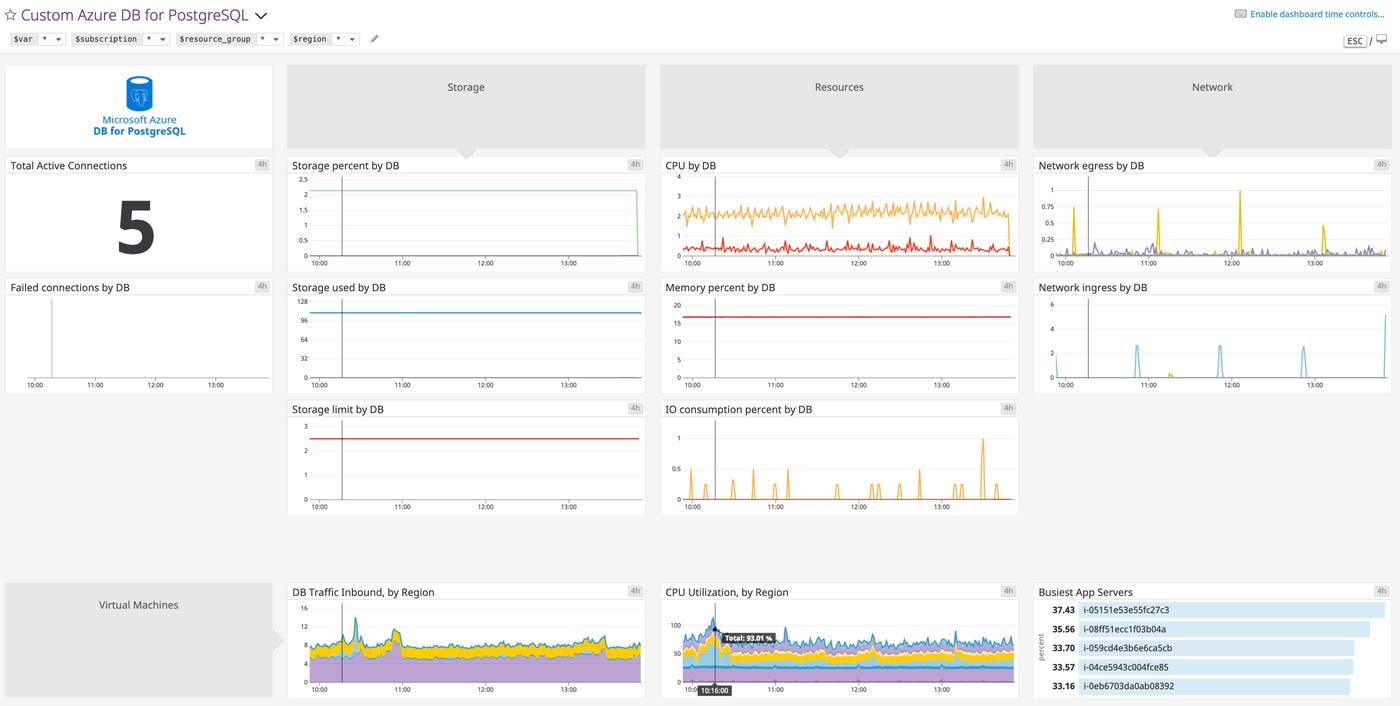
We designed these Azure dashboards to provide faster visibility into your services right out of the box, but you can get even more out of them by modifying them based on your setup. Simply click the upper-right corner of any dashboard to clone it, and customize it to include data collected from related services and/or infrastructure components.
For example, you can expand on the dashboard above to include metrics from a set of relevant Azure VMs. By including the hosts that run the applications making the requests to the database service, you can correlate what's happening in your infrastructure with what's happening in your application. The dashboard automatically scopes all the data to the same timeframe, so you can easily correlate metrics across resources.
All your Azure data in one place
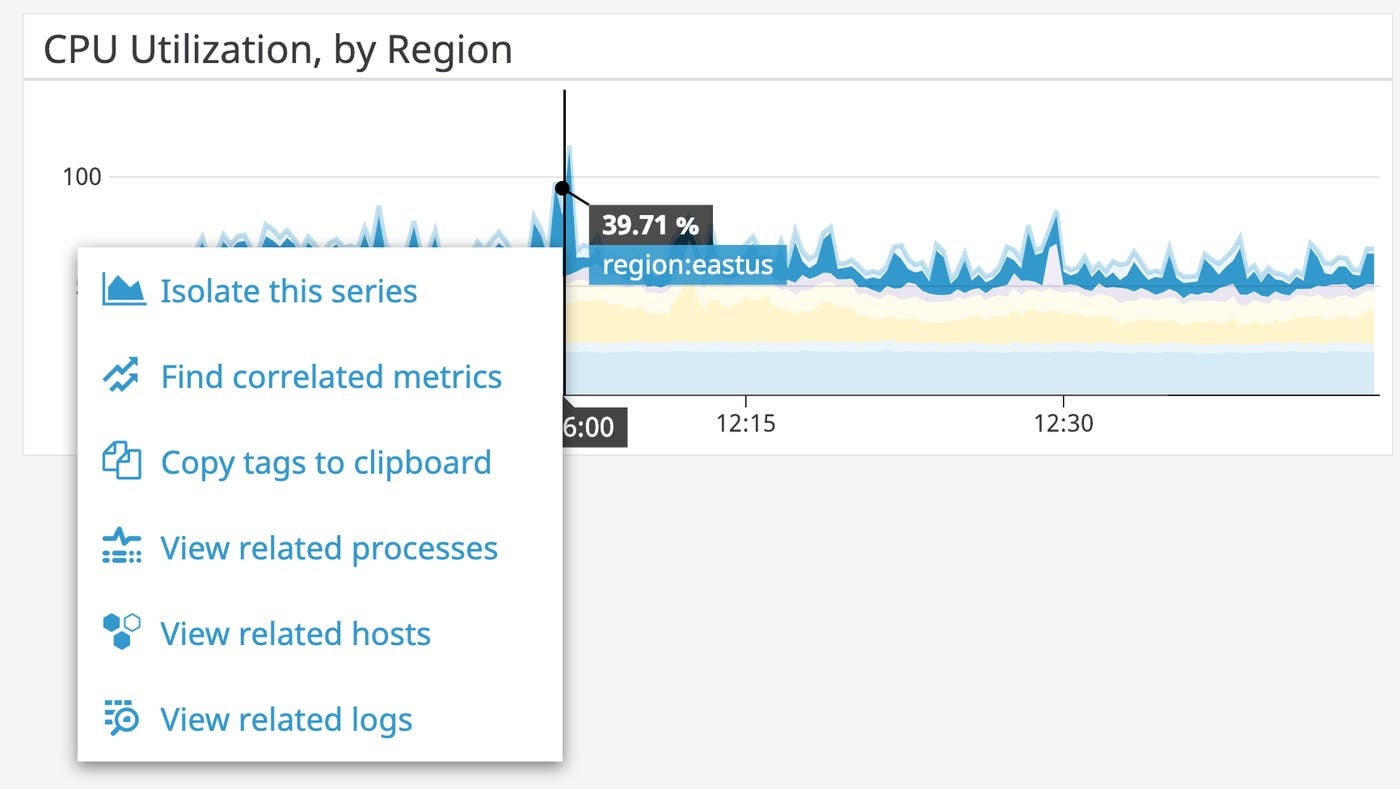
Datadog unifies metrics, distributed request traces, and logs in a single platform. This enables you to seamlessly navigate between all of these sources of data while maintaining the same context as you explore and troubleshoot.
If you spot a potential problem in one of your Azure dashboards, for instance, you can dive into the issue and access other relevant information such as metrics, logs, or traces collected from these and other related Azure services.
Start visualizing your Azure environment
We hope these new dashboards will provide comprehensive insights into the health of your Azure services—without any additional setup. If you have already set up the Azure integration, you can start exploring these Azure dashboards (along with more than a dozen others) right away. If not, follow the instructions here to get started.
If you're not yet using Datadog, you can start a free trial to get deeper visibility into your cloud infrastructure, applications, and services.
