Kassen Qian

Will McMullen

Bryan Lee
With the growing adoption of automated deployment tools, many organizations are releasing code more frequently. As releases increase, it’s important to ensure that you don’t accidentally introduce faulty deployments, which can have wide-ranging impacts on your infrastructure, application, and end-user experience, and can potentially lead to costly rollbacks. Controlled releases can help you address these challenges by enabling you to stagger your deployments and test functionality in isolated parts of your system before a wider release.
Deployment Protection Rules for GitHub Actions provides health checks for deployments to specific services or environments, so you can prevent faulty releases from spreading to your entire system. Datadog is proud to join GitHub as a launch partner for the public beta release of GitHub Deployment Protection Rules, making it easy to ensure that all your deployments are ready for production. With our integration, you can create Datadog monitors that perform automated checks on your gated deployments to assess any impacts to your services and application. By identifying potential performance issues and determining whether your infrastructure can support new releases, you can not only prevent faulty deployments from impacting your users but also gain insight into exactly how they might affect your system.
Assess the impact of new code across your stack
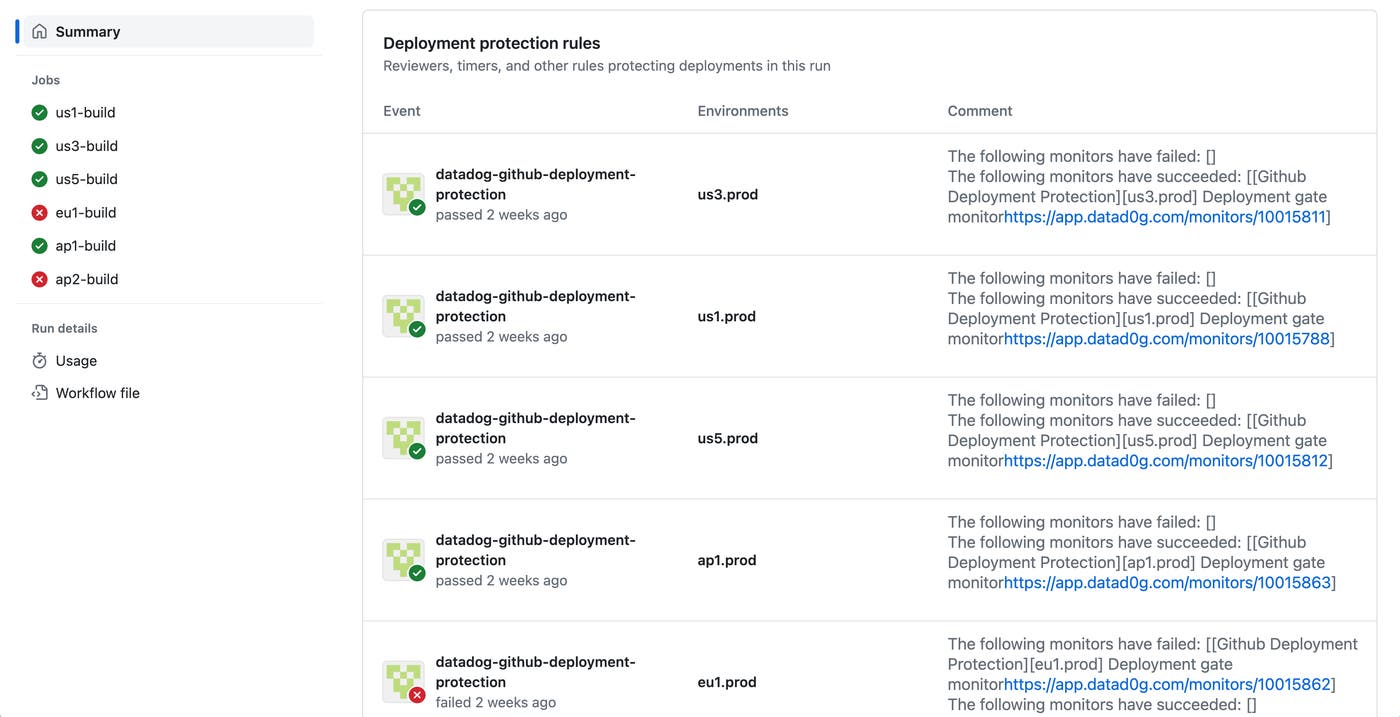
The key to a successful controlled release is being able to determine the status of your deployments and identify any issues quickly. With GitHub Deployment Protection Rules, you can ensure the health of your releases by using customized quality gates. Each gate consists of a series of tests that your deployment must pass. If one of these checks fails, the deployment is blocked from release in other environments and regions. You can use these tests to validate service health and resource consumption at every stage of your deployments, helping you to assess the performance of new code under real conditions.
When GitHub Deployment Protection Rules are combined with observability data from Datadog, you receive notifications for passed and failed checks, so you can determine exactly where issues in your stack occurred and troubleshoot them before releasing across all your environments. You can track not only application and infrastructure health, but any metric available with Datadog monitors for all of your GitHub deployments as well. Additionally, you’re able to pivot from a GitHub Deployment Protection Rules monitor to relevant metrics, logs, and traces throughout the Datadog platform to pinpoint where and how new code is affecting your services.
Create Datadog monitors to gate GitHub Actions deployments
You can leverage GitHub Deployment Protection Rules in Datadog by creating monitors that immediately notify you when issues are detected in a certain environment or service. Whenever a GitHub-based deployment is triggered, these monitors return strings to GitHub that indicate a pass or failure of the relevant tests. You then receive a notification of the Datadog responses and can view a detailed overview of the results alongside your deployments in GitHub, with links to jump to the monitors in Datadog. Note that you must have Deployment Protection Rules enabled for any GitHub applications connected to Datadog.
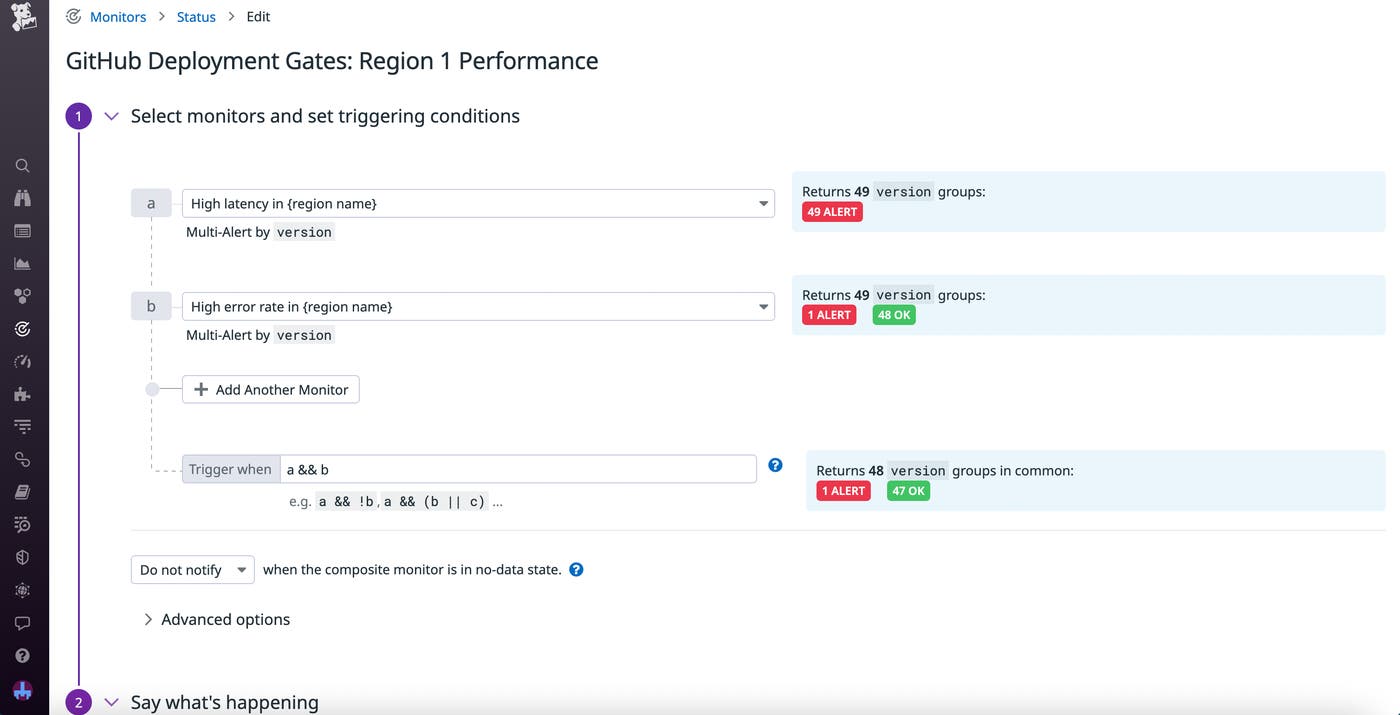
With these features, you can create monitors that are uniquely tailored to your deployment checks. The type of monitor you create for these purposes will depend on the data you want to analyze. For example, let’s say you’re performing canary testing for your latest release, and you want to set up a monitor that sends you an alert when a deployment results in degraded application performance within a specific region. In this case, you could combine individual latency and error metric monitors into a composite monitor that checks for signs of performance issues within a particular region (shown in the screenshot below).
To indicate that you want a monitor to be used for gating, simply add the git_env and git_repo tags to it. In order to uniquely identify the repo, the git_repo tag’s value must contain the owner and repository name (e.g., owner/git_repo). For composite monitors, you can also set trigger conditions that define thresholds for alerting—for example, do you want to be notified when one monitor fails or only when all of them do?
Organize and analyze your deployment checks
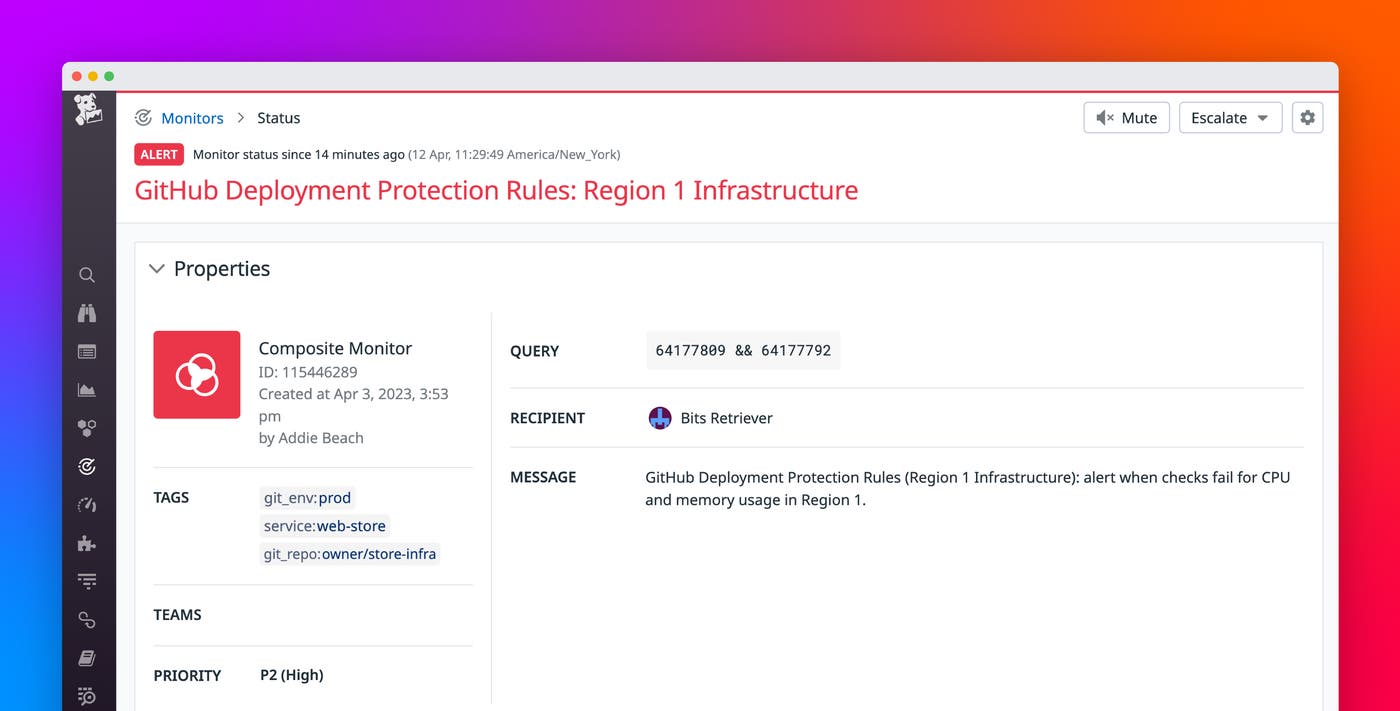
When you receive an alert from a Datadog monitor configured to work with GitHub Deployment Protection Gates, you can quickly start troubleshooting using Datadog. By adding tags to your monitors, you’re able to organize them and easily determine which resources were included in the checks. In addition to the mandatory environment and repository tags, you can also apply a phase tag to filter your monitors based on which deployment check failed.
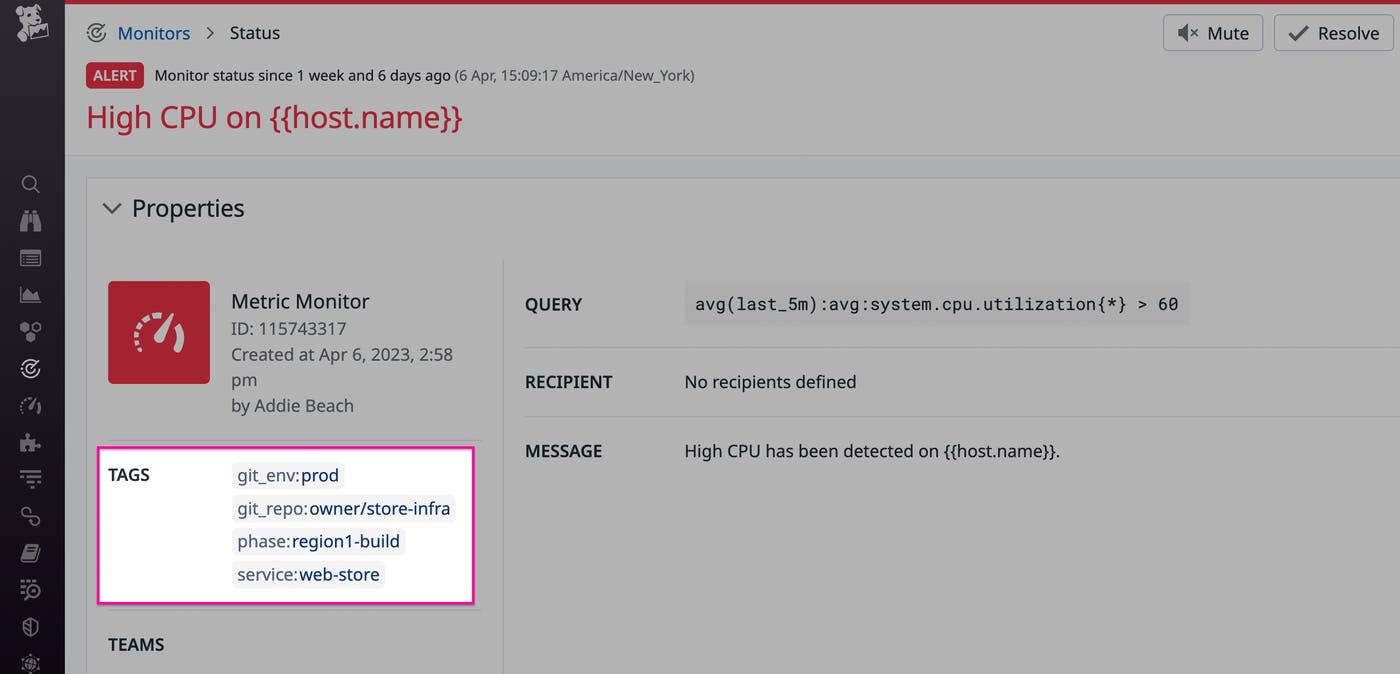
For further troubleshooting, you can quickly pivot from a GitHub Deployment Protection Rules monitor to other investigation tools in Datadog. For example, let’s say you’ve set up a single metric monitor to watch for high CPU consumption during your gated deployments (shown in the preceding screenshot). When you receive an alert that this monitor has been triggered, you can copy the tagged service on the monitor and view it in Service Catalog. Here, you notice that this service frequently runs low on memory and, after further investigation, you determine that it is underprovisioned. You can then build out your infrastructure with additional resources to ensure that your deployments are supported.
Deploy safely with GitHub and Datadog
With the GitHub Deployment Protection Rules and Datadog integration, you can easily troubleshoot faulty deployments and prevent them from affecting the end-user experience. Simply configure customized monitors to notify you as soon as a gated quality check fails, then leverage Datadog investigation tools to figure out what went wrong.
To get started with Datadog’s integration for GitHub Deployment Protection Rules, use our documentation. Or, if you’re not yet a Datadog user, you can sign up for a 14-day free trial today.
