
Cody Murray-Bruce
Product Marketing Manager
Running AI applications on Microsoft Azure requires visibility into many parts of the tech stack. A slowdown, for example, might originate from Azure OpenAI rate limits, from an agent repeatedly calling a tool, or from slow database queries. Engineers need visibility into all those aspects of the application to pinpoint the right cause. Engineers also need visibility into how these various dimensions of AI workloads affect cloud spending.
At Microsoft Ignite 2026, Datadog is announcing expanded Azure monitoring coverage with 55 additional integrations for Azure Monitor services. We’re also introducing capabilities for analyzing Microsoft Foundry spending, tracking Azure commitments, and monitoring Azure Blob Storage usage by container.
In this post, we’ll explore how Datadog helps you:
Monitor models, agents, and AI applications on Azure
Datadog provides visibility into Azure AI workloads across the entire stack, from model requests and agent execution to the data services and infrastructure they depend on.
Detect Azure OpenAI performance issues
Azure OpenAI deployments can experience rate limits, capacity constraints, and elevated latency that affect application performance. The Datadog integration for Azure Cognitive Services includes an out-of-the-box (OOTB) dashboard and recommended monitors for identifying these issues.
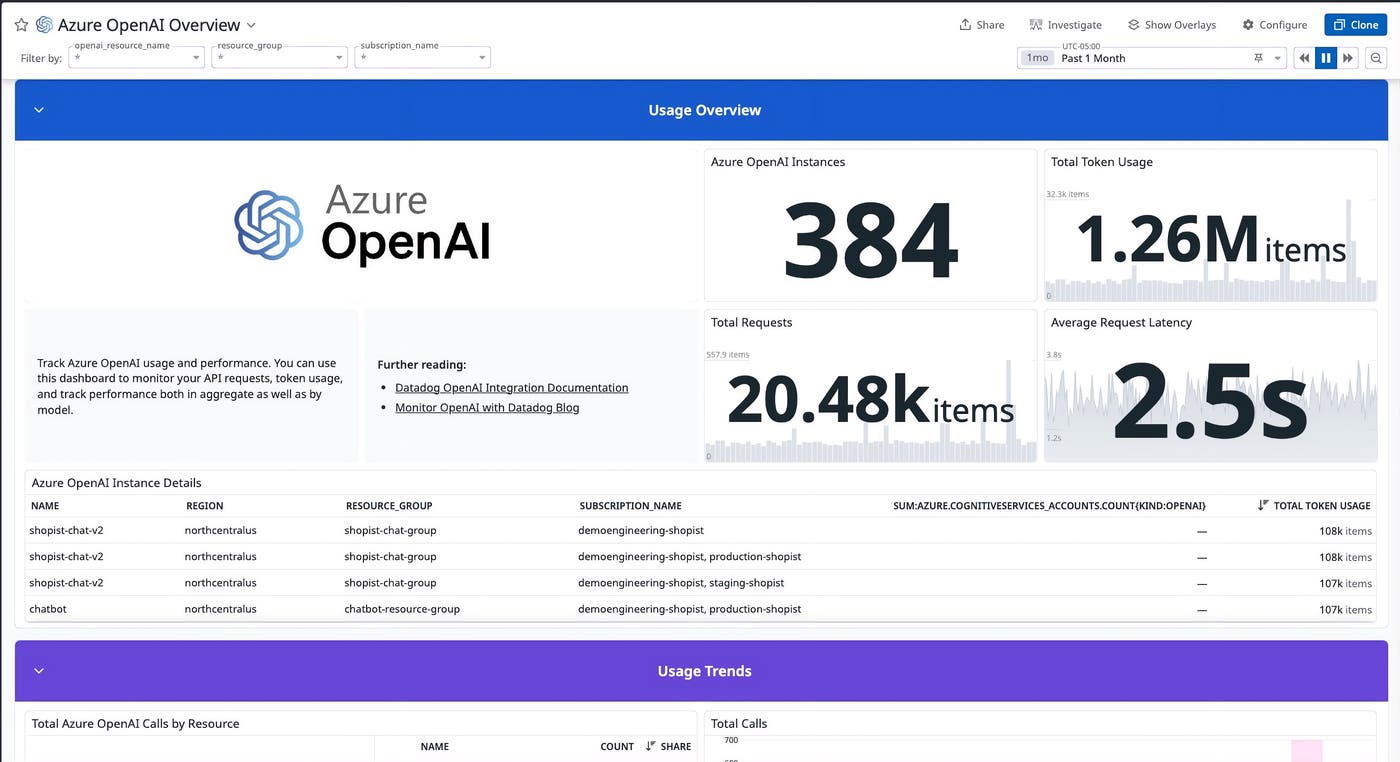
For example, you can monitor azure.cognitiveservices_accounts.blocked_calls to detect requests rejected because of rate limits. Recommended monitors also alert when provisioned Azure OpenAI deployments exceed 100% capacity, more than 10% of calls fail, or latency rises.
The Azure OpenAI dashboard also includes prompt and response token volumes, helping engineers identify workloads contributing to model usage and inference costs.
Investigate agent behavior and data dependencies
AI agents introduce performance issues that model metrics alone cannot explain. An agent might repeatedly call a tool, retrieve irrelevant information, or fail to complete a task.
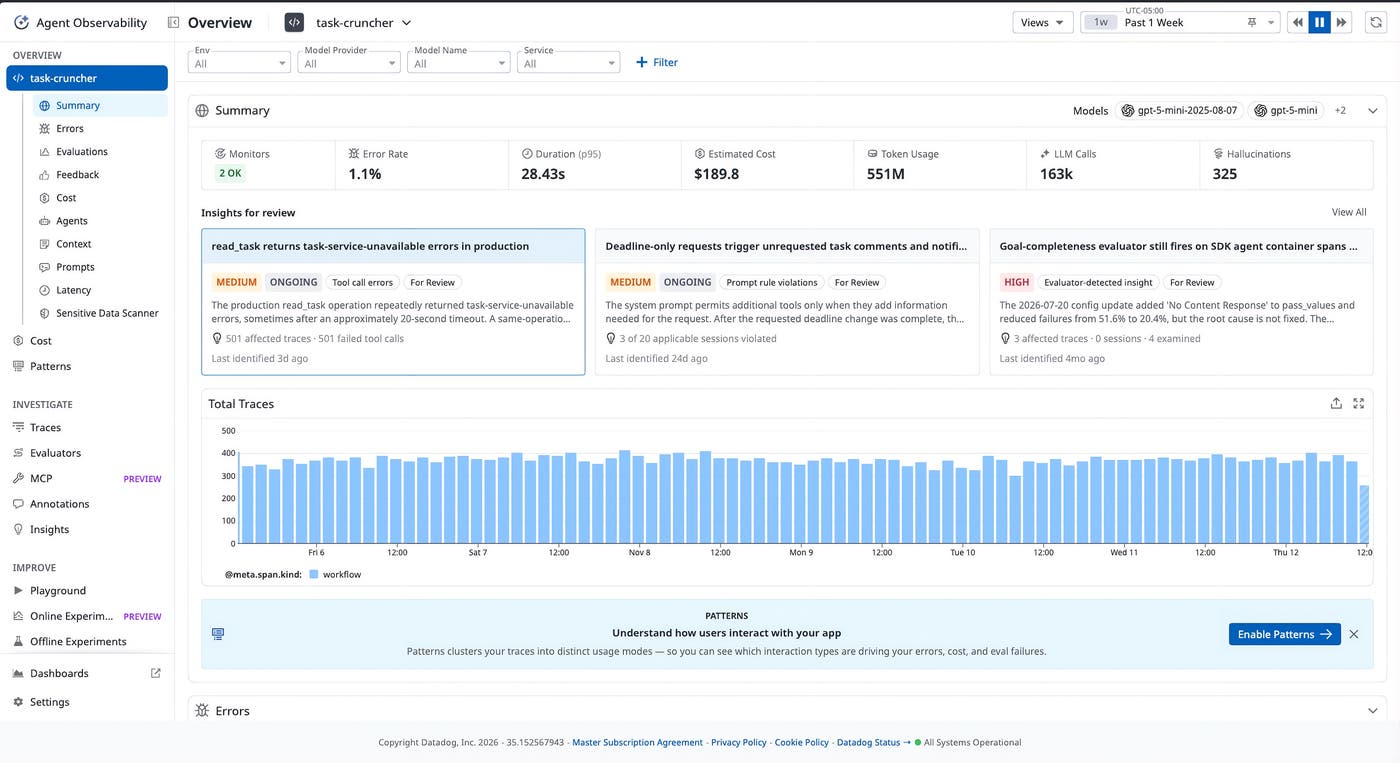
Datadog Agent Observability traces conversations, LLM calls, tool executions, and retrieval steps. Engineers can investigate individual sessions alongside metrics such as error rate, p95 duration, estimated cost, and token usage. The Summary view also surfaces insights that warrant attention. For example, the image below shows repeated errors from a tool that reads tasks.
Datadog also monitors the data services behind these agents. Foundry IQ, the knowledge layer for Foundry agents, runs on Azure AI Search. Datadog’s Azure AI Search integration includes a recommended monitor for elevated search latency, which can slow the retrieval of information that Foundry agents need. Dashboards and monitors available through the Cosmos DB for MongoDB vCore integration (e.g., a monitor that fires when storage exceeds 90%) and the Azure Redis Cache integration (e.g., a monitor that fires when memory exceeds 90%) cover the databases behind them. Datadog Database Monitoring also provides query-level visibility into PostgreSQL and MySQL workloads.
Agent Console, available in Preview, tracks usage, cost, and latency across coding agents such as GitHub Copilot and Datadog Bits AI agents. Datadog GPU Monitoring provides visibility into GPU utilization and idle capacity across Azure and other clouds, as well as on-premises environments.
Understand and manage Azure costs
Datadog Cloud Cost Management (CCM) helps engineering and FinOps teams investigate spending changes and understand which workloads contribute to Azure and AI costs. FinOps is also on the Ignite agenda this year, including Microsoft’s sessions on operating AI at scale with Foundry.
Analyze Microsoft Foundry spending and Azure commitments
CCM brings Microsoft Foundry spending into its AI Costs view alongside providers such as Anthropic and OpenAI. Teams can analyze spending by provider, model, and user to identify where costs originate.
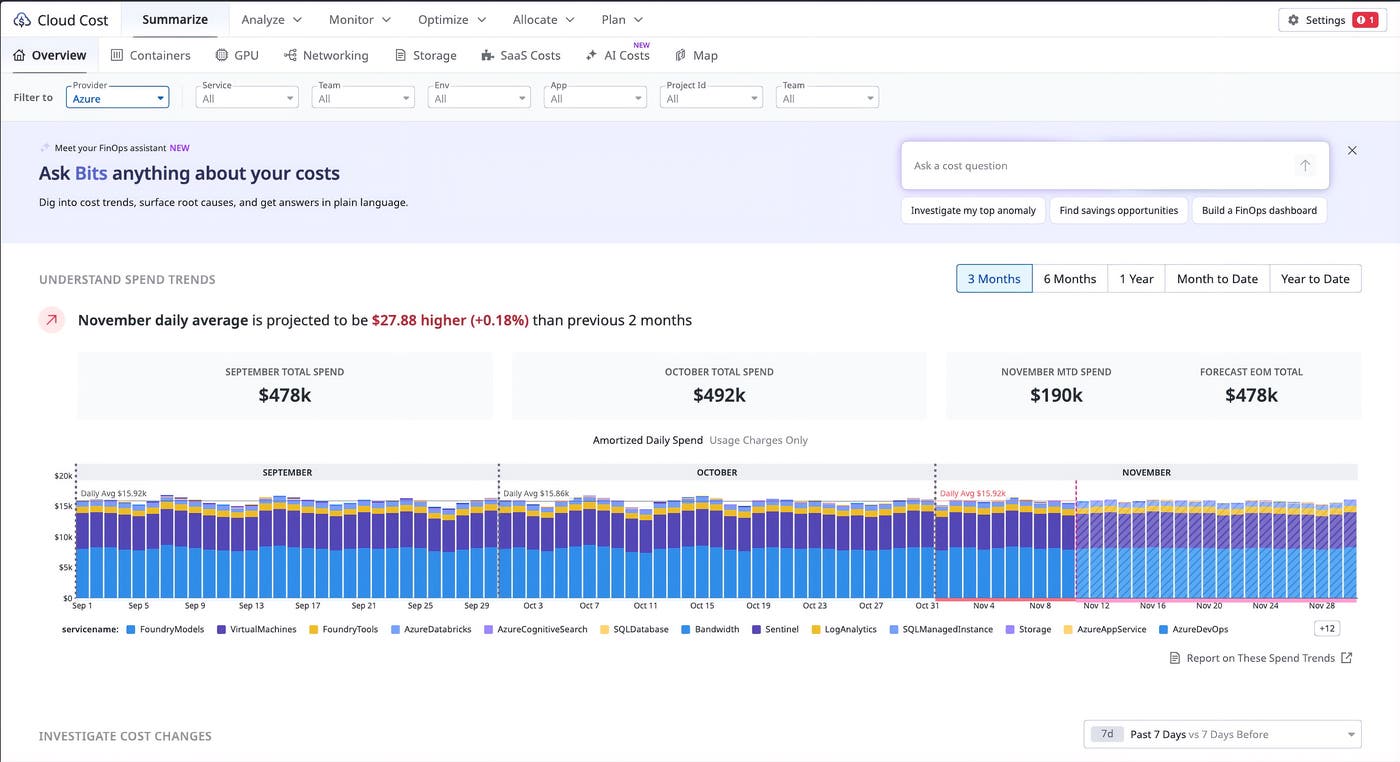
The AI Costs view lets teams focus on model spending and compare costs across periods. Engineers can filter by provider, model, and resource group to investigate specific workloads.
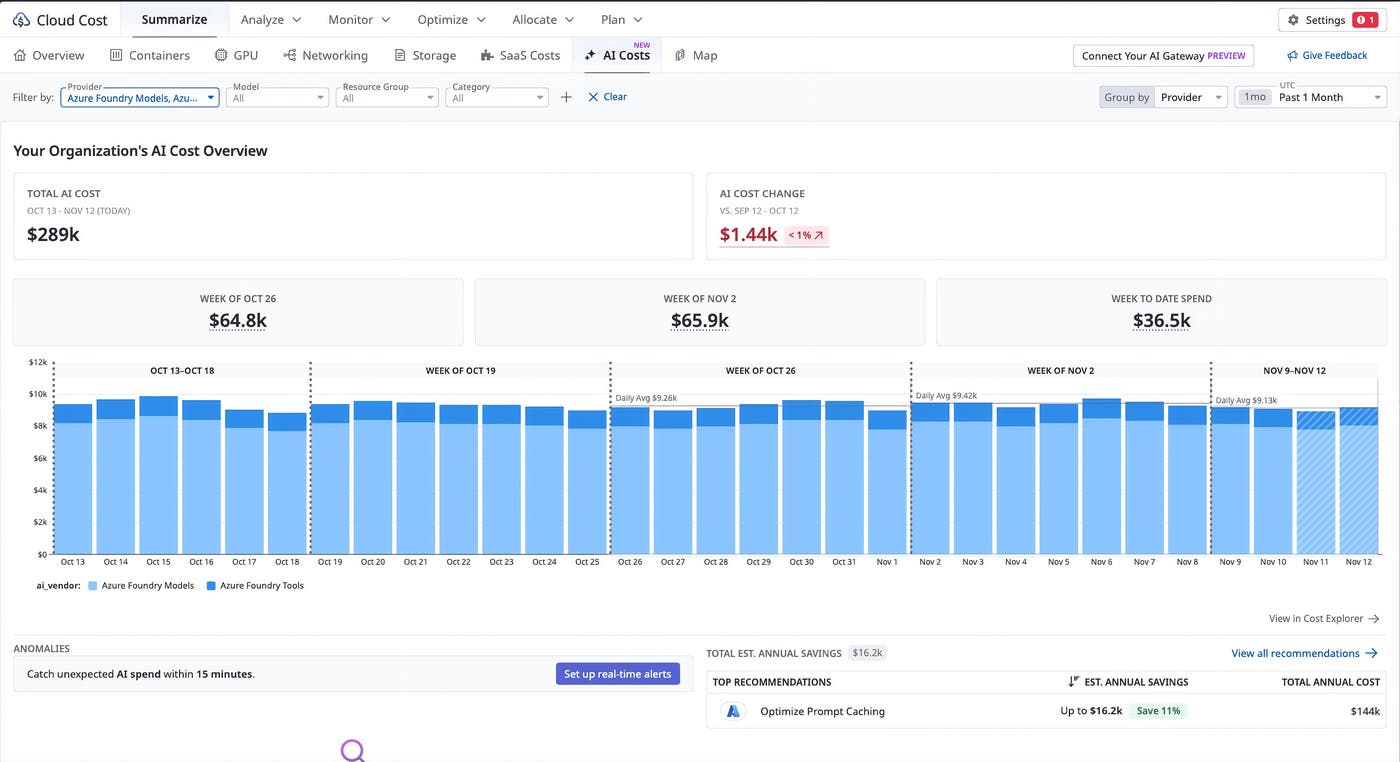
The AI Costs view shows total AI spending and how it compares with the previous period. When spending changes, select View in Cost Explorer, then choose Azure Foundry to open the Cost Change Summary, which identifies the teams and tags associated with the change. Engineers can select Ask Bits to investigate the increase, then create a notebook, monitor, or report from the analysis. Teams can also ask Bits Chat about cost-related issues, for example, which Azure services are driving spend this month compared with last month.
CCM also consolidates Azure commitment programs, including Savings Plans, Reserved Instances, and Databricks prepurchases. Teams can track these commitments alongside their broader Azure spending.
Datadog Observability Pipelines now offers a generally available Azure Data Explorer destination that sends logs directly to Azure Data Explorer, with no extra hop through Azure Event Hubs. Teams on the Microsoft stack can parse, normalize, and enrich logs once in their own infrastructure, then use templates to route each one to the right table. Logs then arrive structured and ready to query with Kusto Query Language (KQL).
From the same pipeline, you can send each log to its appropriate destination:
Detections go to Microsoft Sentinel.
Analytics for long-term retention go to Azure Data Explorer.
Operational data goes to Datadog, where you troubleshoot and alert on it in real time.
See which containers drive your Azure Blob Storage costs
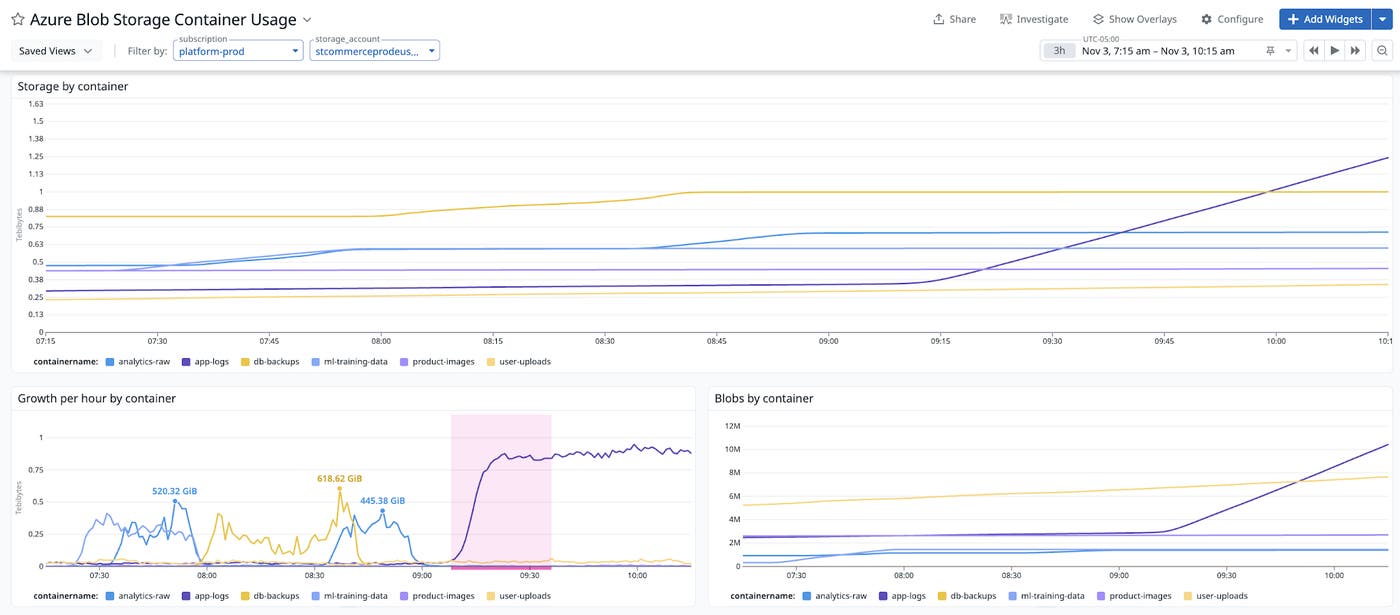
A growing Azure bill is hard to act on when you can’t tell what is causing the growth. Before now, Azure Monitor reported Blob Storage usage only for the whole storage account, so you could see costs rise but not which container, and so which app or team, was responsible. With Azure Monitor advanced platform metrics, Datadog now shows usage and blob counts for each container, so you can find the source of growth and catch unusual increases before the bill arrives.
After you enable advanced platform metrics in Azure, Datadog collects them through the existing Azure integration. Engineers can use these advanced metrics to:
Find the source of growth: Rank containers by size and recent growth to see which one is driving costs.
Account for retained data: Remember that previous blob versions and soft-deleted objects keep consuming capacity, even when the data your app uses stays the same size.
Alert early: Monitor
azure.storage.container_blob_capacityby container, or use a forecast monitor to be alerted before a container crosses a threshold.
In the dashboard below, the app-logs container starts growing at about 09:10, adding close to 900 GiB per hour while the other containers stay comparatively flat, and its blob count climbs past 10 million. That’s the container to investigate first, and overlaying deployment events can show whether the jump coincided with an application change.
Monitor more Azure services with expanded coverage
Datadog is adding 55 integrations that provide broad coverage of Azure Monitor services, including OOTB dashboards and recommended monitors. The expanded coverage spans AI, databases, compute, networking, storage, security, and hybrid infrastructure.
These integrations build on metrics collected through the Datadog Azure integration. They help engineers identify service-specific problems across AI applications and traditional workloads.
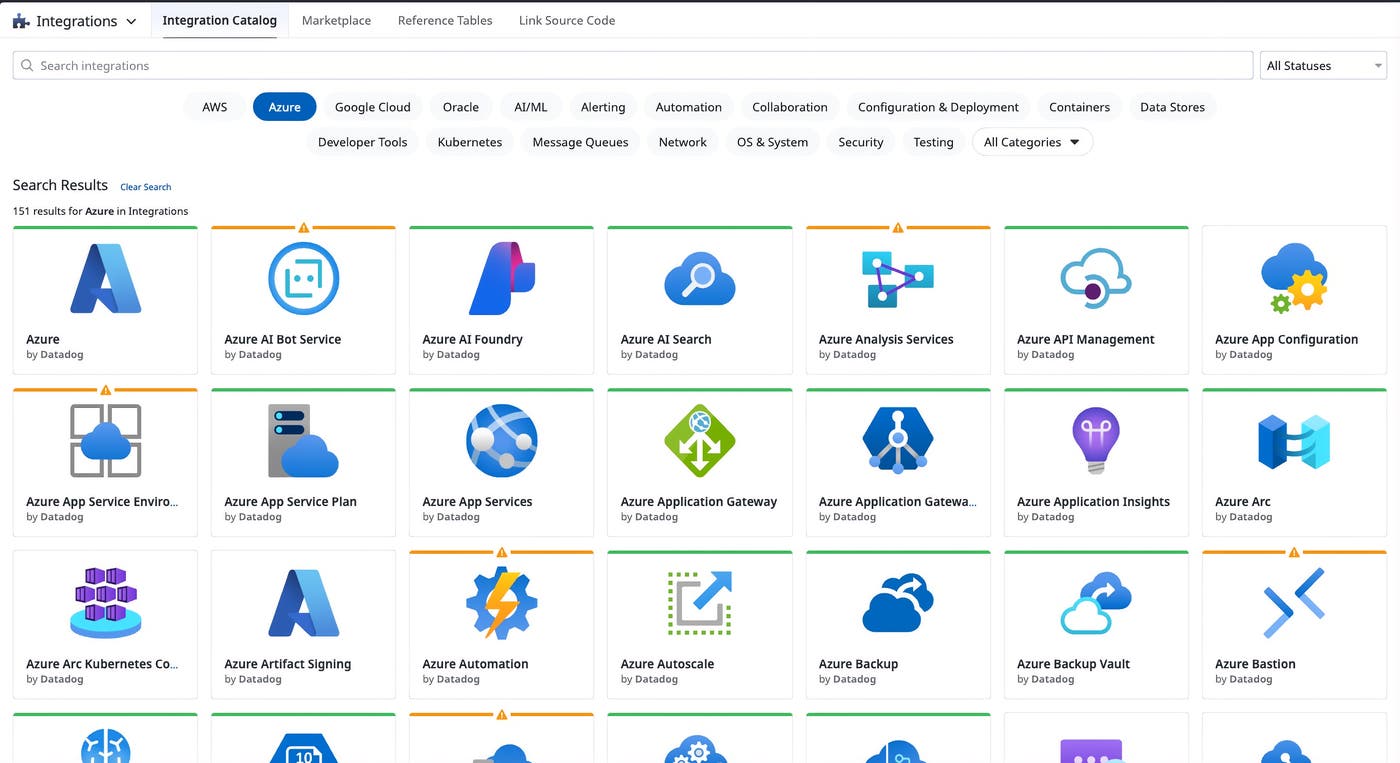
The following table shows examples of the expanded coverage:
| Category | Example services | What you can monitor |
|---|---|---|
| AI and machine learning | Azure OpenAI, Azure AI Search, Azure Machine Learning | Rate limits, request errors, search latency |
| Compute and hosting | Azure Kubernetes Service (AKS), App Service, Azure Functions, Container Registry | Unavailable nodes, queued requests, scaling issues |
| Databases and storage | Cosmos DB for MongoDB vCore, Redis Cache, Managed Disks | Storage capacity, memory utilization, backup failures |
| Messaging and analytics | Service Bus, Event Grid, Data Factory, Synapse | Message backlogs, delivery failures, pipeline errors |
| Networking and security | Application Gateway, Front Door, Azure Firewall, Key Vault | Unhealthy backends, connectivity, service availability |
| Hybrid and edge | Azure Arc, Azure Local, Azure VMware Solution, IoT Hub | Disconnected resources, utilization, message delivery |
Datadog also supports monitoring Oracle AI Database@Azure. Additional capabilities in Preview include Serverless Monitoring for Azure Logic Apps and Deployment Slots, alongside an Azure App Insights integration.
Investigate and resolve issues across Azure
Datadog combines infrastructure monitoring with AI-assisted investigation and automation to help engineers operate Azure and on-premises workloads.
The Azure Overview dashboard summarizes resource health, while Cloudcraft generates architecture diagrams from Azure resources. Engineers can also use the Host Map to examine infrastructure across cloud and on-premises environments.
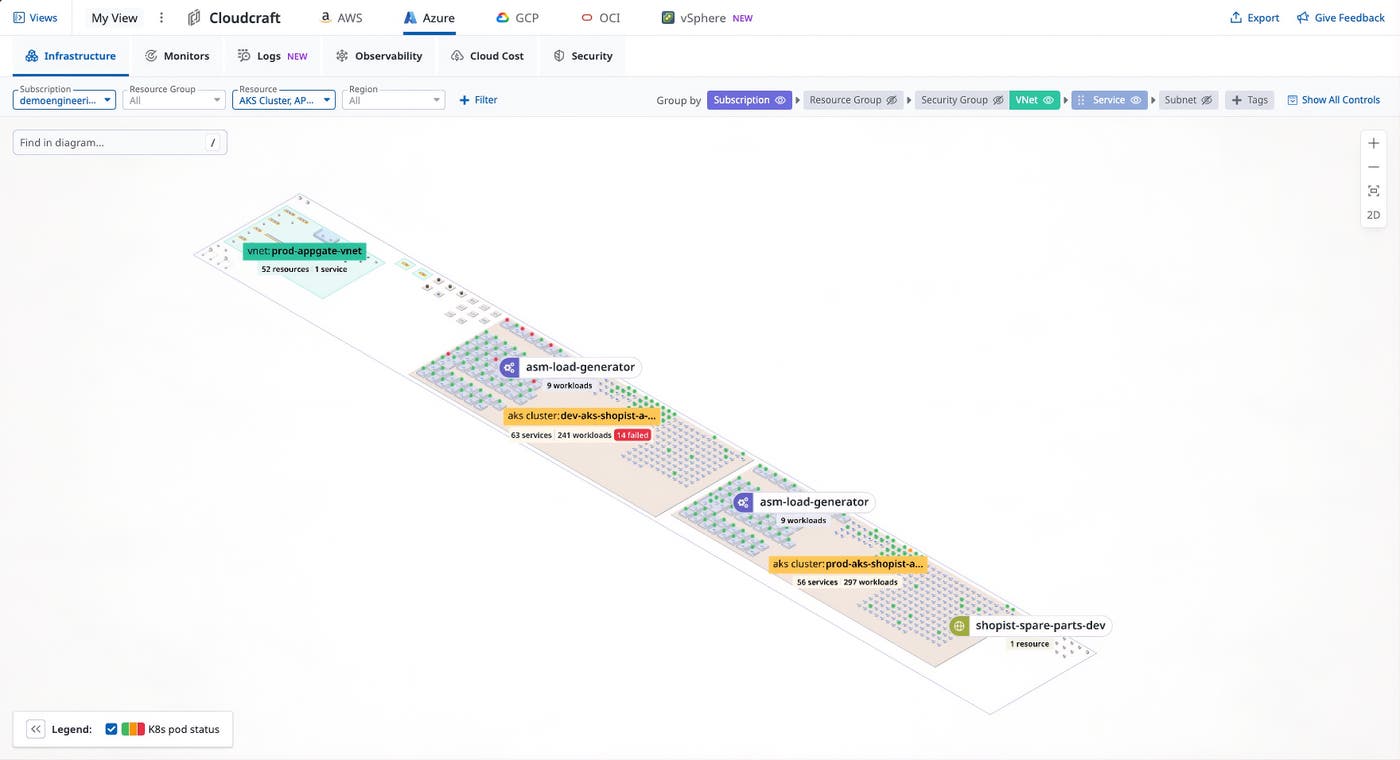
For Windows-heavy environments, the PowerShell integration extends monitoring capabilities. Datadog Infrastructure Basic provides another monitoring option for legacy and lower-tier workloads.
Investigate alerts and automate operational tasks
Bits Chat helps engineers investigate infrastructure issues by using context from Datadog. For example, an on-call engineer can ask which Azure monitors are alerting and which issue to investigate first.
Bits Agent Builder enables teams to create custom agents for tasks such as summarizing dashboards, logs, and incidents. Support for Azure and Microsoft Teams tools lets teams incorporate these systems into operational workflows.
Datadog Workflow Automation can execute predefined remediation actions when problems are detected. Bits infrastructure actions can also remediate certain Windows Server host issues, a capability available in limited availability. With automatic approval disabled, users retain control over which actions Bits executes.
Get started with expanded Azure monitoring
Datadog supports more than 1,000 integrations, including over 100 for Azure services. To get started, explore the Azure solutions page and follow the Azure integration documentation.
If you’re attending Microsoft Ignite 2026, visit Datadog at booth #5235R in San Francisco’s Moscone Center, November 17–20. You can also attend “Trace, evaluate, and ship reliable AI agents” on November 19, from 13:40 to 14:05 PT. The session takes place in The Hub, Theater C, at Moscone South.
And if you’re new to Datadog, sign up for a 14-day free trial to start monitoring your Azure environment.
