
Sharon Ye
Senior Product Manager

Milene Darnis
Senior Product Manager

Adam Virani
Product Marketing Manager
With every feature launch, you create a new dashboard. As your product grows, so does the number of charts you need to watch. But when you’re responsible for 10 features, reviewing every dashboard every day isn’t realistic. The dashboards for your latest launches often get the most attention at first, then gradually fall out of your routine. A conversion drop might go unnoticed for weeks, and by the time someone catches it, the engineering team has moved on and the context needed to investigate is harder to recover.
Datadog Product Analytics helps you follow product performance with AI-powered reporting and root cause analysis. The Dashboard Reporter Agent monitors your dashboards and delivers the insights that need your attention directly to Slack, Microsoft Teams, or email. When something looks off, you can ask Bits AI to investigate and get an explanation grounded in user behavior, session replays, and frontend errors.
In this post, we’ll show how you can:
Let your dashboards tell you what needs attention
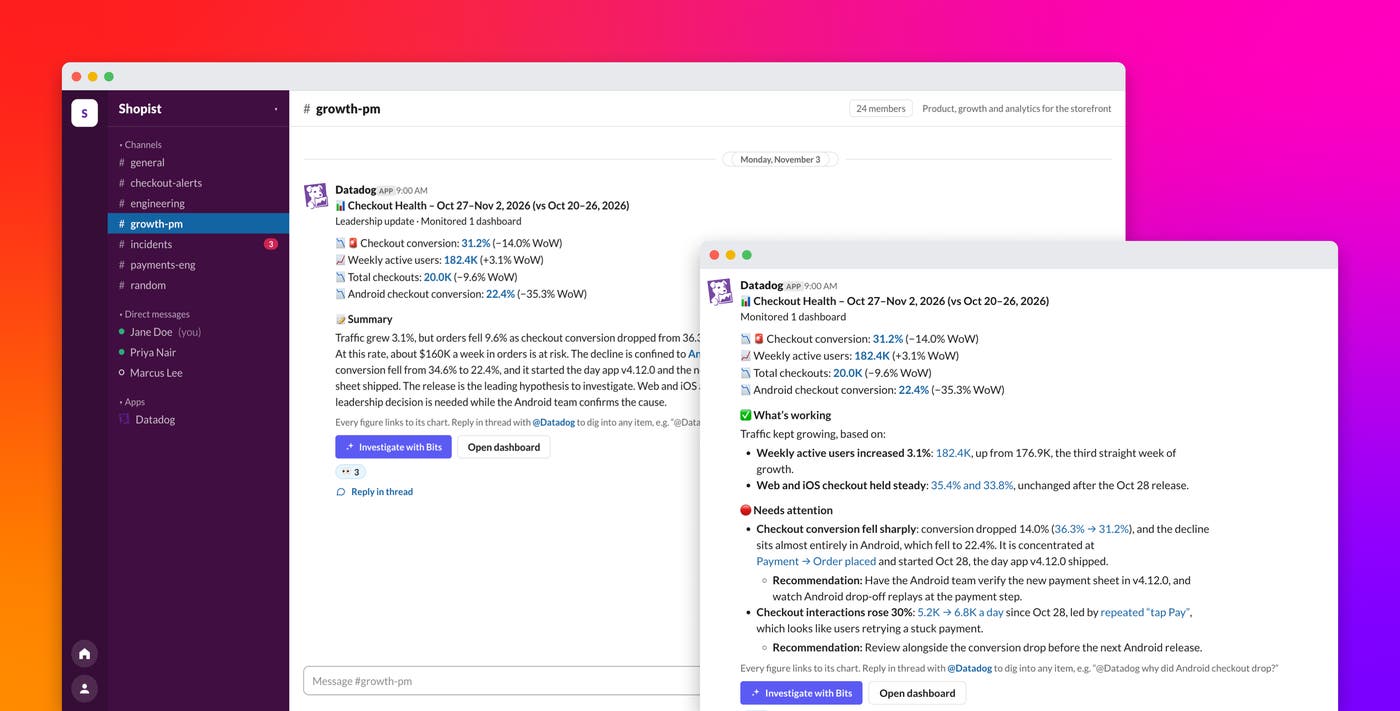
The Dashboard Reporter Agent turns your Product Analytics dashboards into proactive updates about how your features are performing. Instead of remembering to check every dashboard, you can subscribe multiple dashboards to a single agent and receive recurring reports that highlight the changes worth knowing about.
Imagine you’re managing several feature launches, each with its own dashboard tracking adoption, engagement, and conversion. Every week, the agent reviews the charts across those dashboards and sends you a report with a consistent set of key performance indicators (KPIs) and their week-over-week changes. You can follow the same metrics over time, even as your attention shifts between different projects.
The agent also decides what deserves a closer look. A conventional dashboard report sends the same charts every week and leaves you to work out what changed; the Dashboard Reporter Agent highlights meaningful trends, potential regressions, and opportunities instead. If nothing significant changed, it tells you that, too.
For example, a weekly report might flag a rise in feature adoption alongside a drop in checkout conversion. The adoption increase could point to a change worth expanding, while the conversion drop might indicate friction worth investigating. Surfacing both together shows you what’s working as well as what needs fixing.
Every finding links to the underlying chart in Product Analytics, so you can verify the data and explore further.
Keep your whole team informed about product performance
Product managers aren’t the only people who need to know how a feature is performing. Engineers need to know when a launch introduces friction, designers want to see how users respond to changes, and product leaders need to track progress against KPIs. But those stakeholders don’t necessarily use Product Analytics every day, so keeping them informed often falls to the product manager, who must interpret the data and summarize it for each audience.
With the Dashboard Reporter Agent, a weekly update can arrive directly in your team’s Slack channel. Instead of waiting for a product review meeting or asking a product manager for the latest numbers, teammates can see which KPIs are moving, what’s going well, and where the team needs to focus.
You can also tailor reports to each audience. After a checkout redesign launches, for example, the team update might list the KPIs that moved, what’s working, and what needs attention, while the leadership update gives a short read on whether KPIs are on track. Custom prompts let you specify the questions that matter to each group.
Reports can arrive daily, weekly, or monthly through Slack, Microsoft Teams, or email. The agent keeps monitoring every subscribed dashboard, including the ones for past launches. And when a report flags a problem, the next step is in the same thread.
Ask Bits AI why something changed, right from Slack
A report might tell your team that checkout conversion declined over the past week, but not whether the cause was a technical failure, a confusing UI change, or a shift in the users arriving at checkout. When the Dashboard Reporter Agent flags a drop like that, Bits AI can help you find the cause.
You can continue the conversation in Slack by asking Bits AI to investigate the finding. For example, you might ask, @Datadog investigate the drop in checkout conversion rate. Bits AI uses the context of the reported issue and brings together product behavior data and technical signals.
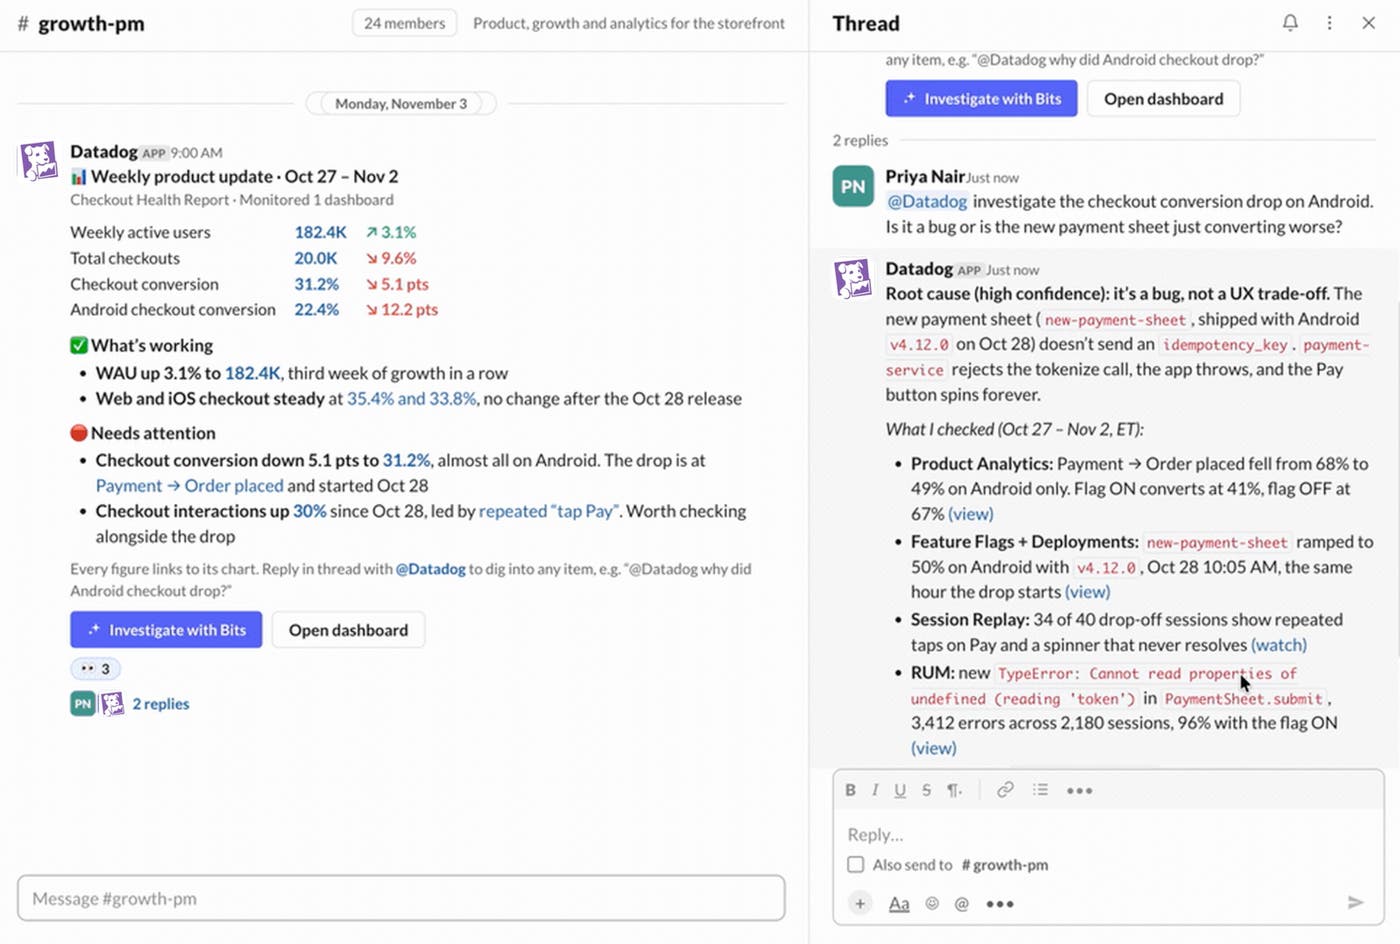
Each signal answers a different question. Funnel data tells you where users abandon a flow, but not what they experienced before leaving. Session Replay can reveal frustrating interactions, but finding the relevant sessions manually can take hours. Real User Monitoring (RUM) can identify frontend errors, and release and feature flag context can connect a behavioral change to a product update.
Bits AI can examine these signals together to narrow down the cause. It can also help determine whether the drop is a genuine product issue or something else, such as an instrumentation problem or a change in traffic composition.
Consider a checkout conversion drop that appears after a promotional campaign launches. On the overall conversion chart, you might suspect the campaign attracted users who were less likely to purchase. Investigating with Bits AI could reveal a different explanation: The decline is concentrated among mobile users arriving from that campaign, and session replays show a promotional banner on the payment screen obstructing the checkout button on smaller viewports.
Instead of manually filtering funnels, searching session replays, and comparing errors, the team gets a likely cause with the evidence behind it. Bits AI can summarize the affected user count, estimate the business impact when possible, and link to relevant charts and session replays, so the team can decide what to fix and how urgent it is.
Because Product Analytics, Session Replay, RUM, and Feature Flagging and Experimentation are part of the Datadog platform, Bits AI can investigate product behavior alongside the technical signals that help explain it, without anyone switching between separate tools.
You can start the same investigation from a Product Analytics chart, a conversion rate monitor alert, or a degraded journey in Journey Monitoring.
Catch product issues sooner with Datadog Product Analytics
The Dashboard Reporter Agent helps your team catch conversion drops and other regressions before they go unnoticed for weeks, and Bits AI helps you find the cause.
To get started, see the Dashboard Reporter Agent documentation, then subscribe your most important feature dashboards to a Dashboard Reporter agent and deliver the updates to your team’s Slack channel. You can also learn more about investigating conversion drops with Bits AI.
If you don’t have a Datadog account, sign up for a 14-day free trial to start monitoring product performance with Product Analytics.
