

Addie Beach
Technical Content Writer

Quentin Golsteyn
Senior Software Engineer

Constance Rousseaux
Manager I, Engineering
When designing effective error handling for React apps, the troubleshooting information you collect and display is critical. React errors can stem from a variety of causes, including user misconfiguration, backend and network issues, and mismatches in browser environments. Instrumenting your code to log critical context, including feature names, user data, and session activity, enables you to quickly identify where these errors originate.
In this post, we’ll explore how you can configure better React error reports for faster troubleshooting, covering:
Error tracking in React: Error boundaries and more
Figuring out the scope of your error collection is often difficult: too granular and you risk errors slipping through the cracks or generating meaningless noise; too broad and your errors aren’t specific enough to be useful. To log React errors effectively, you’ll want to track them at the render, business, and global level.
Render level: Error boundaries and explicit error handling
Catching errors at the level of individual React components and event handlers is critical to preventing issues from propagating across the React tree and managing contextual errors. From a monitoring perspective, render error tracking has the added benefit of letting you include class-specific information like user IDs and feature names in your error reports.
The most straightforward mechanism for catching errors in React components is error boundaries. Introduced in v16, error boundaries are parent components that catch errors their children throw during rendering. Through the getDerivedStateFromError() method, error boundaries enable you to show users a custom fallback UI instead of a blank screen or a default error message. Meanwhile, via the componentDidCatch() method, you can automatically log details such as the error type and the stack trace.
Note that error boundaries only handle errors thrown during synchronous, client-side rendering. As a result, they can’t catch errors generated by event handlers, asynchronous code, or server-side rendering. Here, you’ll want to use explicit error handling, such as try-catch blocks, around potentially problematic code. Additionally, error boundaries must be implemented as class components. For error boundaries that cleanly integrate into functional component trees, you can use pre-built hooks and wrappers within libraries like react-error-boundary.
Business level: Logging silent errors
In addition to catching errors thrown within individual components, you’ll want to track more subtle, logical errors. Business-level errors often result from unexpected data, including surprise null values, improper formatting, out-of-range values, and duplicate records. If you wait until the render level to catch these errors, it may be too late to recover gracefully and prevent the issue from propagating to other components. Additionally, you lose critical diagnostic context that can come from catching the error where it originates. Validation mechanisms such as schemas and type guards can help you handle these errors.
Keep in mind that these mechanisms don’t provide a dedicated method for error logging, as with error boundaries. You’ll need to manually build one to ensure that you track critical business errors at the source.
Global level: Root node callbacks
Wrapping every component in your app in an error handler can be tedious and won’t capture errors thrown within the event handler itself. Therefore, you’ll want to implement separate error handling outside of your components at the root for more complete visibility.
As of v19, React includes global error logging at the root node through three callbacks:
onRecoverableError: errors that React was able to recover from automaticallyonCaughtError: errors captured within error boundariesonUncaughtError: errors not captured within error boundaries
Enriching errors with user, session, and application context
The default JavaScript error and info objects passed to React’s error tracking mechanisms contain limited data, consisting of the error type, a short description of the issue, and the stack trace. For more practical debugging and thorough postmortem investigations, you’ll usually want to include additional context from the user session where the error occurred.
Some platforms, such as Datadog Error Tracking, automatically enrich your error logs with information such as the user’s browser, operating system, and device; session and user identifiers; and key session events by grabbing it from elsewhere in your code or monitoring data. Otherwise, you can manually extend the default JavaScript Error class to collect additional data within custom variables, then use these variables within your error handlers or callbacks:
componentDidCatch(error: Error, info: React.ErrorInfo) {
const extendedError = Object.assign(error, {
customVariable: 1234,
componentStack: info.componentStack,
});
console.log(extendedError.customVariable);
}Useful information to collect in your errors includes identifiers, user data, and session context.
Identifiers
IDs tied to the user, error, and session can help you more quickly locate and group specific bugs in response to user reports. If using an error tracking solution that enables you to filter on error attributes, user and session IDs can help you search for specific issues. Otherwise, you may want to generate a unique reference ID for each error that you can include in user-facing error messages for more directed bug reports.
User data
User data helps you describe the affected user segment by surfacing shared characteristics. To accurately troubleshoot, you’ll want to capture technical data, such as the user’s device, browser version, and operating system. The browser stores technical user data in the User-Agent HTTP header, which you can access via the navigator.userAgent browser property.
You’ll also often want to capture geographic information. In React apps, location-specific errors may highlight issues such as content localization problems or regional server outages impacting third-party APIs. You should retrieve this information on the server side for stronger security. To do this natively within your code, you will usually need to capture user’s IP address within your backend environment, such as through req.socket.remoteAddress in Node.js or req.ip in Express.js, retrieve the location using a third-party lookup service, and finally fetch the location variable within your React app.
Session context
Session context highlights in-app conditions that may have contributed to the error, such as whether the user was logged in, the timeline of actions they took before and after the error, and whether certain feature flags were enabled. It can also include feature names and navigational information, such as the URL path of the affected view.
Session data enables you to recreate the issue and more quickly pinpoint the root cause. Consolidating this information can be difficult. Typically, you enrich error logs with application state variables, such as those indicating the login status or view name, then manually compare the results against separate user activity logs.
Alternatively, you can use an external platform that includes real user monitoring (RUM), such as Datadog, to automatically unify your data using a single SDK. RUM platforms can correlate usage information you would otherwise piece together manually, such as event timelines, and organize them into your error reports.
Sanitizing error messages to prevent data leaks
While enriching your errors can help you debug faster, you’ll also want to be careful not to expose information that could put your system at risk or violate regulations. CWE-1295 identifies sensitive data in error messages as a common weakness that attackers can exploit to access valuable user data or gain intel about system architecture. This data can include filepaths, memory addresses, and usernames.
Sensitive data can be exposed through error messages in a number of ways, including within template literals…
throw new Error(`Failed for user ${user.email}`)
…and in URL or query parameters, which often contain session tokens and API keys from redirects:
throw new Error(`Request failed: ${response.url}`)
To prevent malicious actors from exploiting error messages, you’ll want to take two basic precautions when logging error information. The first is to scrub personally identifiable information (PII) such as email addresses or credit card numbers before storing your error messages in centralized repositories. Then, you can limit access to these error repositories in order to shrink the potential attack surface.
Group, enhance, and investigate React errors with Datadog Error Tracking
Manually configuring each error handler with custom variables and scrubbing your logs of sensitive information can be time consuming. This approach is also prone to human error, leading to coverage gaps and data leaks.
Instead, you can use a platform like Datadog Error Tracking for comprehensive error logging. Datadog Error Tracking collects errors from both React browser apps and React Native mobile apps, then enriches them with troubleshooting data such as the browser, device, location, and user ID.
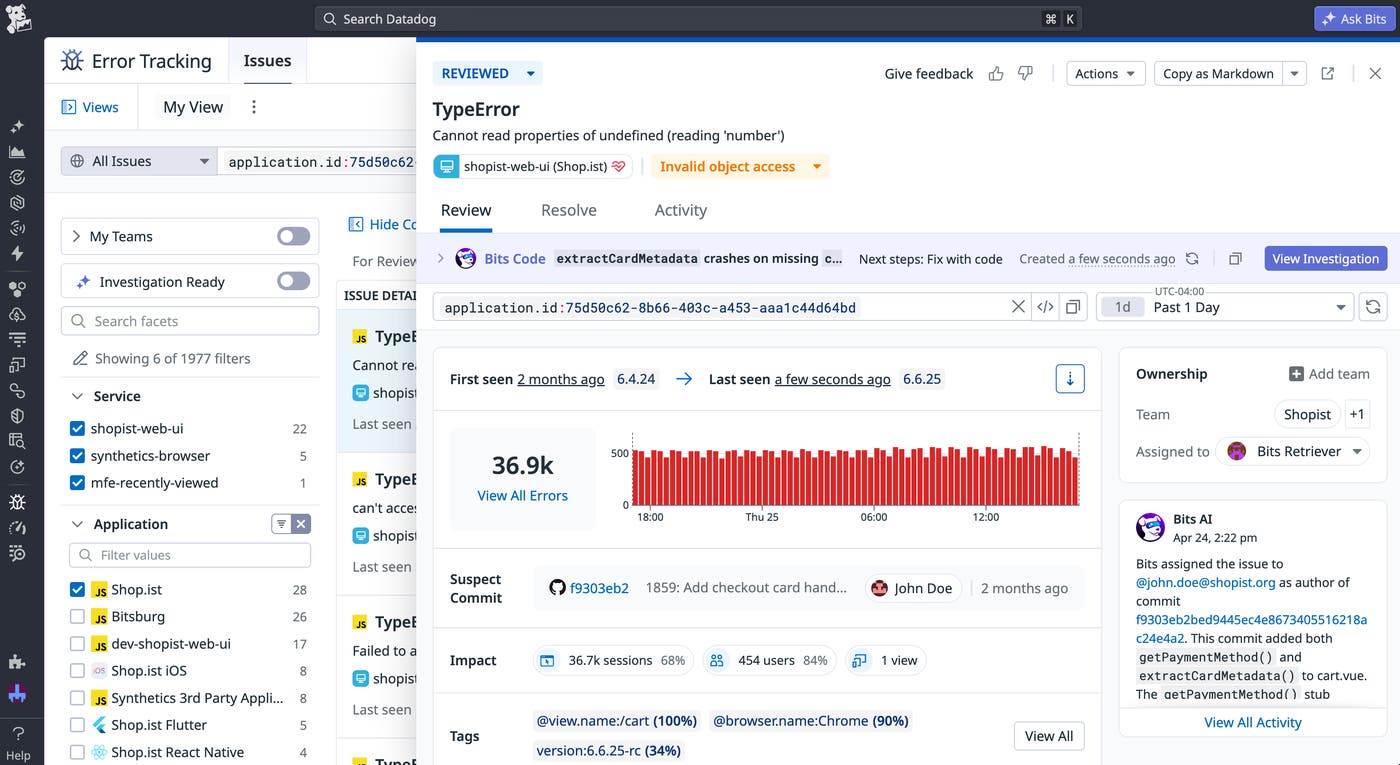
Using the session ID, Error Tracking automatically correlates your errors with relevant data in Datadog RUM, including event timelines, session replays, URL paths, and feature flag statuses.
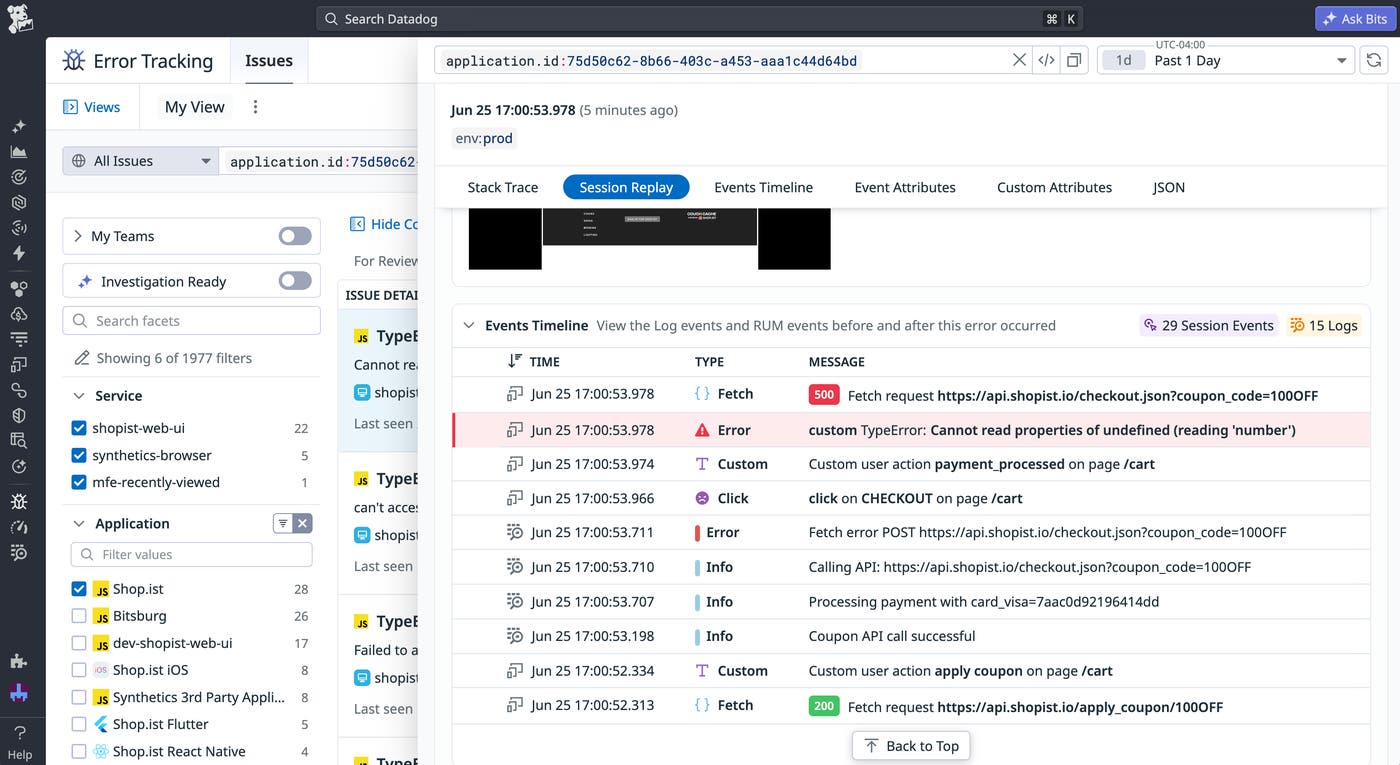
There are two ways you can send React errors to Datadog Error Tracking:
Directly instrumenting error boundaries with the
addError() APIfrom the RUM Browser SDK. Using theaddError()API enables you to consolidate and enrich rendering errors via the RUM library you use for the rest of your frontend observability, no extra setup needed.Implementing global error handling through root-node callbacks within the RUM React integration. Global error tracking helps you surface errors that often go uncaught, such as HTTP 4xx codes from
fetchAPI requests or bugs with synchronous event handlers. Error Tracking displays these errors alongside those caught by error boundaries for complete, unified visibility.
Whichever approach you choose, you can remove sensitive data like passwords and email addresses from your error messages with out-of-the-box scanning rules in Sensitive Data Scanner. Additionally, by uploading source maps to Error Tracking, you can access unminified stack traces for errors in your production environments.
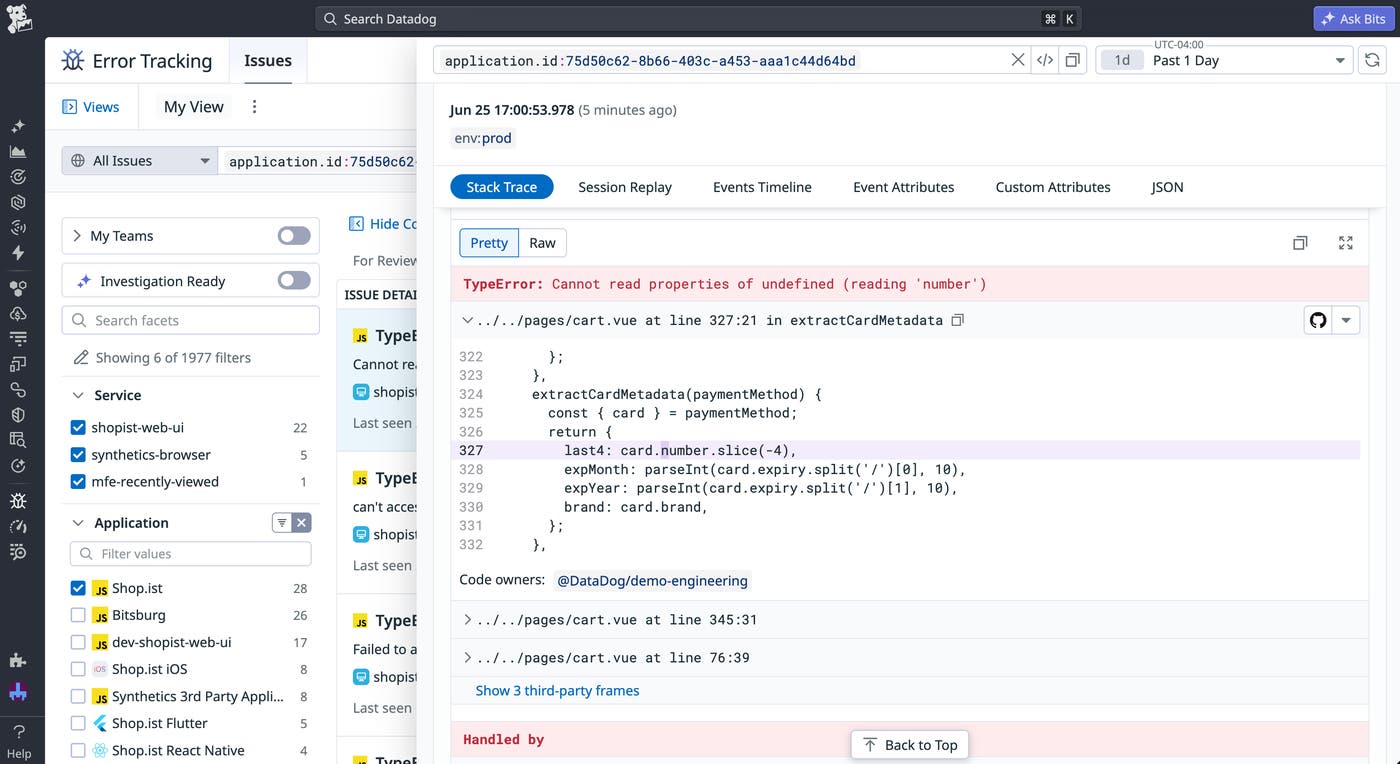
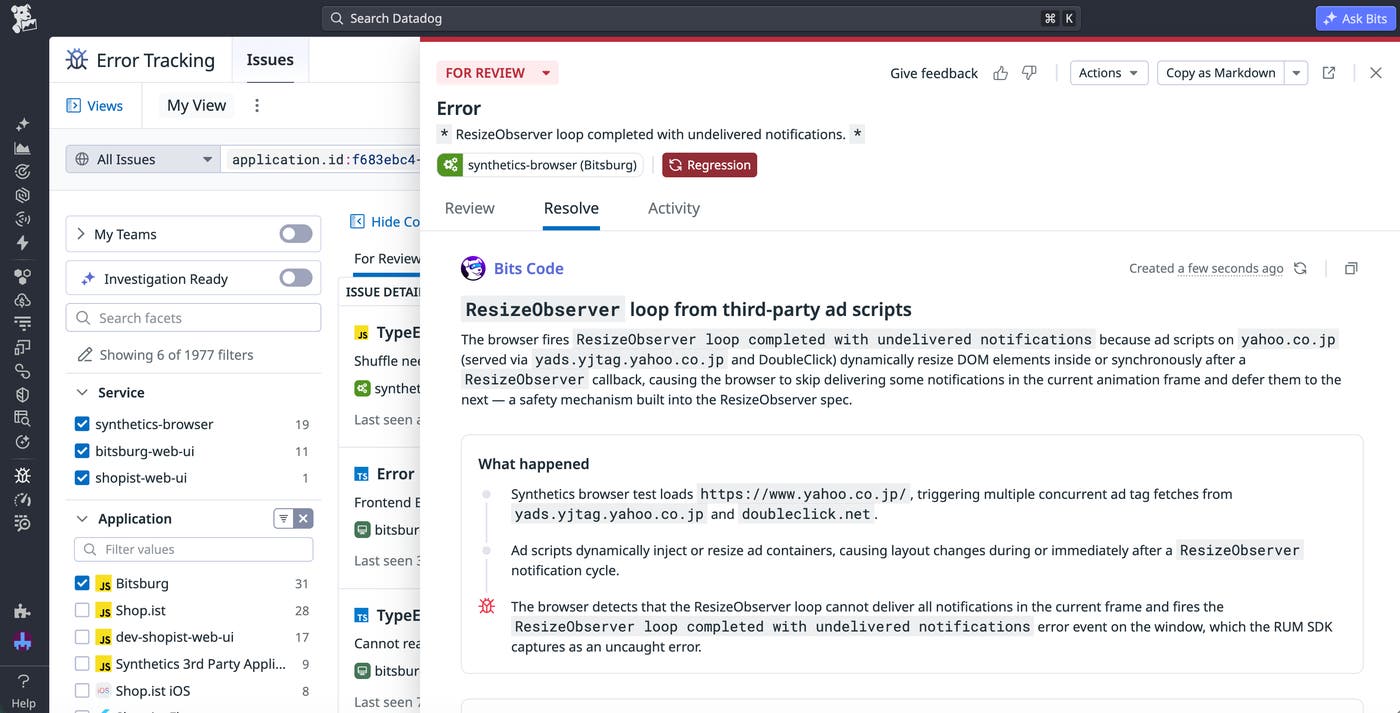
Once Datadog has ingested your errors, Error Tracking automatically groups identical errors into single issues. In addition to reducing noise, Error Tracking issues help you more accurately assess impact through counts of the affected users, sessions, and views. Datadog also enables you to immediately start remediation through AI-assisted investigations.
Let’s say an Error Tracking monitor alerts you to a new problem on a payment button that leaves customers unable to check out. You pivot directly to this issue in Datadog and launch an agentic investigation. Bits Investigation identifies that the problem stems from an incorrect loop condition in your React code and provides a suggested fix. You can then create a PR to directly push these fixes to your repository or open a coding session within Datadog to iterate further.
Monitor React errors with Datadog Error Tracking
React error monitoring often means patching together multiple error handling methods, each of which must be manually configured to capture the troubleshooting context you need. With Datadog Error Tracking, you can collect and enrich errors at every level, then group and investigate them for a faster mean time to resolution (MTTR).
To learn more, read our Error Tracking and RUM React integration documentation.
Or, if you’re new to Datadog, you can sign up for a 14-day free trial.
