
Joey Zhao
Software Engineer II

Yiming Luo
Software Engineer

Pablo Martinez Bernardo
Senior Software Engineer

Ethan Gracer
Product Manager
AWS Lambda durable functions let you build long-running, multi-step workflows for use cases such as payment processing, order fulfillment, and AI workflows with human approval. A single durable execution can pause for a wait or callback, retry failed work, and resume in a fresh Lambda invocation without losing its state. The strong resilience provided by durable executions, however, creates an observability challenge because each invocation produces its own telemetry data. Following one execution end to end can require manually stitching together disconnected traces, logs, and information from the AWS console.
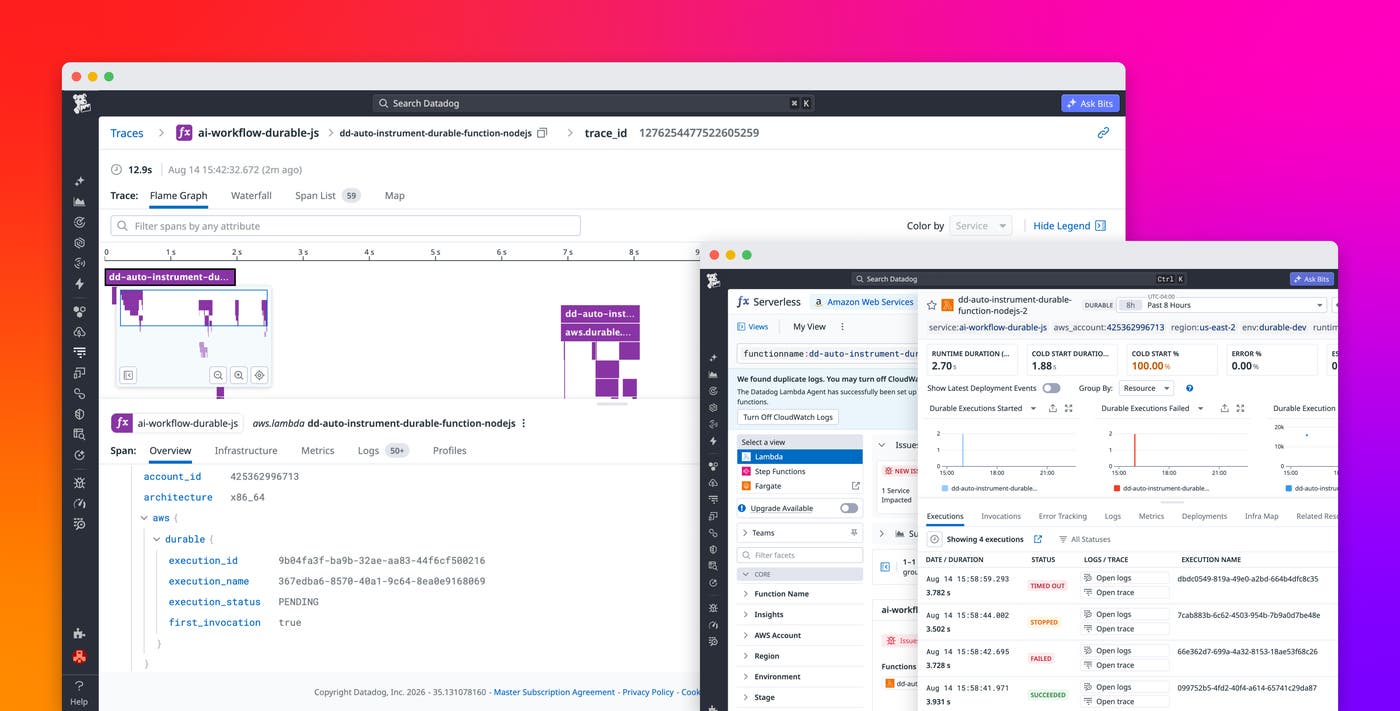
Datadog traces AWS Lambda durable executions across invocations, giving you a single view of the operations that make up the workflow. The Datadog Node.js and Python tracers instrument the AWS Lambda Durable Execution SDK. They create spans for durable operations such as steps, waits, callbacks, invokes, maps, parallel operations, and child contexts. Cross-invocation tracing connects the Lambda invocations for an execution in one trace, so you can investigate operations, retries, and failures in context without adding tracing code to your workflow.
In this post, we’ll look at how you can:
Jump from the AWS console to the durable execution trace in Datadog
Troubleshoot failed steps and retries in a durable execution
Trace every durable operation in a single flame graph
A durable execution can span multiple Lambda invocations. When a workflow calls context.wait(), waits for a callback, or retries a failed step, the AWS Durable Execution SDK checkpoints its progress and suspends the function. AWS then invokes the function again, potentially many times, replaying completed operations from checkpoints before continuing. Without specialized instrumentation, each of these invocations shows up as a separate trace, and understanding what the workflow actually did requires you to correlate them manually.
Datadog’s instrumentation for the AWS Lambda durable execution SDK creates a span for each durable operation as it executes, naming each one after your operation, such as step_1_validate_order. An aws.durable.execute span anchors the execution. Together, these spans answer the questions that matter during an investigation: What ran, in what order, how long each step actually took, and where things went wrong.
Several span tags help you filter and interpret durable executions. You can use aws.durable.operation_name, aws.durable.operation_id, and aws.durable.execution_arn to filter by operation or execution. The aws.durable.replayed and aws.durable.invocation_status tags help distinguish replays from real work and failed executions from those that are still waiting.
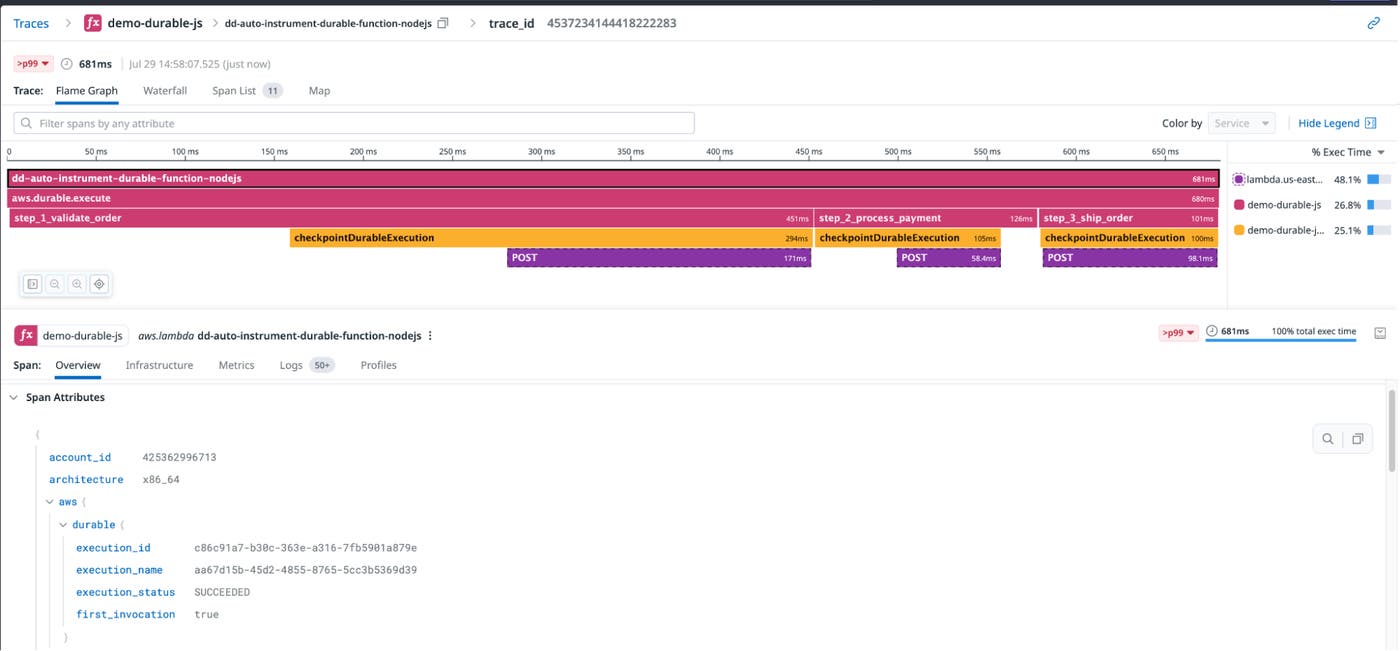
All of these spans share one trace, even when different Lambda invocations produced them. You see the workflow as you wrote it: a sequence of named operations with real durations in a single flame graph. For an order processing workflow, that means you can see validate_order, process_payment, and ship_order alongside the waits and callbacks between them, instead of hunting through a list of invocation-level traces.
Jump from the AWS console to the durable execution trace in Datadog
Cross-invocation tracing works by storing trace context in the same checkpoint mechanism durable functions already use. On the first invocation, the tracer writes a small additional checkpoint named _datadog_{N}. Visible in the AWS console, this checkpoint carries the Datadog trace ID. Each time the execution resumes, the tracer reads that checkpoint back and continues the same trace instead of starting a new one. Your own checkpoint payloads are never modified.
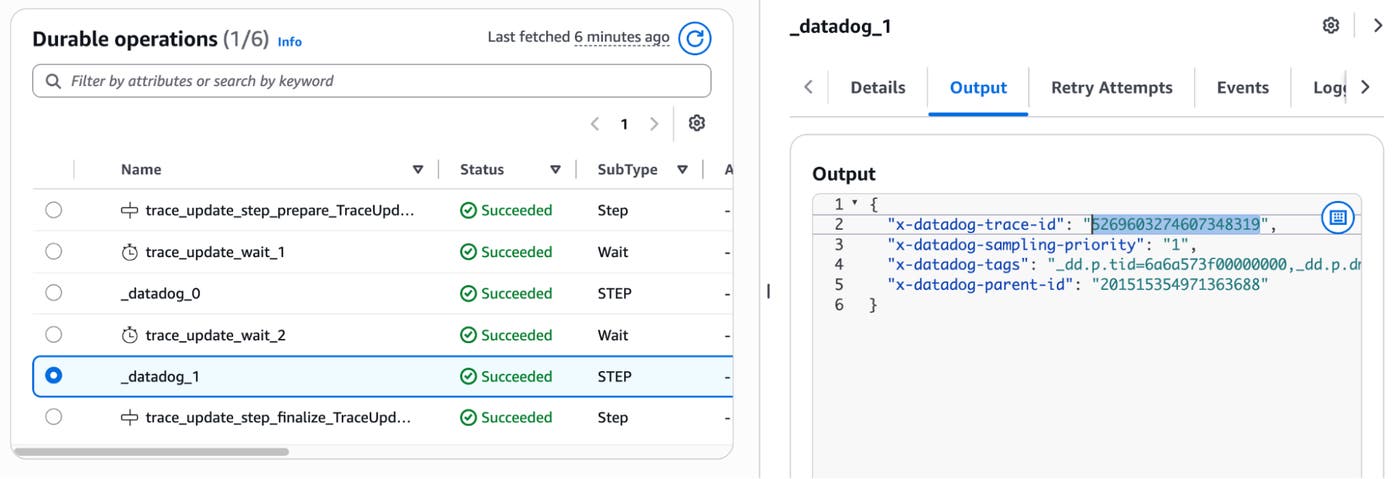
Cross-invocation tracing has a useful side effect: The trace ID is visible next to your execution in the AWS console. When you’re investigating an execution in AWS, such as one that’s stuck waiting on a callback, you can copy the trace ID from the _datadog_{N} checkpoint. Paste it directly into Datadog’s Trace Explorer to open the full flame graph for that execution.
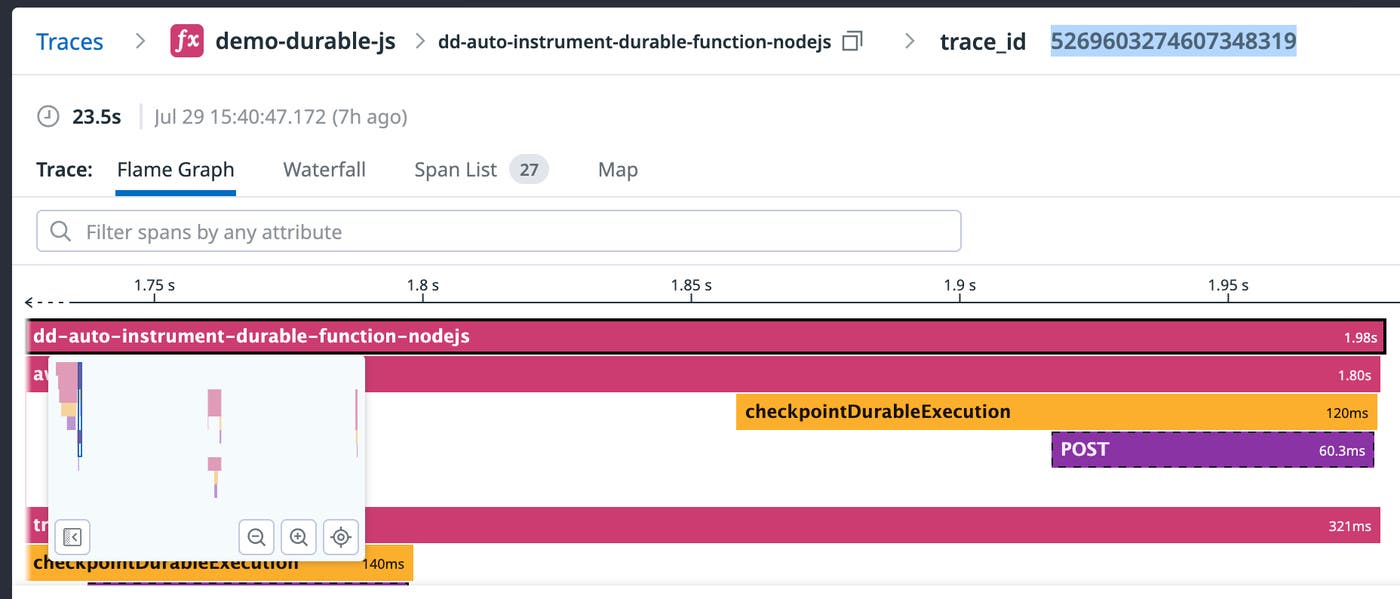
Cross-invocation tracing is enabled by default, and it writes its checkpoint only when one is actually needed, i.e., when an execution suspends and resumes across multiple invocations. An execution that completes within a single invocation gets no extra checkpoint, so simple workflows carry no added noise. If you’d rather treat each invocation as an individual trace, you can disable it by setting DD_DURABLE_CROSS_INVOCATION_TRACING_ENABLED=false.
Troubleshoot failed steps and retries in a durable execution
Retries are where durable functions earn their name, and where they can get hard to debug. When a step throws an error, the SDK checkpoints the error and schedules a retry, often in a later invocation. In invocation-level traces, a step that fails twice and succeeds on the third try can look like noise scattered across separate traces. In a durable function trace, each attempt appears in the context of the same execution.
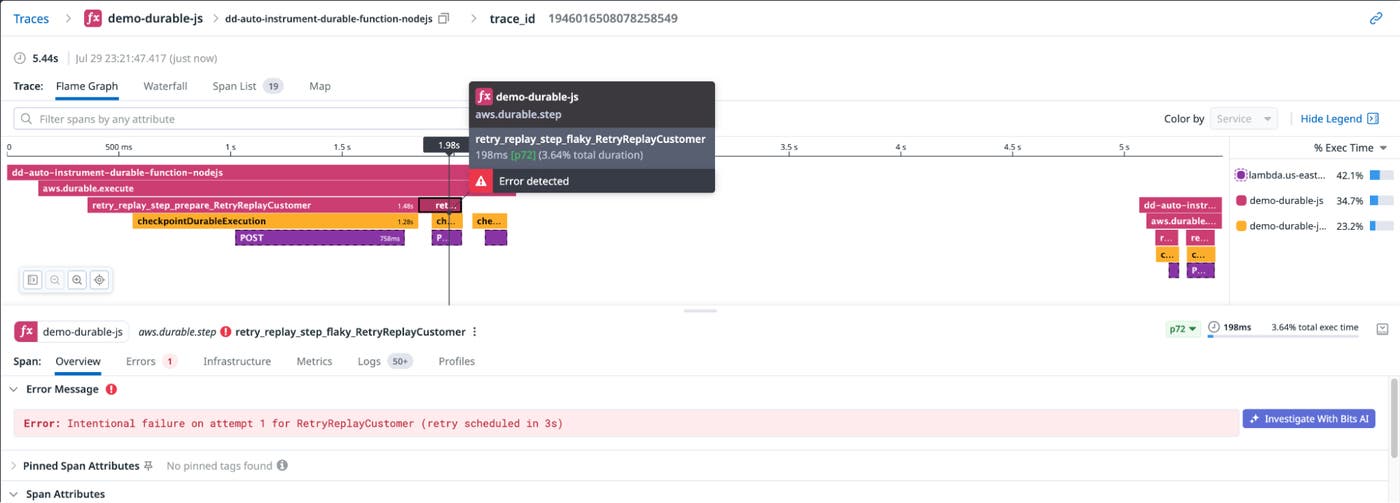
For example, when the step retry_replay_step_flaky_RetryReplayCustomer fails, Datadog marks the operation span as an error and attaches the error message to that span. The error message on the span lets you identify which durable operation failed and inspect the failure without first correlating it with another Lambda invocation.
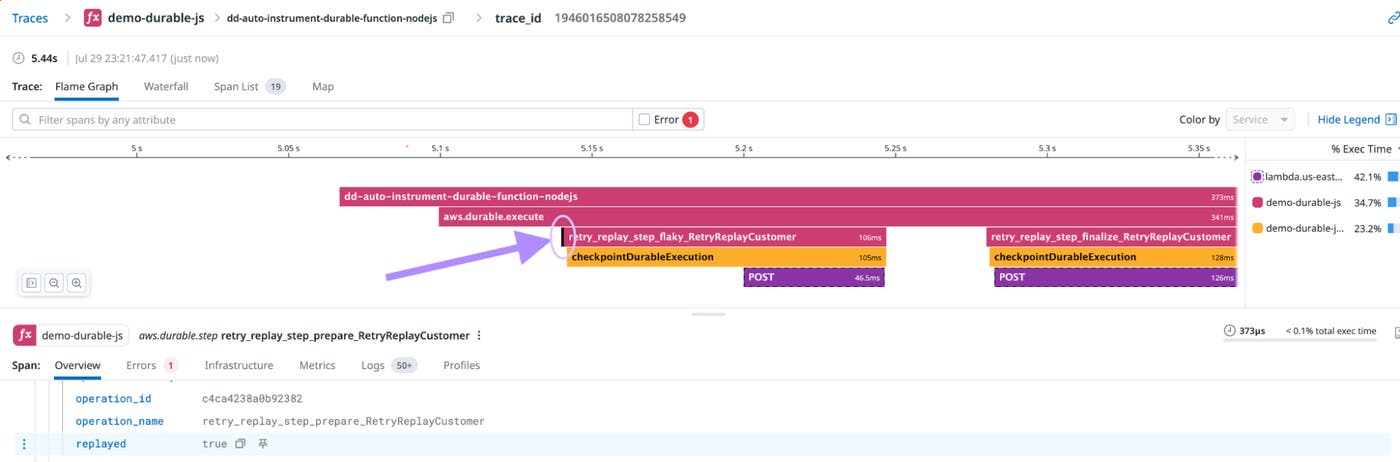
You’ll also notice hairline-thin spans sitting between the real operations. When AWS invokes the function again, the SDK replays already-completed operations from their checkpoints before continuing. The tracer records each replay as a near-zero-duration span with aws.durable.replayed set to true. The replayed tag shows what each invocation replayed without making it look like another execution of the underlying operation.
When an execution fails outright, you can filter to errors in the Trace Explorer and use aws.durable.execution_arn to isolate an execution. Then inspect aws.durable.invocation_status to distinguish a failed invocation from one that’s still pending. Because error details ride along on the operation span itself, the exception type and message are available on the span that represents the failed attempt.
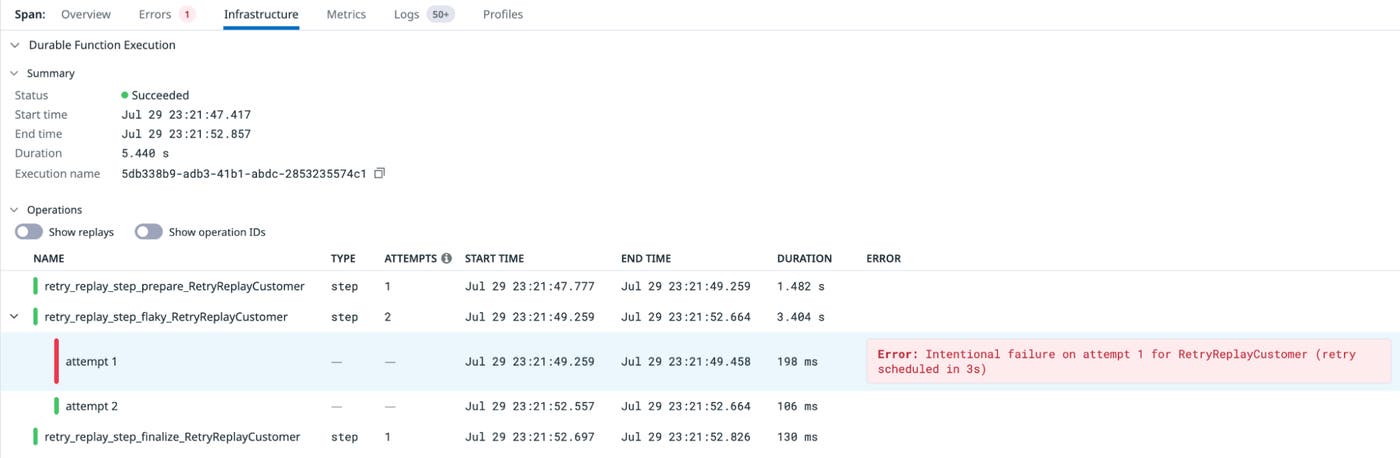
In addition to the flame graph, you can view operations as a list in the Infrastructure tab. The list summarizes the durable function execution and shows each operation, its number of attempts, timing, duration, and any associated error. Clicking a row selects the corresponding span in the flame graph, so you can move between an execution-level summary and the underlying trace.
Set up durable function tracing with minimal configuration
Durable function tracing requires no code changes. If your Node.js or Python Lambda functions are already instrumented with the Datadog Lambda Library and Datadog Lambda Extension, durable operations are traced automatically. The automatic tracing works whether you instrument them through the Datadog CLI, CDK construct, Serverless Framework plugin, CloudFormation macro, or Terraform.
Your function code can continue to use the standard withDurableExecution wrapper from the AWS Durable Execution SDK for JavaScript:
import { DurableContext, withDurableExecution} from '@aws/durable-execution-sdk-js';
export const handler = withDurableExecution( async (event, context: DurableContext) => { const order = await context.step( 'validate_order', (ctx) => validateOrder(ctx, event.order_id) );
const payment = await context.step( 'process_payment', (ctx) => processPayment(ctx, order) );
await context.waitForCallback( 'wait_for_approval', submitForApproval );
return context.step( 'ship_order', (ctx) => shipOrder(ctx, order) ); });For Python, dd-trace-py automatically instruments the AWS Durable Execution SDK for Python package in the same way.
One extra step is recommended for long-running executions. Durable executions can run for days or months, and Datadog treats trace data that arrives far apart as separate units for retention sampling. To keep every invocation of an execution retained consistently, create a retention filter for durable execution traces.
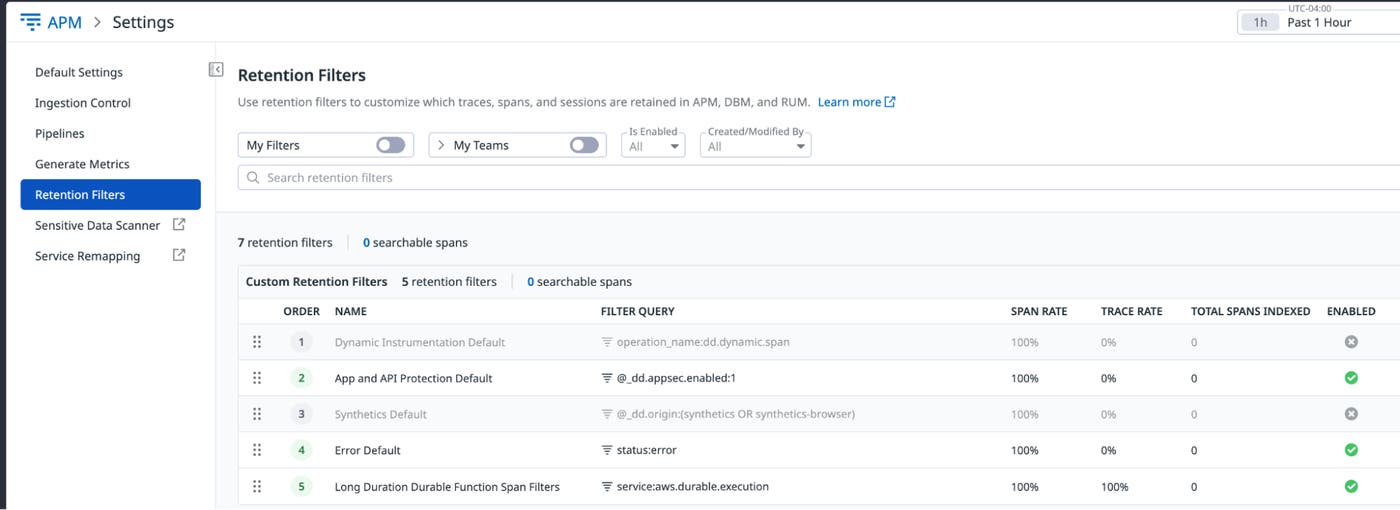
When you create or edit the retention filter, set its query to operation_name:aws.durable.execute. This query targets durable execution spans so that spans sharing a trace ID can be kept together for the life of the execution.
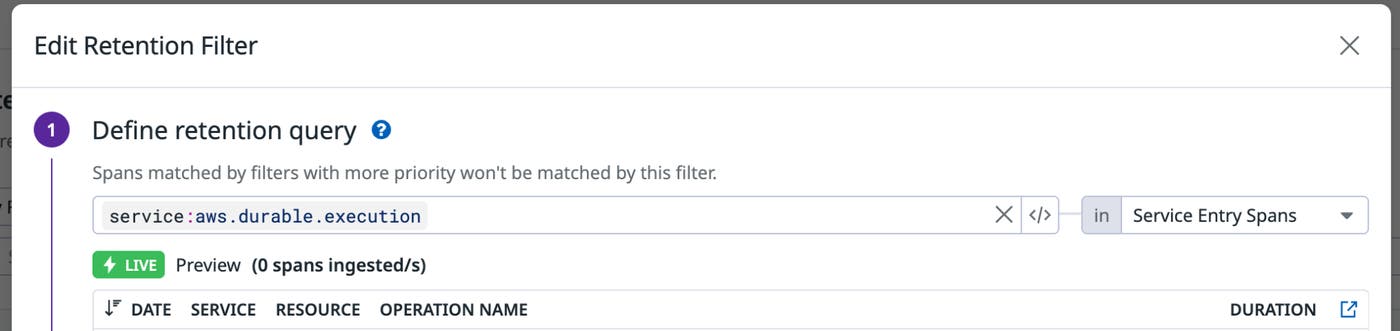
Standard trace retention limits still apply. See the durable function instrumentation documentation for details.
Get a status overview for durable executions
Beyond individual traces, Datadog gives you a function-level view of overall status across all executions. The Executions tab in the Serverless View lists durable executions along with their duration and status, and provides direct links to their logs and traces.
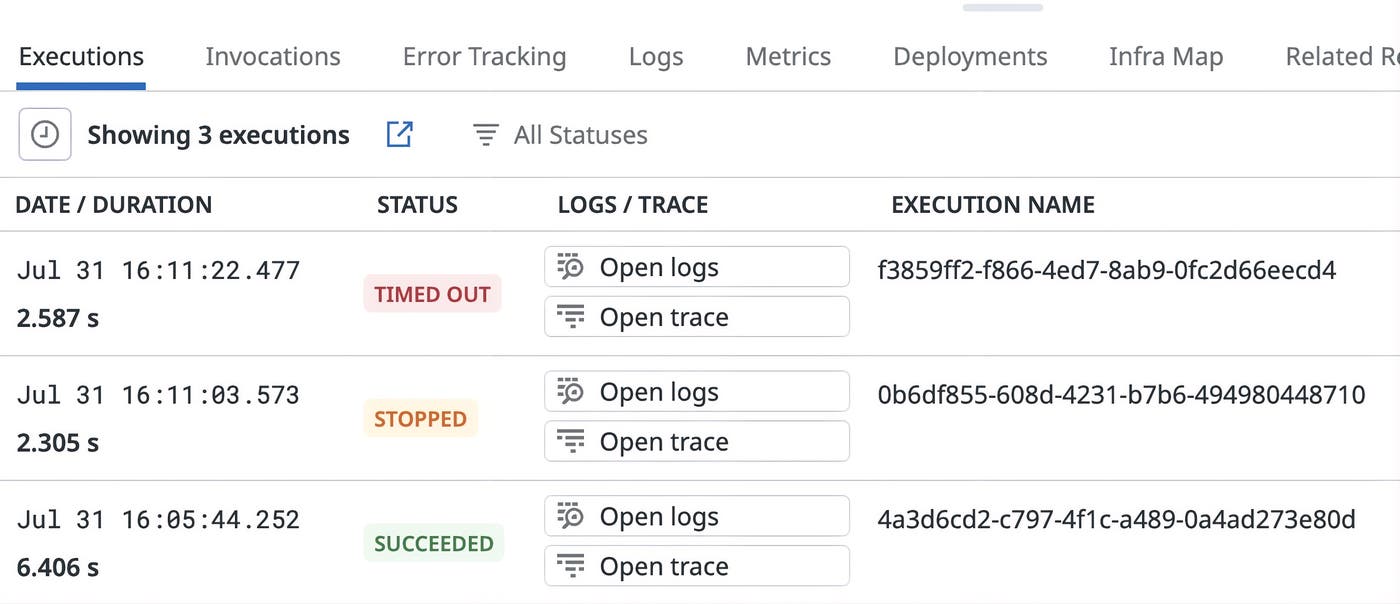
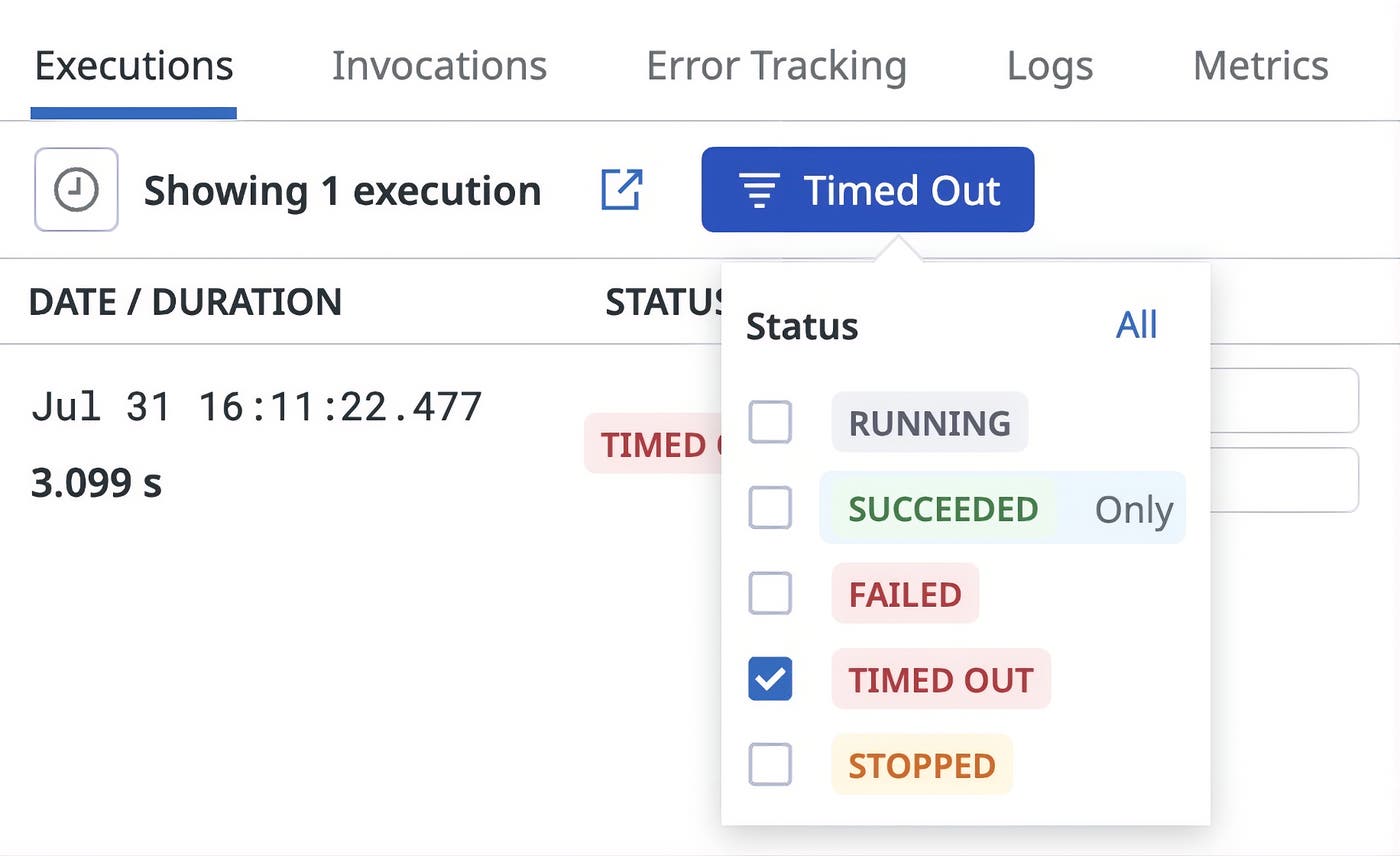
Clicking a row opens the trace view, allowing you to troubleshoot performance issues and errors for a specific execution. You can also filter executions by status to narrow the list to the workflows you need to investigate.
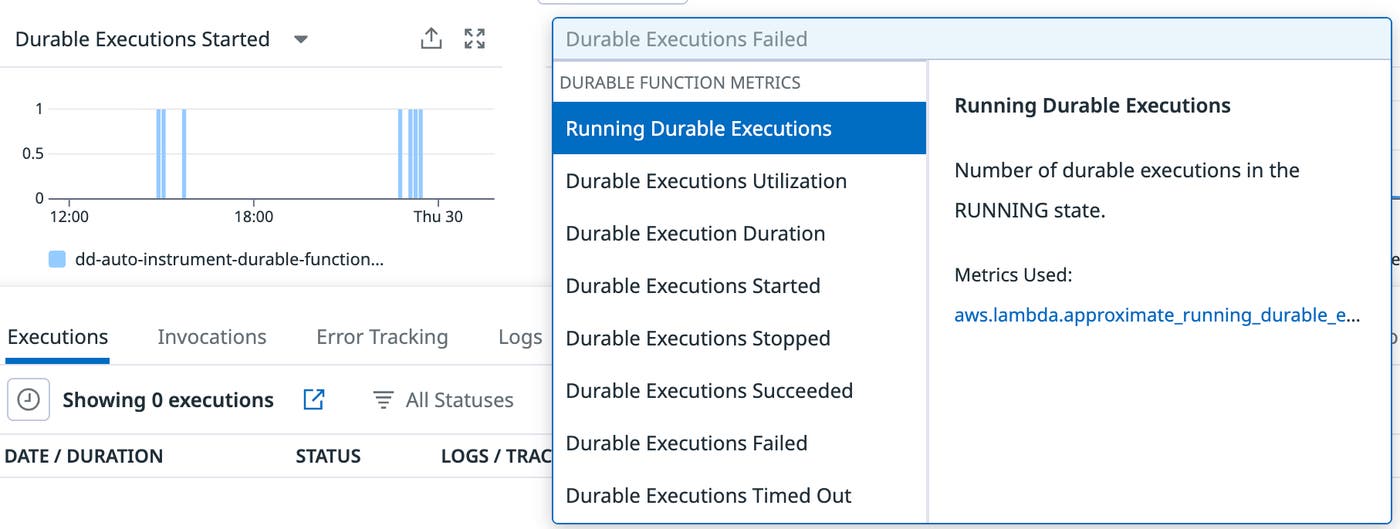
Durable function metrics provide a higher-level view of execution behavior over time. From the Serverless View, you can select metrics for running executions, utilization, duration, operations, storage written, and executions that started, stopped, succeeded, failed, or timed out.
Get full visibility into durable workflows with Datadog
Datadog connects the Lambda invocations in an AWS Lambda durable execution and combines them into one trace. You can troubleshoot workflows that suspend, resume, and retry without needing to manually reconstruct their histories.
To get started, see the Datadog documentation for monitoring AWS Lambda durable functions, and review the trace retention documentation for long-running executions. If you’re new to Datadog and want to trace your AWS Lambda durable functions alongside the rest of your serverless telemetry, sign up for a 14-day free trial.
