Emily Chang
Node.js is an asynchronous JavaScript runtime that is used to develop highly scalable network applications. To help provide more visibility into these dynamic environments, Datadog APM has officially released support for monitoring Node.js applications, which joins our existing support for Java, Ruby, Python and Go.
Out-of-the-box support for Node.js monitoring
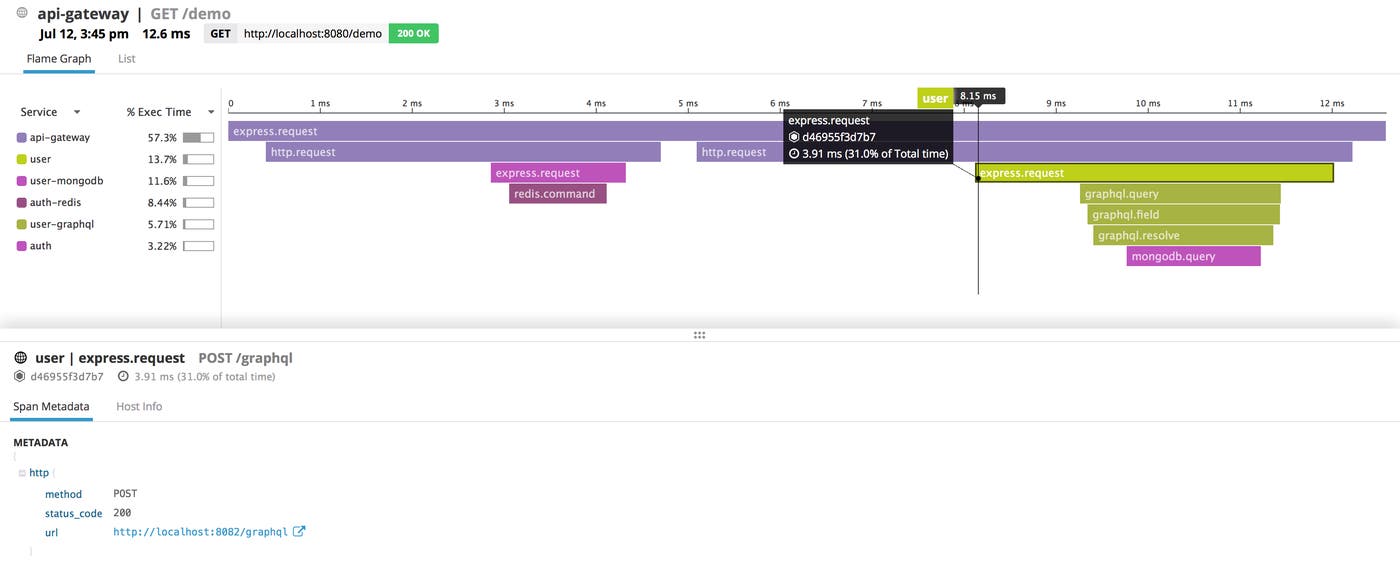
As you deploy and scale your Node.js applications, you need full visibility into their health and performance in order to troubleshoot issues effectively. Datadog APM provides detailed performance overviews of your applications, and traces requests as they travel across distributed services and hosts, so that you can identify bottlenecks and debug errors.
Datadog APM automatically instruments requests to modules that are commonly used throughout the Node.js ecosystem, including web frameworks like Express and data stores like MongoDB, Redis, MySQL, and PostgreSQL. See our documentation for a full list of integrations.
Monitor and analyze Node.js application performance and health with Datadog APM.
Once you deploy APM, Datadog will begin tracing requests as they travel across caches, databases, web servers, and other services in your Node.js environment. In your Datadog account, you'll see detailed overviews of key metrics (throughput, latency, and errors) from each service running in your application. You will also see a latency distribution and percentile statistics for requests to each monitored service.
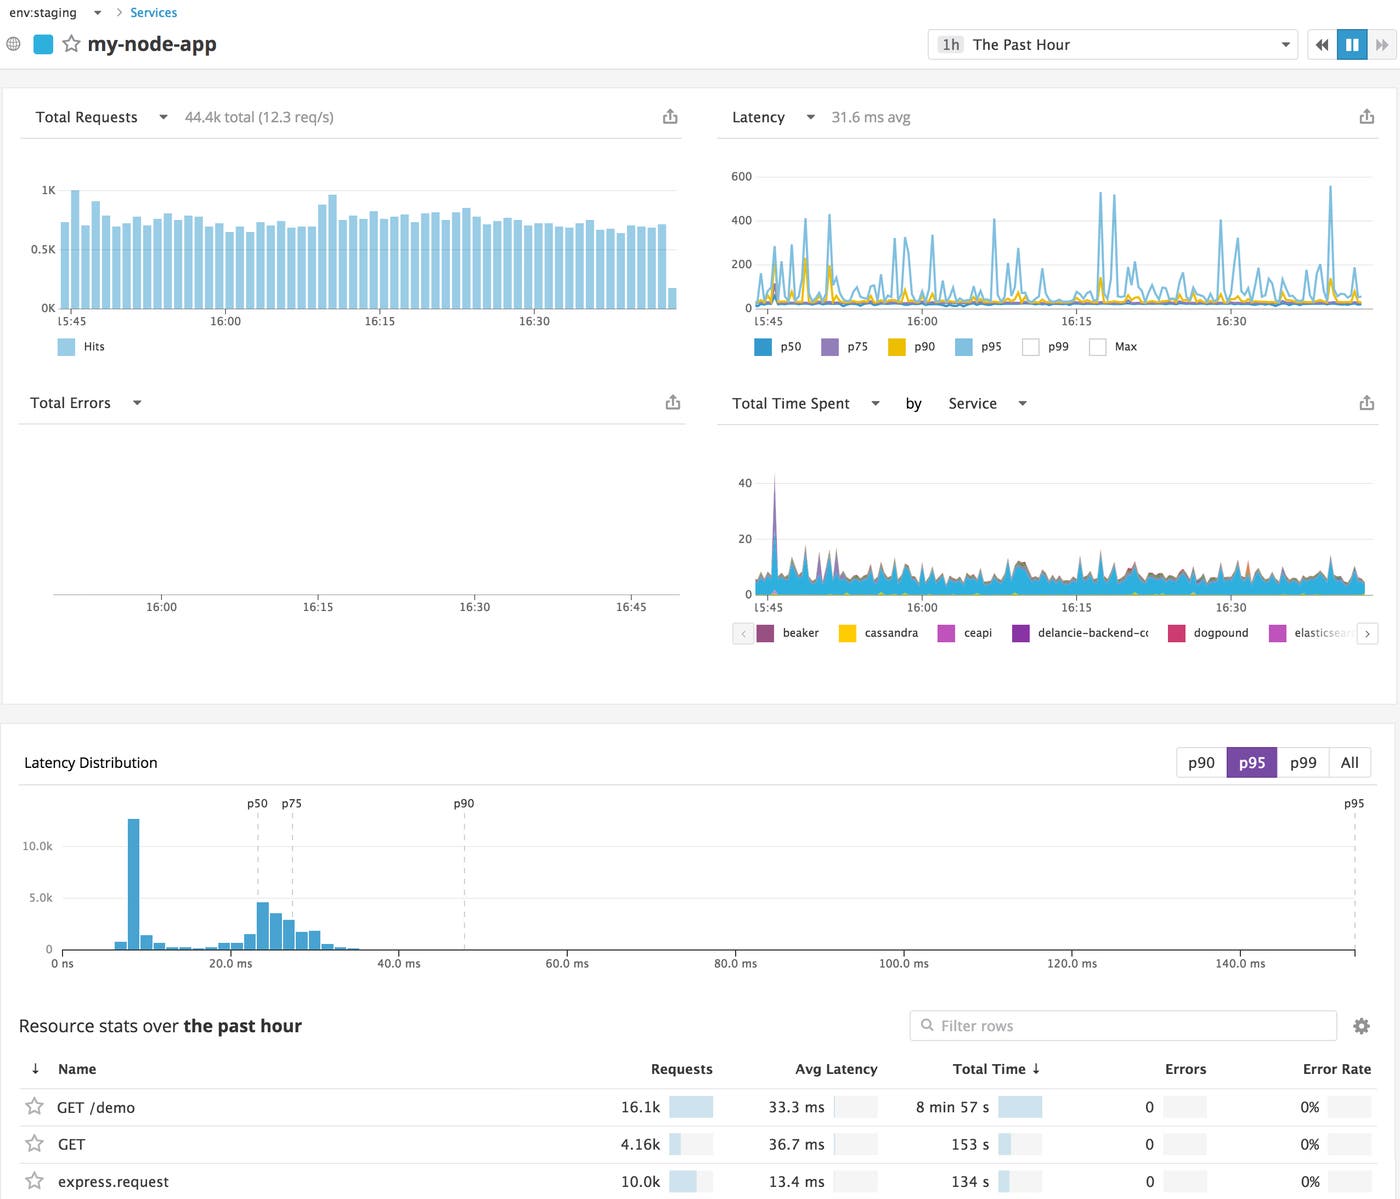
You can sort resources by average latency or error rate to quickly identify the most problematic endpoints in any particular application. Clicking on an endpoint will bring you to another dashboard that displays high-level metric overviews as well as request traces collected from that endpoint. You can click on any individual request trace to inspect a flame graph that displays a detailed breakdown of how the request was executed, and how much individual calls or queries contributed to overall request latency. If the request resulted in an error, you can view the full stack trace to get more context around the source of the issue.
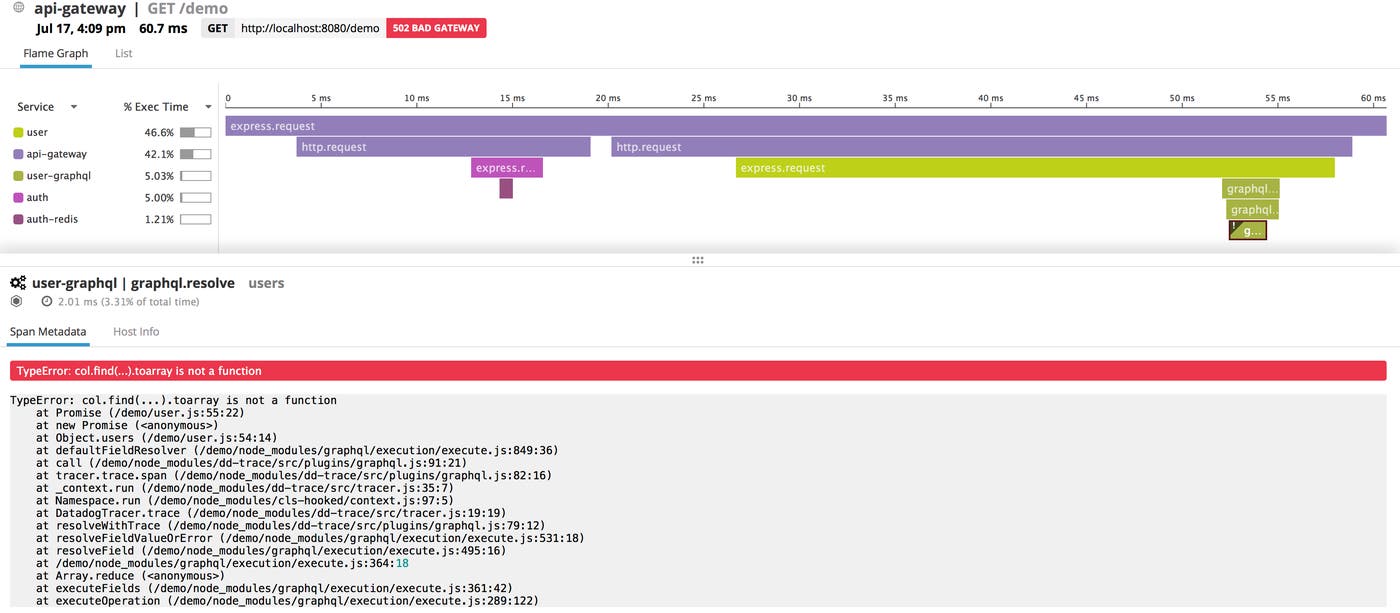
Detect + investigate performance issues
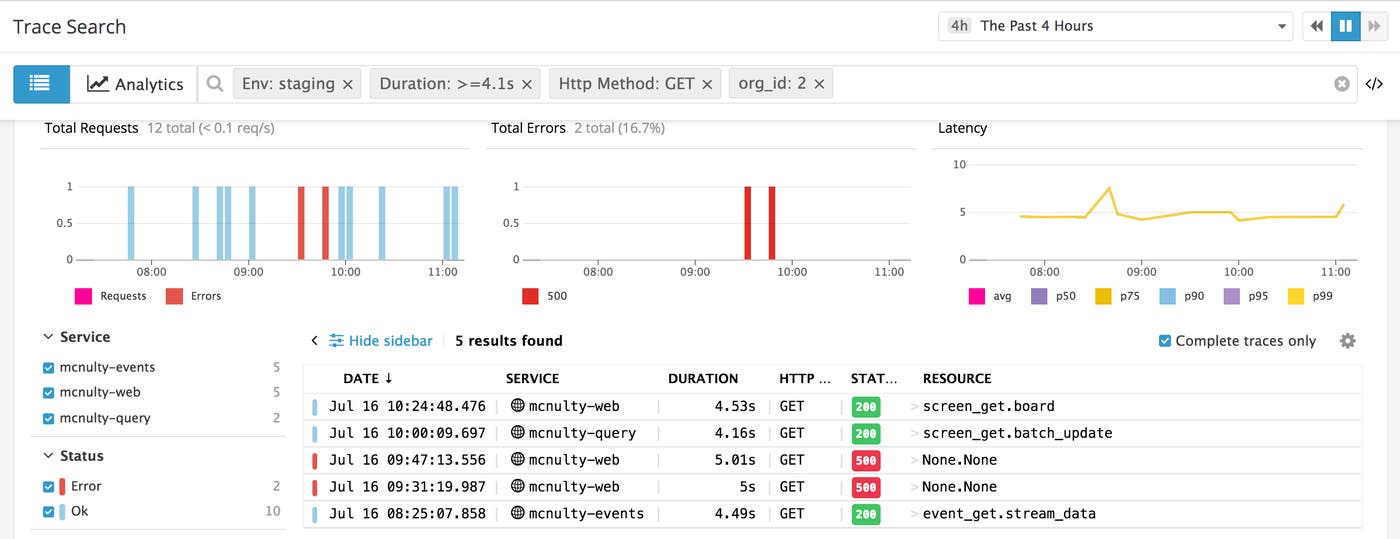
Datadog's App Analytics makes it easier to garner insights from all the analyzed spans you're collecting from your Node.js applications. You can quickly search your traces by any dimension, such as availability zone, URL endpoint, or HTTP method, or even high-cardinality tags like user ID or product SKU. For any subset of your data, you can view performance overviews of throughput, errors, and latency, and click to inspect traces that meet your search criteria so you can get even deeper insights into the performance of your Node.js applications.
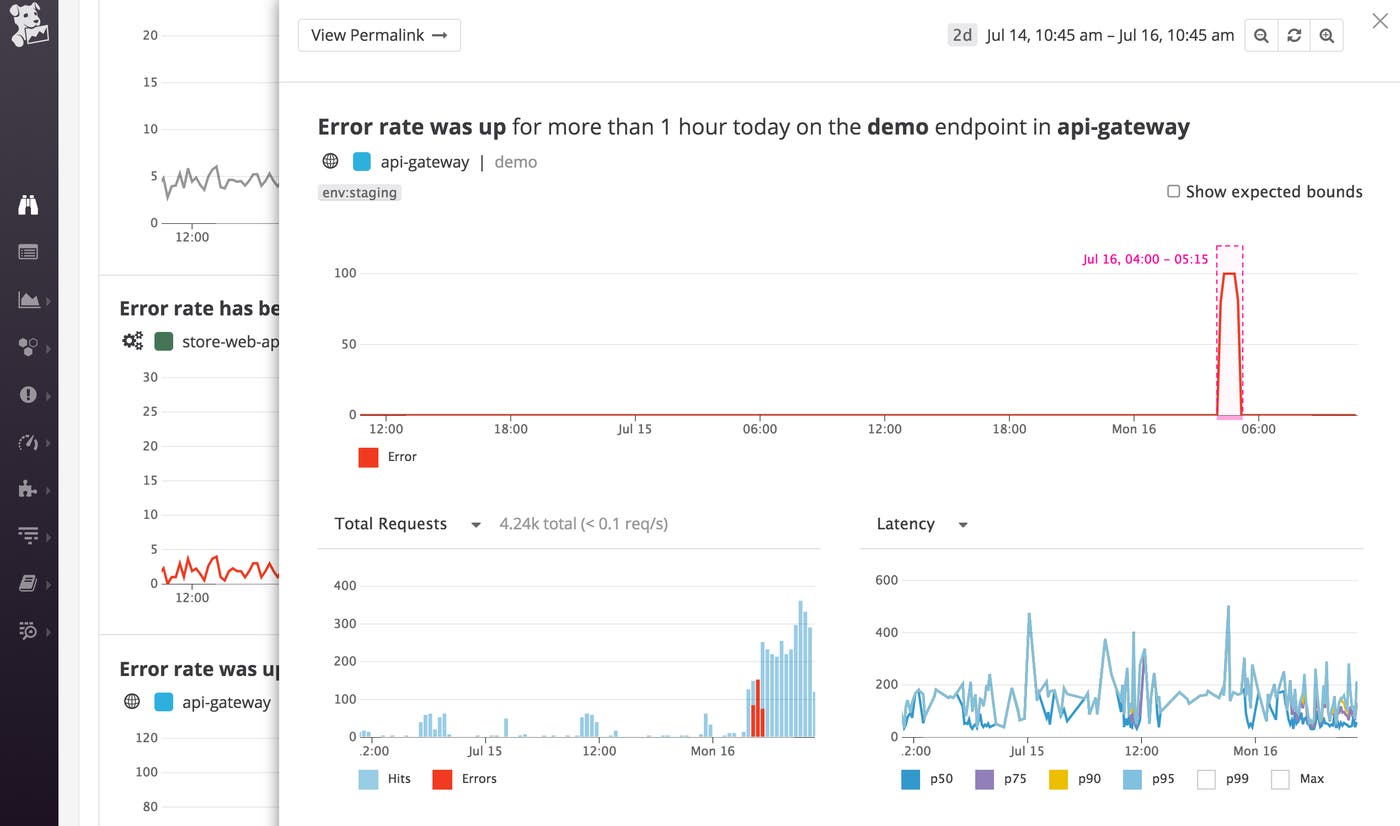
You can use Datadog APM to set up automated alerts (including anomaly detection and forecasting) on potential issues like high error rates, or anomalous request throughput. You can also rely on Watchdog to automatically keep you informed about performance issues in your applications. Watchdog uses machine learning to surface potential problems, like elevated error rates on any of your endpoints, without requiring you to manually configure any alerts.
Full context for monitoring Node.js applications
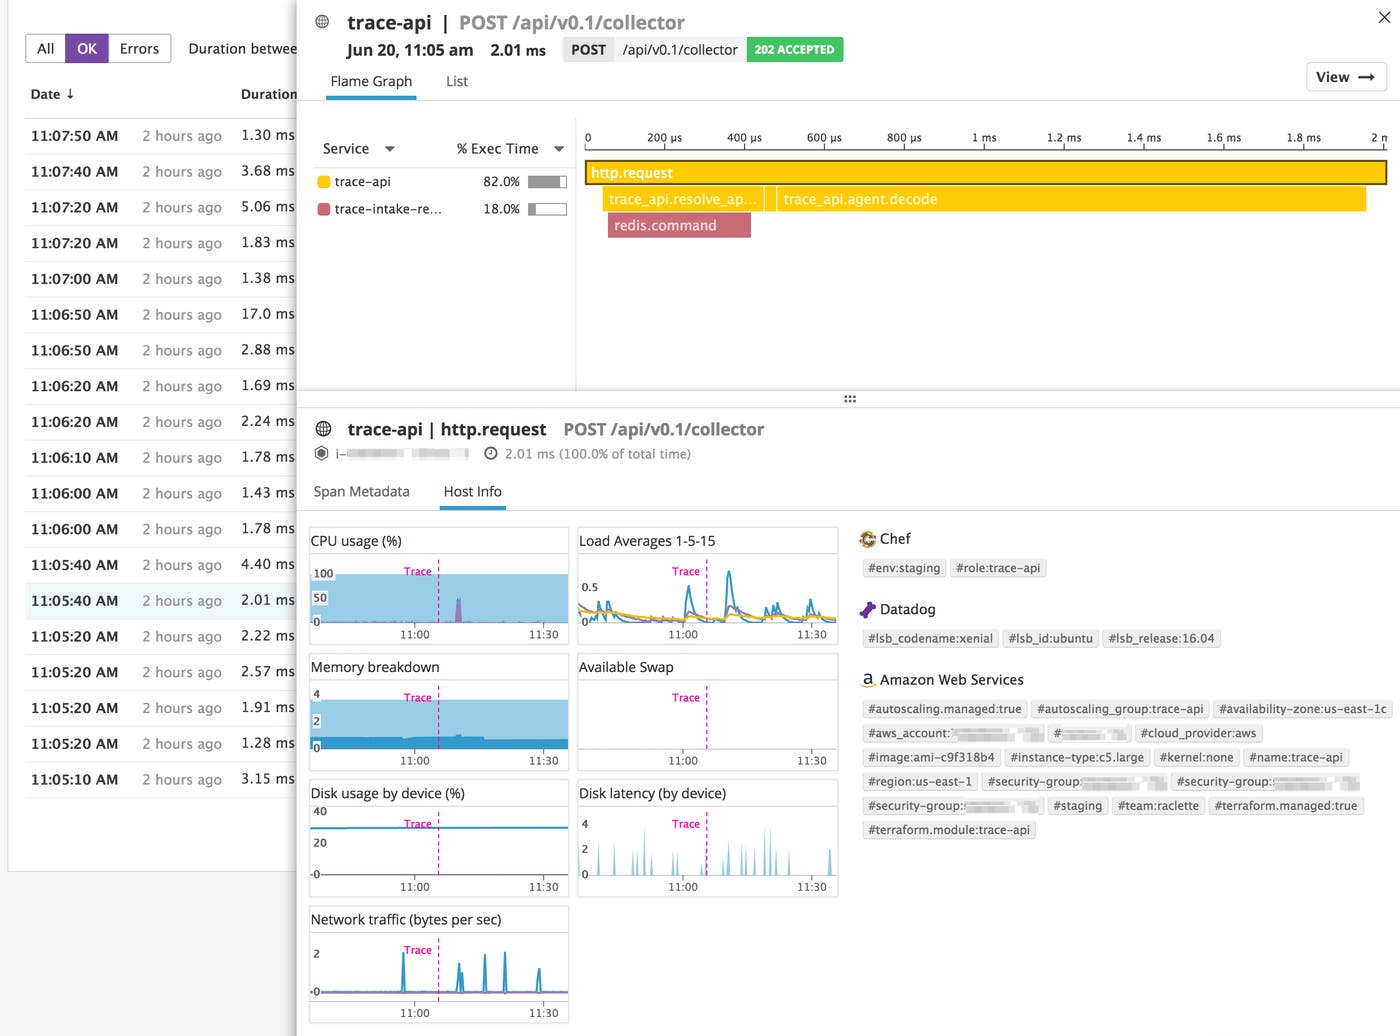
Datadog collects metrics from your applications' underlying infrastructure, so you can easily pivot between sources of monitoring data to determine whether a performance problem stems from code-level issues or resource saturation on the host. As you're inspecting a trace, you can click on a specific span and navigate to the "Host Info" tab to see key metrics from the application host. The time that the request was collected is automatically marked on each graph for easy correlation.
Easy setup for quick insights
To deploy Datadog APM for your Node.js applications, you will need to install the Datadog Agent and the dd-trace library on your application servers. You can also deploy APM on Docker by using our docker-dd-agent image.
Although Datadog APM's dd-trace library is compatible with versions 4.7+, 6.9+, and 8+ of Node.js, it will perform more efficiently in applications that run more recent versions of Node.js, due to the performance improvements that were added in 8.3.0+.
Datadog APM's auto-instrumentation provides quick insights across key modules in your Node.js applications, but you can also manually instrument and tag specific spans of code to ensure that your request traces carry all the information that's relevant to your application and your business. The example below creates a custom span that will appear in the request trace as web.request. It also tags the span with my_tag:my_value:
const tracer = require('dd-trace').init()const span = tracer.startSpan('web.request')
span.setTag('my_tag', 'my_value')span.finish()Consult our documentation for more custom instrumentation examples.
APM is compatible with OpenTracing, the open standard for distributed tracing. OpenTracing is vendor-neutral, so you can easily port your applications from one backend to another without having to revise any code-level instrumentation.
Get started with Node.js monitoring
Support for Node.js monitoring is now available in Datadog APM. If you don’t have a Datadog account, you can sign up for a free 14-day trial to start getting deeper insights into your Node.js applications and exploring them in full context with the rest of your environment.
