Addie Beach

Sriram Raman

Jason Hunsberger
Network security services like Google Cloud Armor enable you to filter incoming traffic so that you can prevent attacks from overwhelming your system or from reaching critical components of your application. However, these services often handle threats automatically, making it difficult to gain visibility into attempted security breaches. To better protect the entire attack surface of your application—from the network perimeter to your code—you need to know which IP addresses are linked to these attacks, what areas of your application are being targeted, and how the attacks are being carried out.
The Google Cloud Armor integration in Datadog gives you insights, through both visualizations and contextual data, into any malicious attacks aimed at your Google Cloud deployments. First, with the out-of-the-box (OOTB) Google Cloud Armor dashboard, you can easily visualize network security patterns, including which firewall policies have been triggered most and which source IP addresses have triggered them. Additionally, the Datadog Google Cloud Armor integration shares data with our Google Security Command Center integration—enabling you to consolidate and view a broad range of security information about your Google Cloud environment in a single dashboard. Second, aside from these benefits related to better data visualization, having ready access to security data from Google Cloud Armor within the Datadog platform enables you to improve your response to network attacks, as you can easily supplement that data with both contextual information and functionality from other Datadog features and products. Combining the benefits of Google Cloud Armor and Datadog in one place therefore helps you better investigate, analyze, detect, and remediate threats—such as attempted distributed denial-of-service (DDoS) attacks—that could compromise your application.
In this post, we’ll explore how the Google Cloud Armor integration helps you:
- Visualize Google Cloud network activity with detailed dashboards
- Improve your response to network attacks with the help of Datadog
Visualize Google Cloud network activity with detailed dashboards
Google Cloud Armor uses load balancers to log and filter incoming traffic, acting as both a firewall and a DDoS mitigation service for public applications. Because it processes critical information about inbound requests to your Google Cloud environments, Google Cloud Armor is able to automatically mitigate common threats via built-in security policies—including ones that protect against SQL injection and cross-site scripting attacks. Google Cloud Armor also keeps records about the requests it has handled, which makes it a valuable resource for engineers looking to gain insights into external threats.
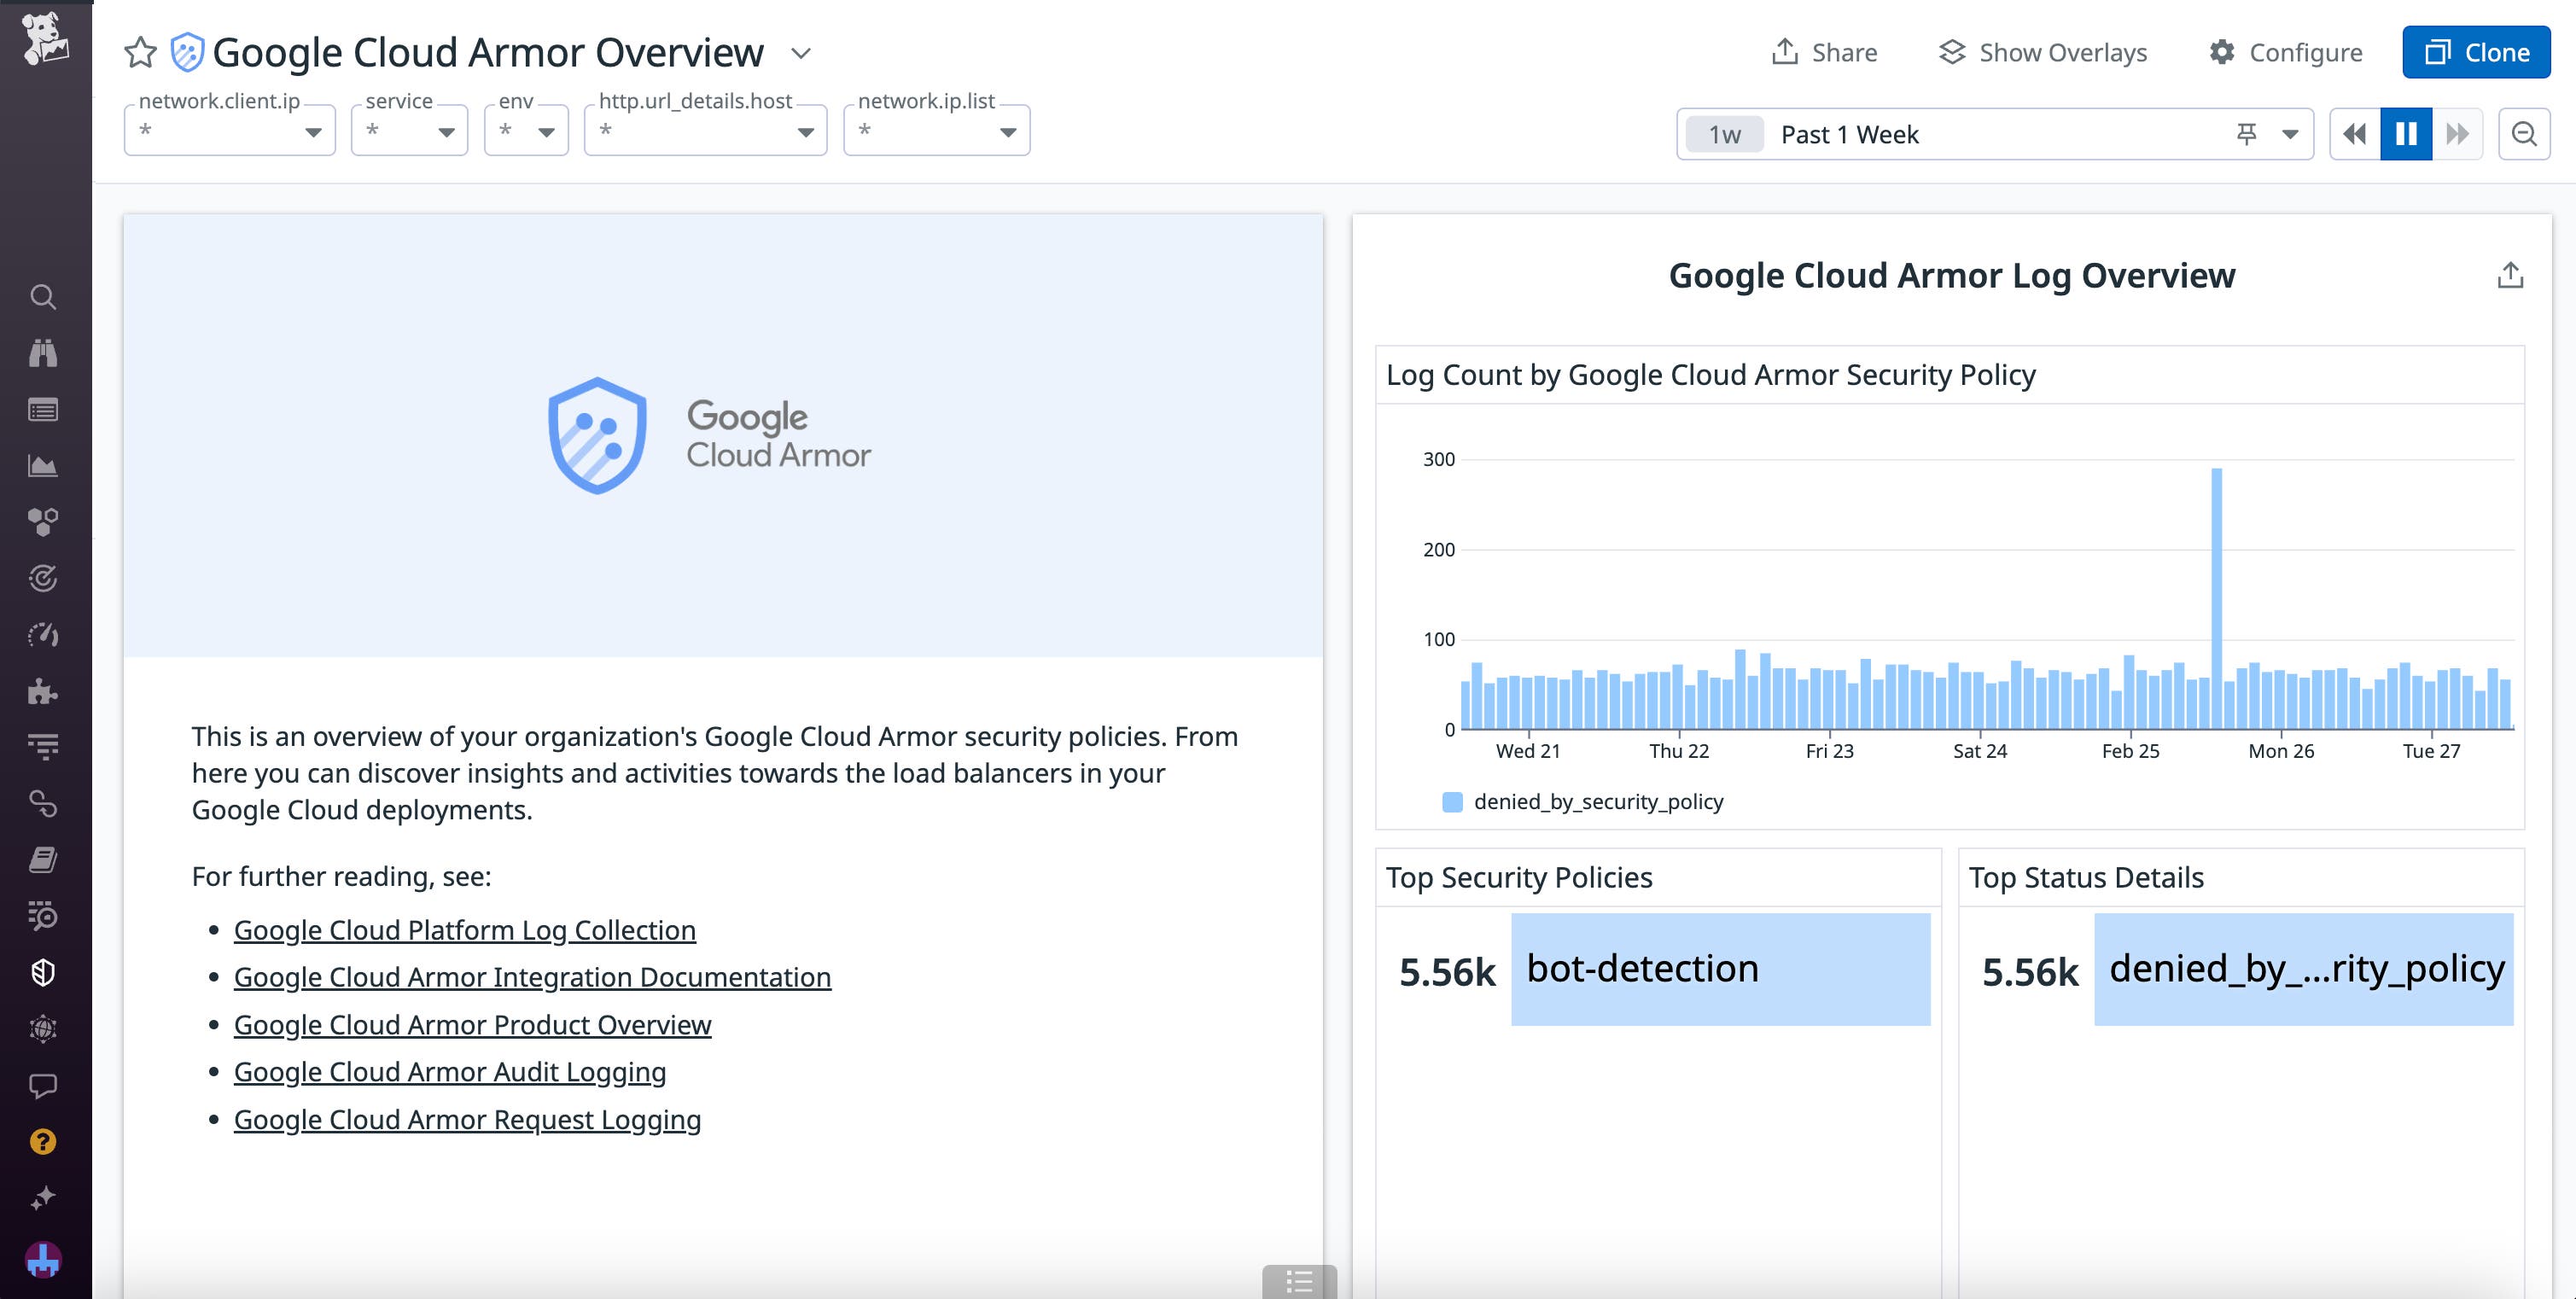
To help you visualize these insights, the new Datadog integration provides you with an OOTB dashboard that collects key findings from Google Cloud Armor, summarizing information about policy enforcements, load balancer activity, and threat intel.

On this dashboard, you can easily visualize trends in requests, IP traffic, and log counts to understand how and when your Google Cloud applications have been targeted. For example, a sudden influx of unsuccessful requests from new source IP addresses may indicate an attack from unfamiliar users, organizations, or bots. Additionally, if you have enabled Google Cloud Armor Managed Protection Plus, you can view detailed log information about Armor remediation efforts for recent or ongoing attacks, including mitigation statuses (i.e., started,ongoing, or ended).
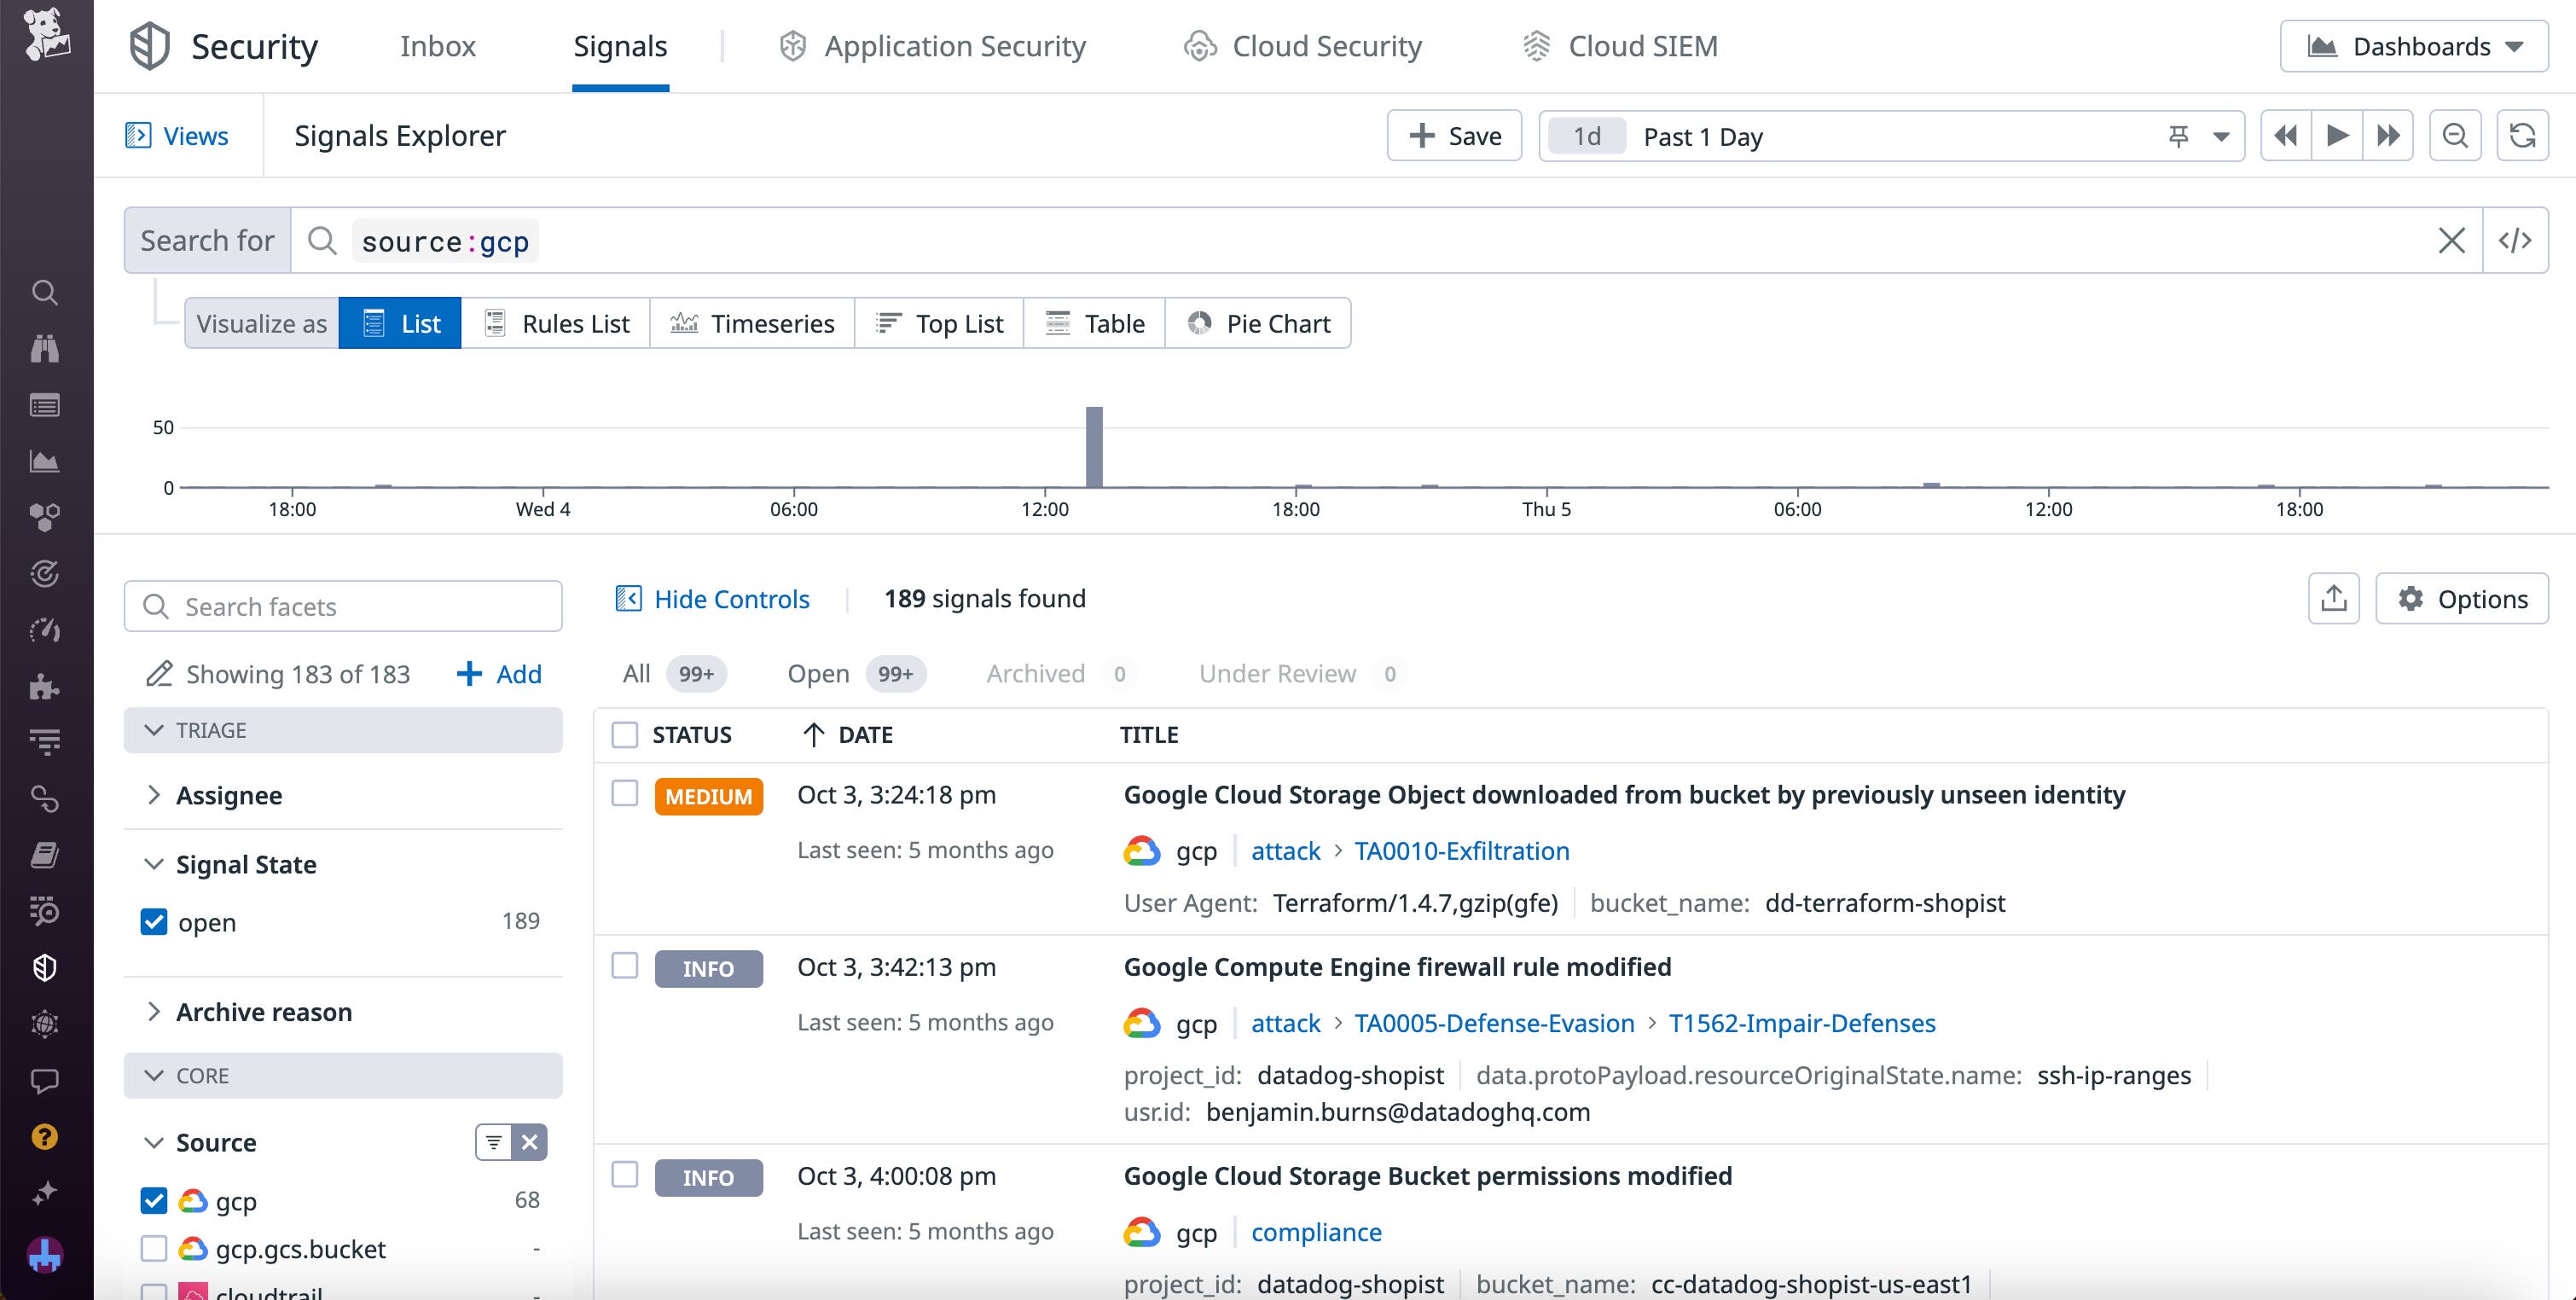
The Datadog integration also enhances a native feature related to Google Security Command Center. Google Cloud Armor data is automatically incorporated into Google Security Command Center on the Google site, and to reflect and build upon this cross-tool compatibility, Datadog includes crucial high-level metrics from Google Cloud Armor in the OOTB Google Security Command Center dashboard. Viewing your Google Cloud Armor data within Datadog’s Security Command Center dashboard enables you to visualize key indicators of network attacks—such as abnormal spikes in traffic or denied requests—alongside other discovered security concerns, such as threats, misconfigurations, and vulnerabilities. You can also view important security findings from Google Cloud Armor next to Security Command Center findings within Cloud SIEM Signals Explorer. As a result, you can assess the entire security profile of your Google Cloud ecosystem in one place and quickly determine whether incidents that appear to be isolated are actually part of larger attacks.

Improve your response to network attacks with the help of Datadog
By monitoring your network for unusual activity, such as a sudden surge in requests originating from a small set of IP addresses, Google Cloud Armor helps you detect and mitigate attacks—including DDoS campaigns—more quickly. By bringing these insights to the Google Cloud Armor dashboard in Datadog and combining them with context from the Google Security Command Center dashboard, you can investigate and analyze these attempted breaches more easily. Finally, by drawing upon additional Datadog functionality in these other features, you can even accelerate your ability to detect and remediate attacks in the future.
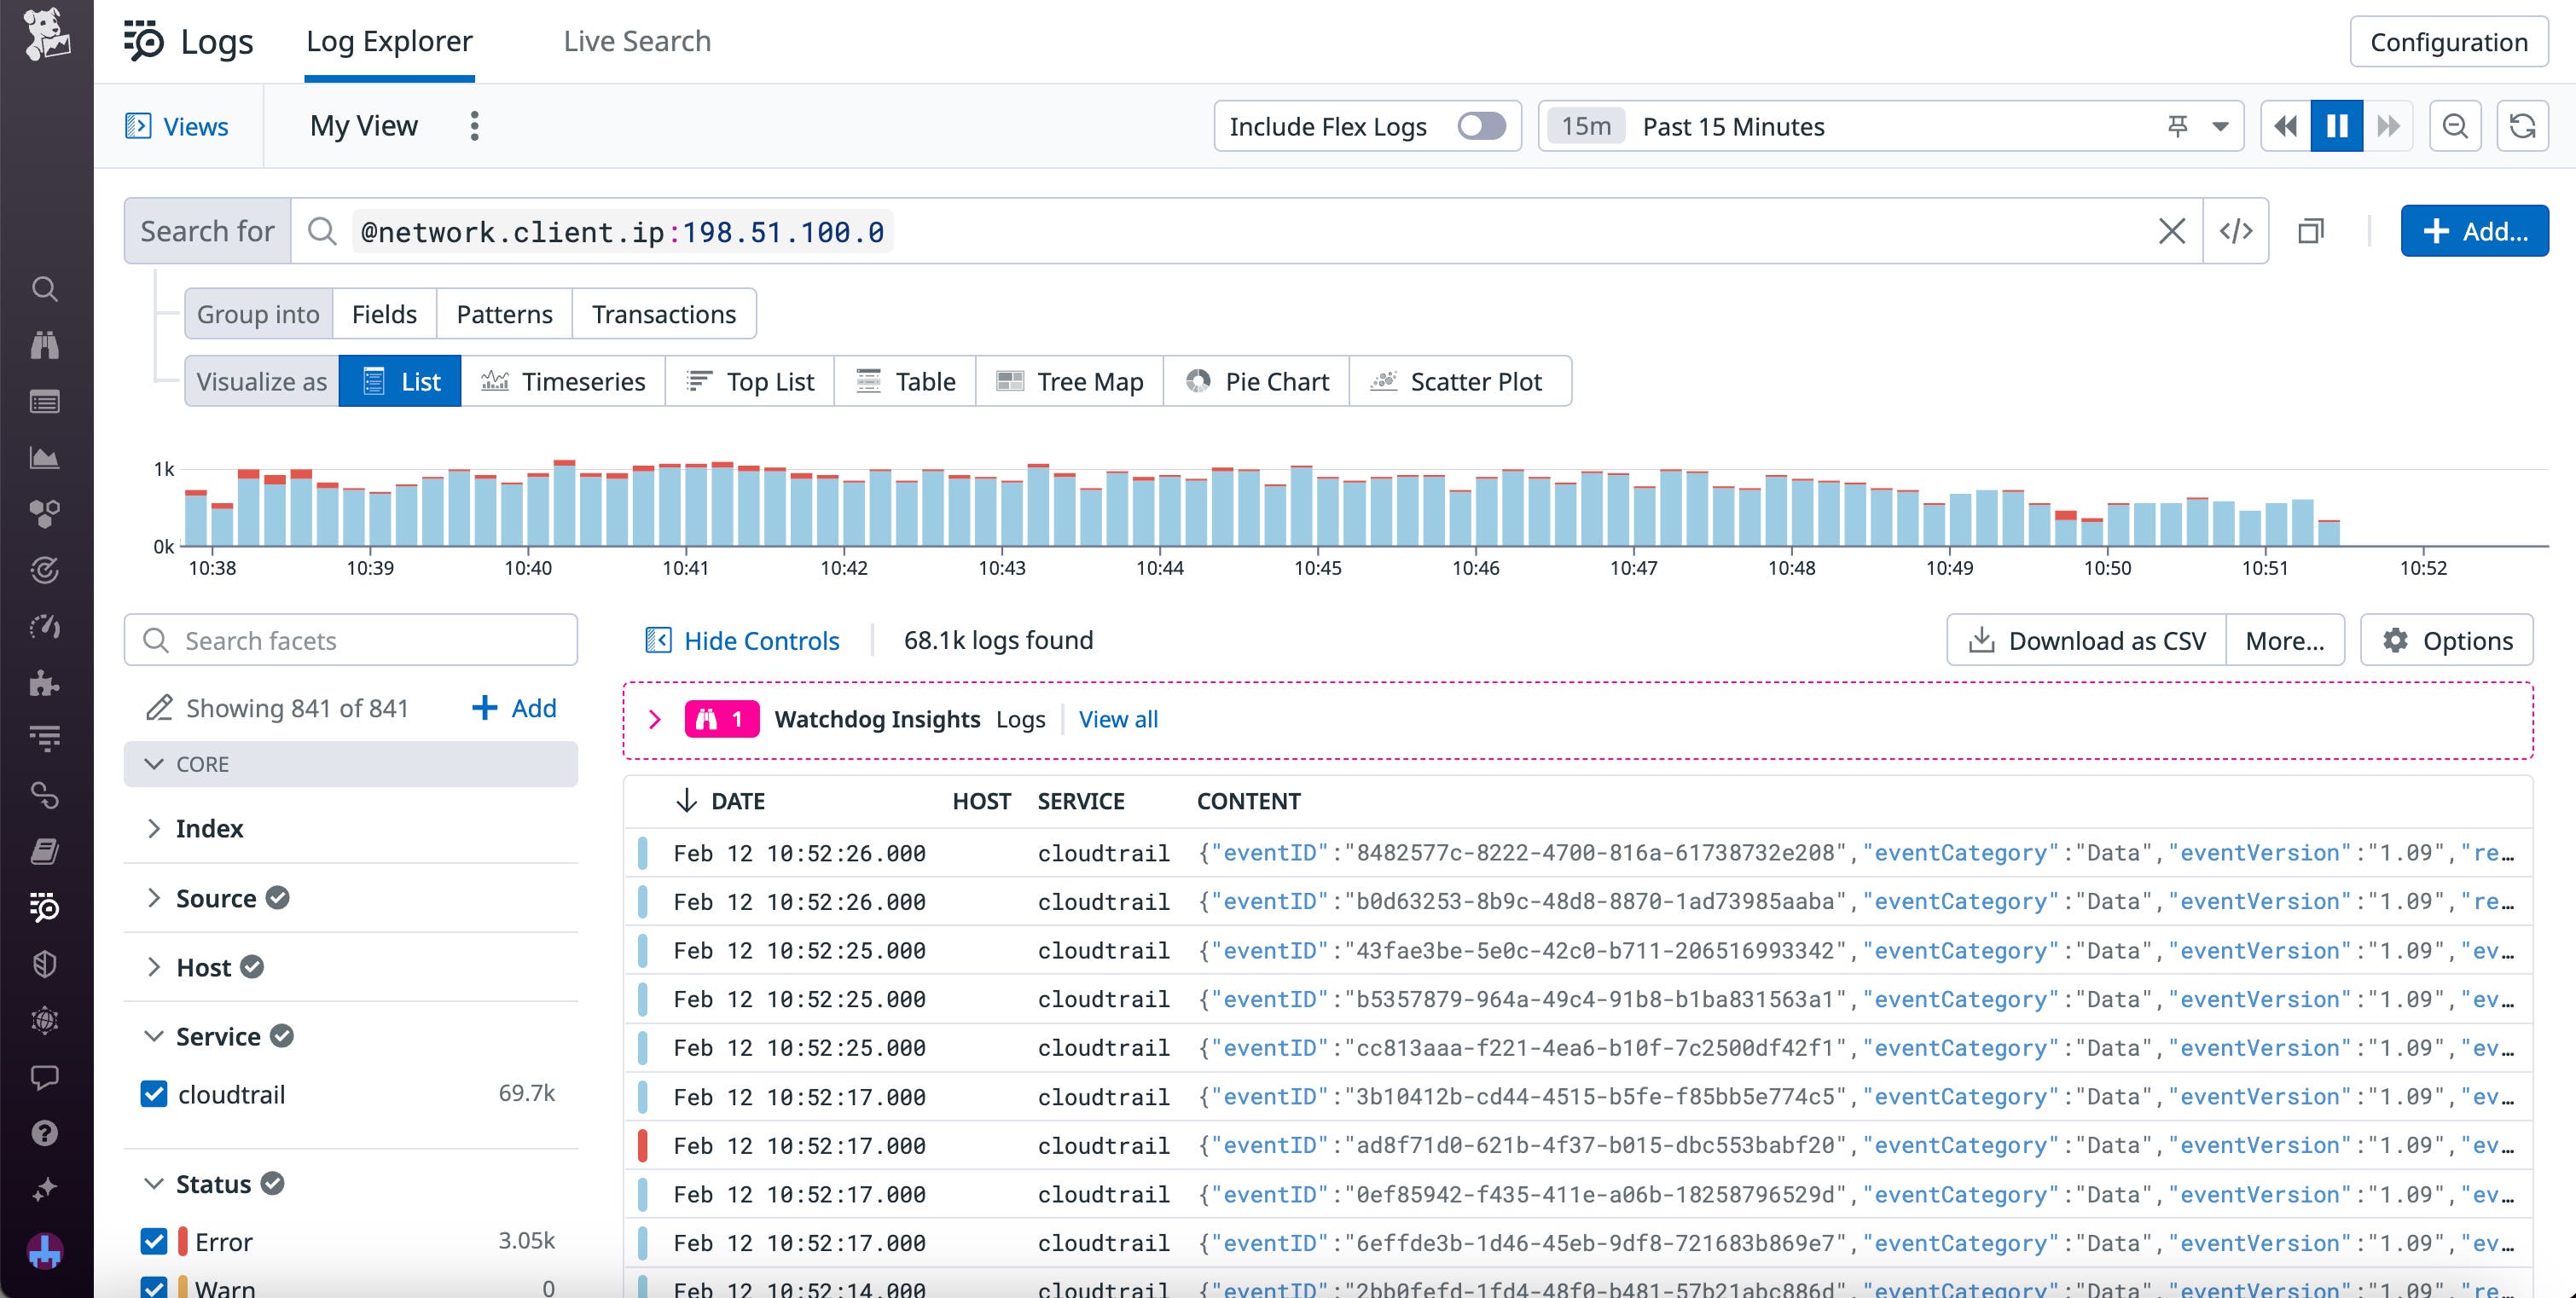
For example, let’s say you notice an increase in denied requests on the Google Security Command Center dashboard. After pivoting to the Google Cloud Armor dashboard for more information, you see that the requests mainly originate from an IP address on a known-threat list. Once you’ve identified the IP address connected to the requests, you can easily deny traffic from that address. You can then conduct further research by searching for the address in Datadog Log Management to determine when the attack started.

To quickly detect future attacks, you can also set up monitors on important Google Cloud Armor metrics. If you want to monitor the attacks themselves, you could alert on counts of denied requests. Otherwise, to ensure that Google Cloud Armor is running smoothly and handling any threats, you could set up a monitor for mitigation statuses from Armor.
Start monitoring Google Cloud Armor with Datadog today
Google Cloud Armor makes it easy to mitigate threats, including DDoS, SQL injection, and cross-site scripting attacks. With the Datadog Google Cloud Armor integration, you can quickly gain visual insights into these types of attacks and determine the next steps for your remediation efforts. Datadog also allows you to view security data from the Google Cloud Armor integration alongside contextual information, such as Log Management data—and draw upon additional Datadog functionality, such as monitors—to better research threats, protect your application, and help ensure that your defense systems are working properly.
You can use our documentation to get started with Google Cloud Armor today. Or, if you’re not yet a Datadog user, you can sign up for a 14-day free trial today.


