Geoffrey Corey
This is a guest post written by Geoffrey Corey, System Administrator at the Apache Software Foundation, a decentralized community of developers that produces more than 100 different pieces of open source software on an all-volunteer basis.
Note: The Apache community often use the terms "master/slave" when describing server architecture. Datadog does not use these terms. Within this blog post, we will refer to these as “leader” and “follower" servers.
The Apache Software Foundation has many different servers facilitating many different services across many different hosting providers. Managing these servers and services can be a daunting task in itself, let alone configuring a monitoring service to watch and report on the different bits and pieces for each server. This challenge has many times meant that setting up monitoring when deploying a service or server was on the bottom of the priority list.
What we needed
Two of the largest issues in setting up a (useful) monitoring suite were automation, and easily extracting relevant data. One of the original monitoring applications used when I first started required a rather steep learning curve to configure a set of defaults, for each server that was registered. It was clear that this software suite (while powerful) was ultimately not useful for us.
As we went looking at different monitoring and reporting suites, we laid out a very specific set of criteria if we were going to go through the effort of switching. The monitoring suite:
Should not be run by us (if at all possible)
Should be easy to deploy and set up
Should collect useful information
Should have extensibile monitoring options (i.e. can it plug in to httpd, LDAP, Puppet, etc.)
with \#2 being the largest blocker on migrating to a new monitoring suite.
Enter Datadog
Fast forward a few months and the Apache Infrastructure Team was introduced to a monitoring suite called Datadog. Since Datadog is a hosted service, it satisfied our first criteria. In less than 30 seconds Datadog was deployed on a production server, and already streaming data. It only required a class to be added to a hiera manifest, and an API key. The default set of graphs and collected data were able to cover a majority of our usage requirements. So it met our second criteria. We quickly used Datadog’s defaults to help debug a disk capacity throughput issue in one of our hosting providers, meeting the third criteria.
Finally, Datadog has pre-built integrations for httpd, LDAP, Puppet (and about 120 other technologies). Plus Datadog’s agent is open source and accepts custom metrics, so it is very extensible. So it met our fourth and final criteria, and we decided to adopt Datadog throughout Apache.
Real-world examples
Resource Abusers
We had recently implemented a new unified logging system and had implemented some rules for blocking abusive IP addresses organization wide, but it turns out that we had underestimated the amount of logging traffic we would be sending to it, and the automated banning process went down. While it was down we noticed that our main web servers had rather high load and network utilization. It turns out that someone with access to a large chunk of bandwidth was running load tests (JMeter) against our main web servers, resulting in 40 to 50 million requests from a specific IP address per day for 3 days. Had I not looked at the Datadog webui and seen the (much) higher than normal network utilization, that JMeter task could have lasted much longer and impacted our projects’ websites and also left us with a rather large bill from the hosting provider.
Backend Capacity Problems
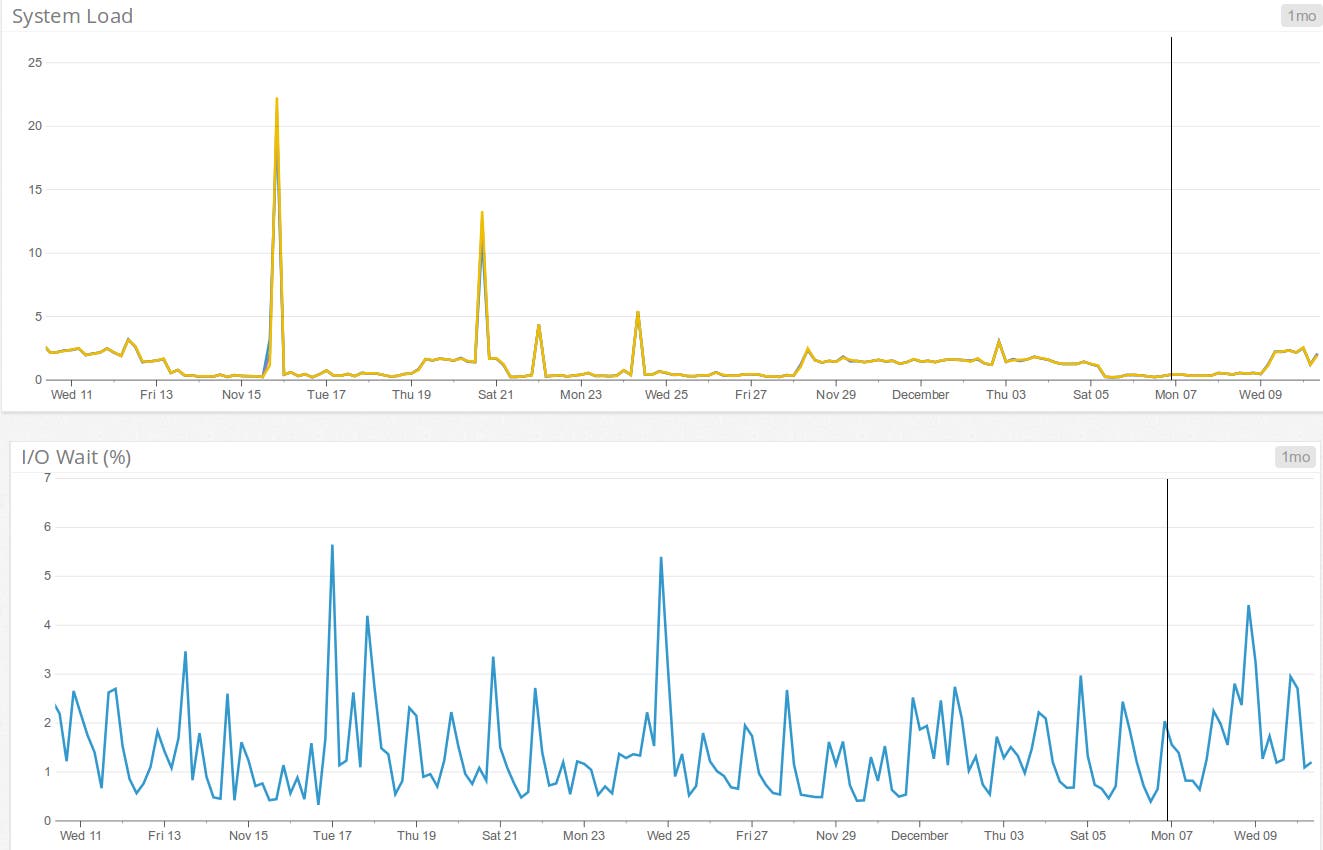
Another time, we had just deployed our main US web server in a new hosting provider, having replicated (as best as possible) all the resources from previous hosting provider. Once it had been added into DNS rotation, we noticed the load shooting to about 1000. We pulled up the Datadog webui, looking at the system information and noticed IO wait % was at 0, but had previously spiked to 100% for a period of time. We investigated on the machine to see what was causing the load, and it was our template system for downloading current releases from our mirror network.
We also then deployed our SVN leader server on this hosting provider, and noticed a similar trend on load rapidly increasing to about 1000 and IO wait percentage shooting up to 100% and then dropping (and sticking) to 0% but the load was continuing to increase. We contacted the hosting provider, and they applied some storage prioritization rules for our SVN leader, and we migrated our main US webserver to a different hosting provider more suited for this type of storage load, and the load spikes and IO wait % issues have normalized since then, only seeing load spikes when doing system backups.

RDMS Leader/Follower Replication monitoring
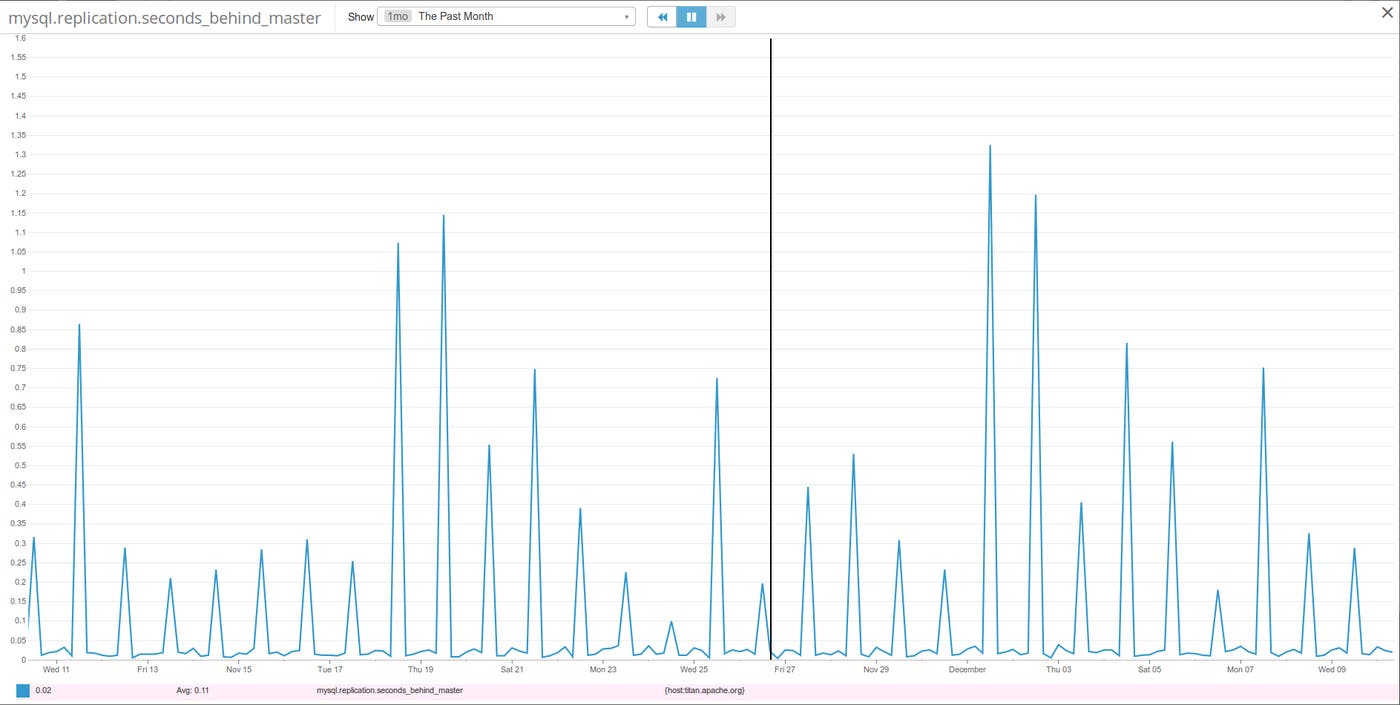
Having a leader/follower replication setup for our RDMS choices means (easier) backups. But how do we know if the follower(s) are keeping in sync? Datadog has an integration option for both Postgres and MySQL. Setting up these integrations is easy: create a user in the RDMS, give it certain permissions, and it starts logging status information. After letting it collect some information for about a week, we saw that our RDMS replication delay was very consistent, except for when the MySQL follower had to be paused in order to do a mysqldump. (*grumble*grumble*MyISAM*grumble*grumble*)

In summary
Datadog has made it extremely easy to start monitoring our servers and actually provides us with useful and actionable information that we can then correlate with issues that our users might be facing with the services provided. This has been invaluable to our work and has even allowed us to spot potential issues before they snowballed into service disruptions.

