
Kai Xin Tai
Apache Flink is an open source framework, written in Java and Scala, for stateful processing of real-time and batch data streams. Flink offers robust libraries and layered APIs for building scalable, event-driven applications for data analytics, data processing, and more. You can run Flink as a standalone cluster or use infrastructure management technologies such as Mesos and Kubernetes.
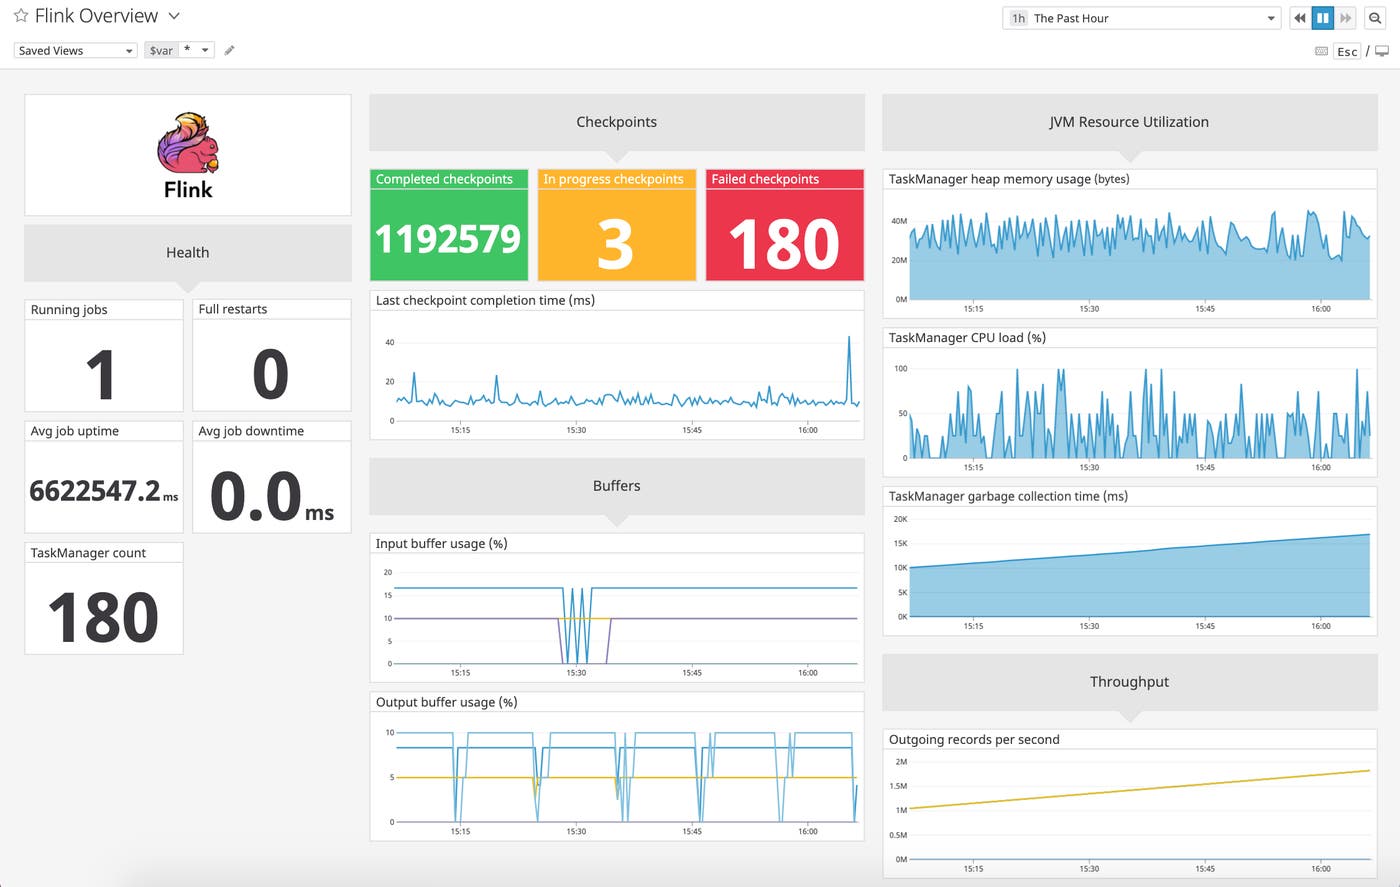
Having deep visibility into your Flink deployment is crucial to ensuring your data-streaming applications are able to run smoothly, which is why Datadog is excited to announce a new integration with Apache Flink. Once you’ve configured Flink’s Datadog HTTP Reporter to collect metrics, you can begin visualizing all your data—such as job uptime, buffer usage, and checkpoint count—in an out-of-the-box dashboard. And if you set up Flink’s Log4j logger to forward logs to Datadog, you can correlate them with metrics to effectively troubleshoot any performance issues that arise.
How Apache Flink works
Flink executes dataflow programs—which it represents using directed acyclic graphs (DAG)—that are made up of streams and transformations. Streams refer to flows of events that Flink can ingest from multiple sources, run through one or more transformation operators, and then send to output sinks. Streams can be generated by a wide range of sources, such as financial transactions, measurements from IoT sensors, and clicks on an ecommerce site. Flink is able to process both continuous flows of data (unbounded streams) in real time as well as fixed-size data sets (bounded streams) in storage.
Keep your Flink applications up and running
A fundamental concept in stream processing is state, which is the ability to retain past information to influence how future inputs are processed. Flink achieves fault tolerance by creating checkpoints to roll back to previous states and stream positions in the event of a failure. Monitoring the number of successful and failed checkpoints, along with the time taken to complete a checkpoint can help you ensure that your Flink applications are always available.
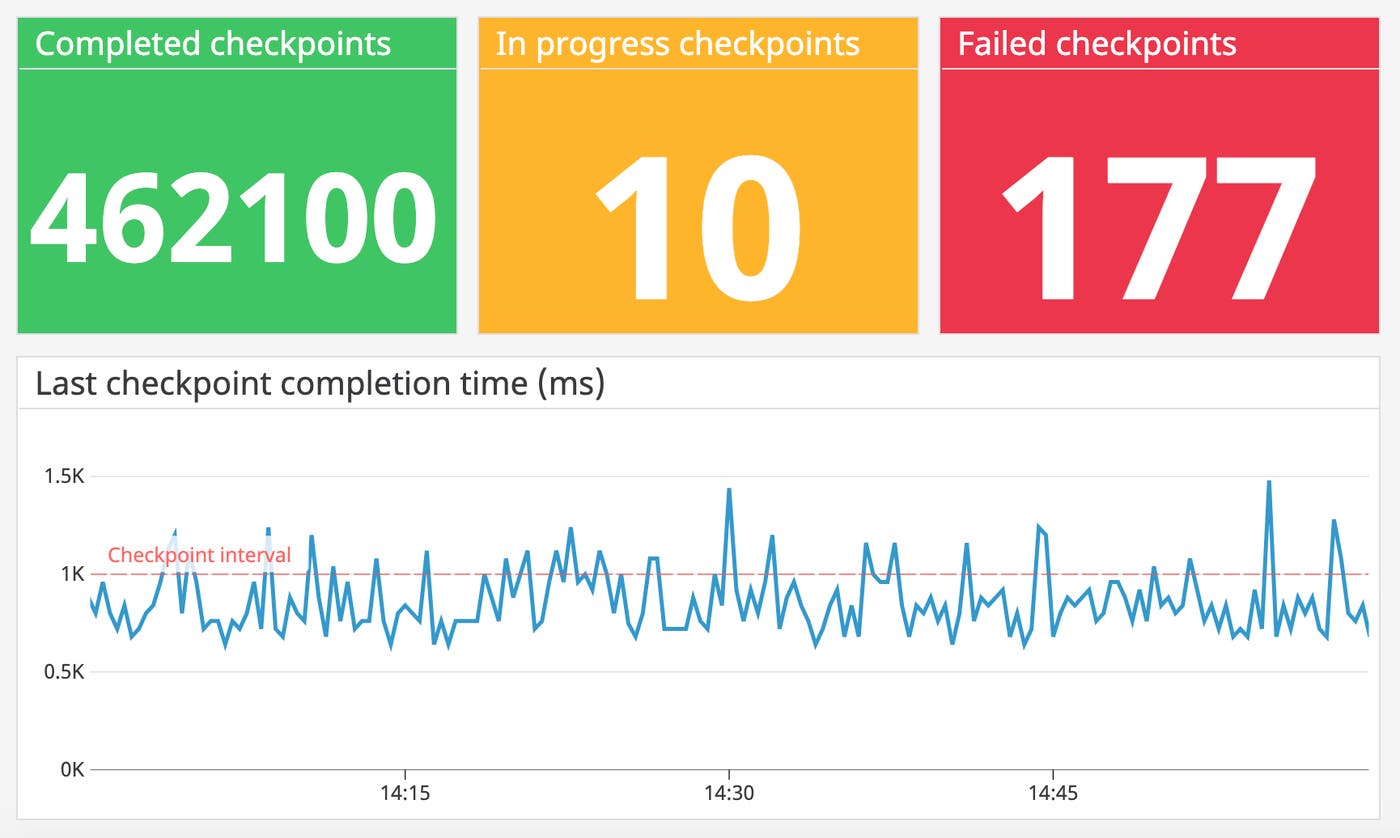
By default, Flink only allows one checkpoint creation to run at any given time. If Flink cannot complete a checkpoint within the configured interval—such as when the size of the state has grown substantially—it will not trigger the next checkpoint until the one in progress has completed. As the checkpoint queue grows, the process begins competing for resources with regular data processing, degrading application performance. Therefore, if you observe that the checkpoint completion time (flink.jobmanager.job.lastCheckpointDuration) is consistently higher than the configured interval time, you might want to consider increasing the minimum duration between checkpoints to manage the number of queued checkpoints and reduce the overhead of fault tolerance.
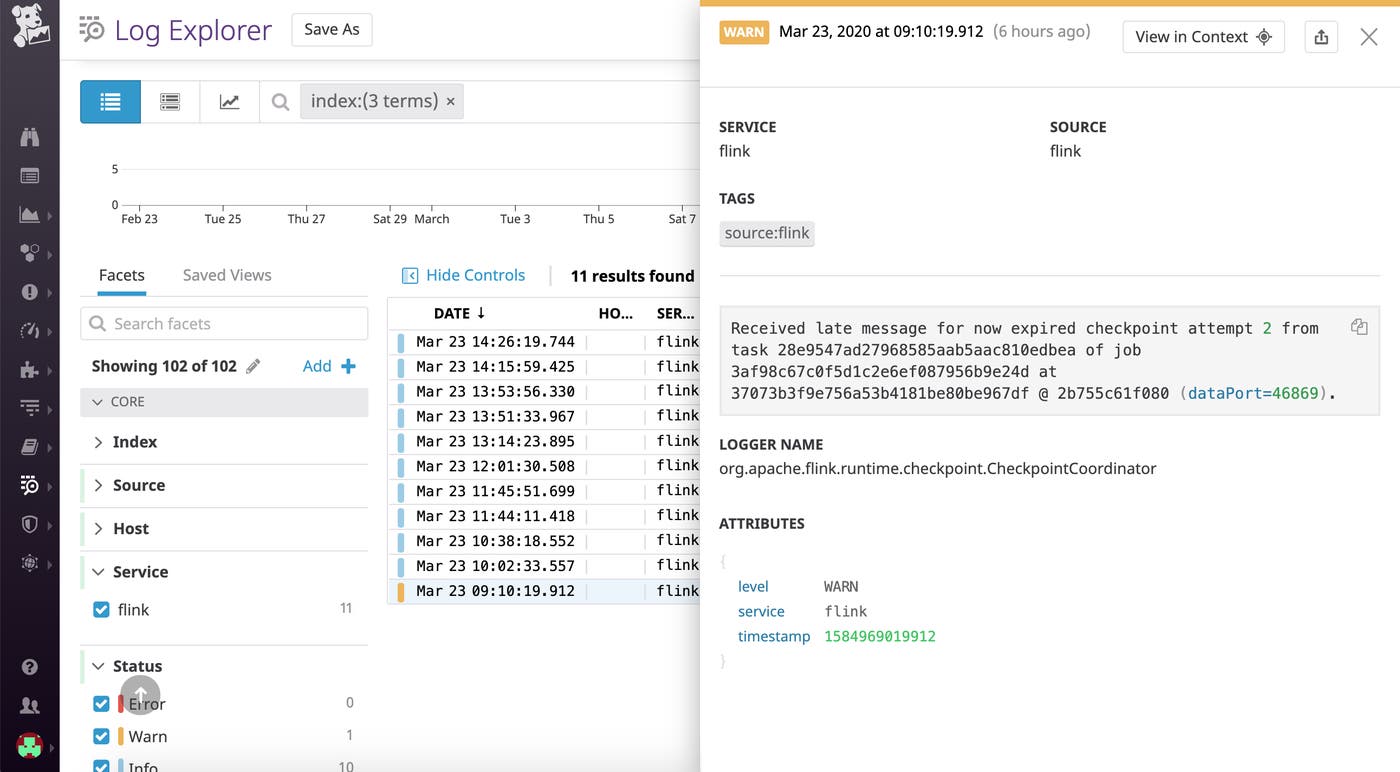
Logs from your Flink jobs can also provide valuable information that can help you troubleshoot issues with checkpointing. For example, the screenshot below shows a log generated by Flink when a long-running checkpoint times out before it is completed.
Effectively handle backpressure to ensure high performance
Flink splits data processing tasks into one or more subtasks that are processed in parallel. Rather than sending events from each subtask individually, Flink places them in buffers before sending them in batches in order to reduce overhead.
Backpressure can occur when an operator produces data faster than downstream operators can consume it. A sink (or receiver) might be processing at a slower rate due to issues such as garbage collection stalls or insufficient resources. Or, the network channel might be oversubscribed due to a spike in load.
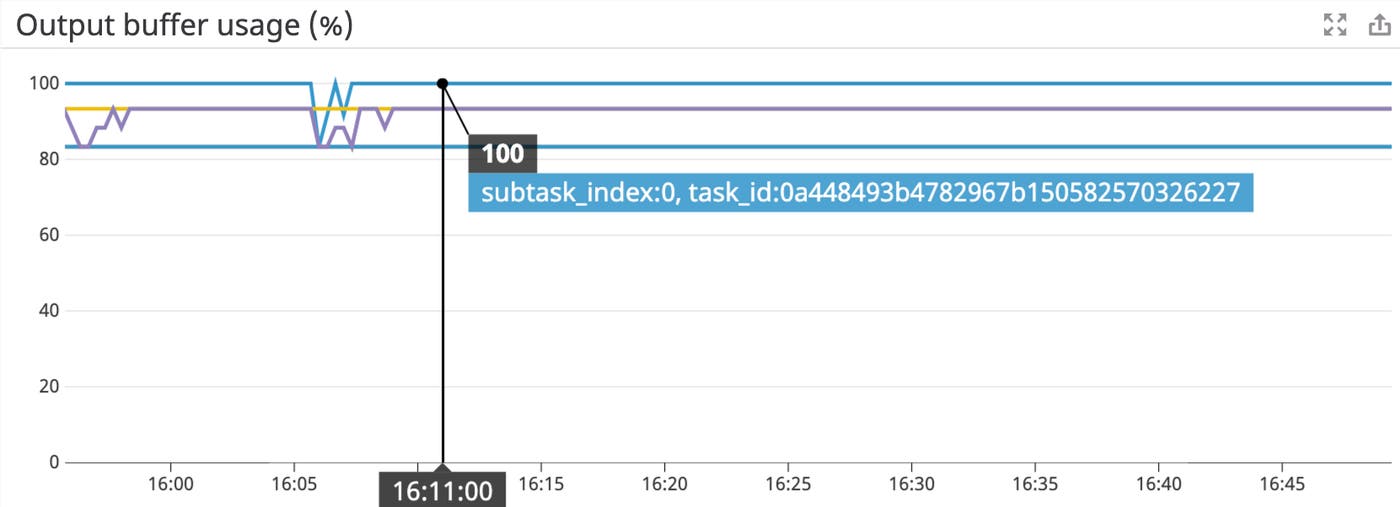
Datadog’s integration provides an overview of your Flink subtasks’ buffer pool usage to help you identify if the subtask is backpressured. For instance, if you see that all buffers sitting in a sender subtask’s output buffer pool are full (flink.task.Shuffle.Netty.Output.Buffers.outPoolUsage), as shown by 100 percent utilization in the graph above, it means that subtask is backpressured. Or, if a receiver subtask’s input buffer pool is fully exhausted (flink.task.Shuffle.Netty.Input.Buffers.inPoolUsage), it means that all buffers are in use and backpressure will likely extend upstream and affect the performance of the senders. To remediate the issue, begin by checking whether it might be caused by one of these root causes suggested by Flink so that you can take the appropriate course of action.
Alert on high JVM resource usage and address bottlenecks
Each Flink cluster has at least one JobManager and TaskManager. The JobManager coordinates job scheduling and manages resources, while the TaskManager executes each individual task in a Flink job. Datadog’s integration provides a high-level overview of JVM resource usage for your JobManagers and TaskManagers to help you identify and diagnose performance bottlenecks.
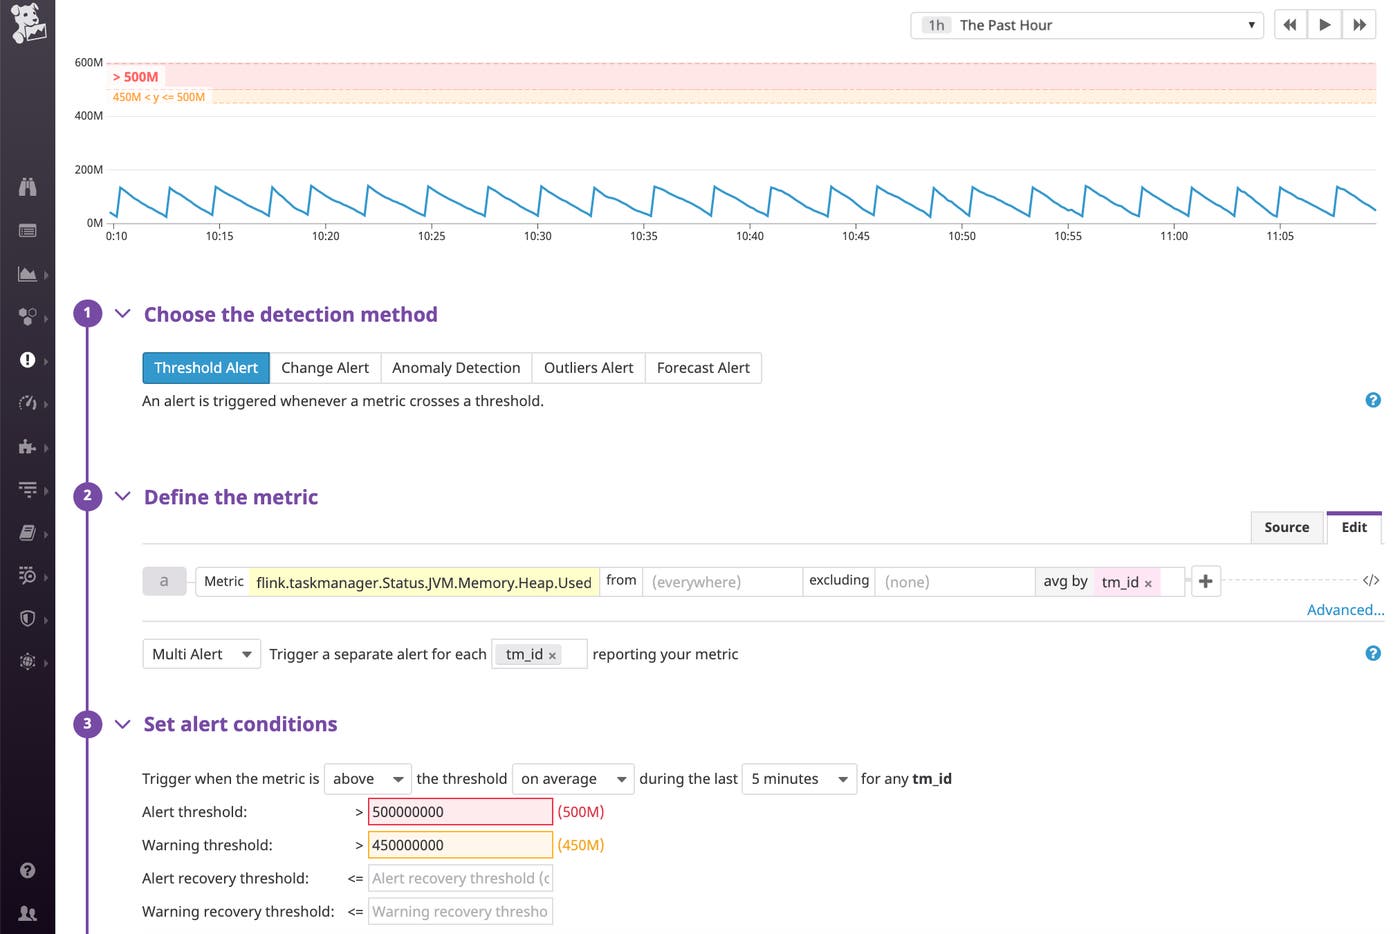
Since Flink stores state objects on the JVM’s heap, monitoring your TaskManager’s heap memory consumption (flink.taskmanager.Status.JVM.Memory.Heap.Used) can reveal whether you might need to adjust your heap size to accommodate a growing state size. With Datadog, you can easily set up a multi-alert to automatically notify you if the memory consumption of a TaskManager has exceeded a critical threshold so you can appropriately provision more resources before your streaming application slows down.
Flink’s documentation provides some suggestions on what to look for if you have a growing state.
Start monitoring Flink
With Datadog’s integration with Apache Flink, you can get comprehensive visibility into your stream processing jobs alongside other components of the Apache ecosystem like HDFS, Kafka, and YARN, and more than 1,000 other technologies. If you’re not already using Datadog, get started with a 14-day free trial.


