
Mary Jac Heuman
Databricks is an orchestration platform for Apache Spark. Users can manage clusters and deploy Spark applications for highly performant data storage and processing. By hosting Databricks on AWS, Azure or Google Cloud Platform, you can easily provision Spark clusters in order to run heavy workloads. And, with Databricks’s web-based workspace, teams can use interactive notebooks to share datasets and collaborate on analytics, machine learning, and streaming in the cloud.
Cluster configuration and application code can have a massive impact on Spark’s ability to handle your Databricks jobs. Datadog's Databricks integration unifies infrastructure metrics, logs, and Spark performance metrics so you can get real-time visibility into the health of your nodes and performance of your jobs. This helps you identify, for instance, if there isn’t enough memory allocated to clusters, or if your method of data partioning is inefficient for your dataset. In this article, we’ll show how you can deploy Datadog to your Databricks clusters to monitor for job failures and make informed decisions for optimization in Databricks.
Deploy Datadog to your clusters
You can run code in Databricks by creating a job and attaching it to a cluster for execution. You can schedule jobs to execute automatically on a temporary job cluster, or you can run them manually using a notebook attached to an all-purpose cluster, which can be restarted to re-run jobs.
Datadog provides a script you can run in a notebook to generate an installation script to attach to a cluster. This script will then install the Agent on that cluster when it starts up. You can choose to install the Agent on all nodes, including every worker, or just the cluster’s driver node, depending on your use case. The Agent will populate an out-of-the-box dashboard with detailed system metrics from your cluster infrastructure as well as event logs and Spark metrics via Datadog's Spark integration. This helps you easily track the health of your Databricks clusters, fine-tune your Spark jobs for peak performance, and troubleshoot problems.
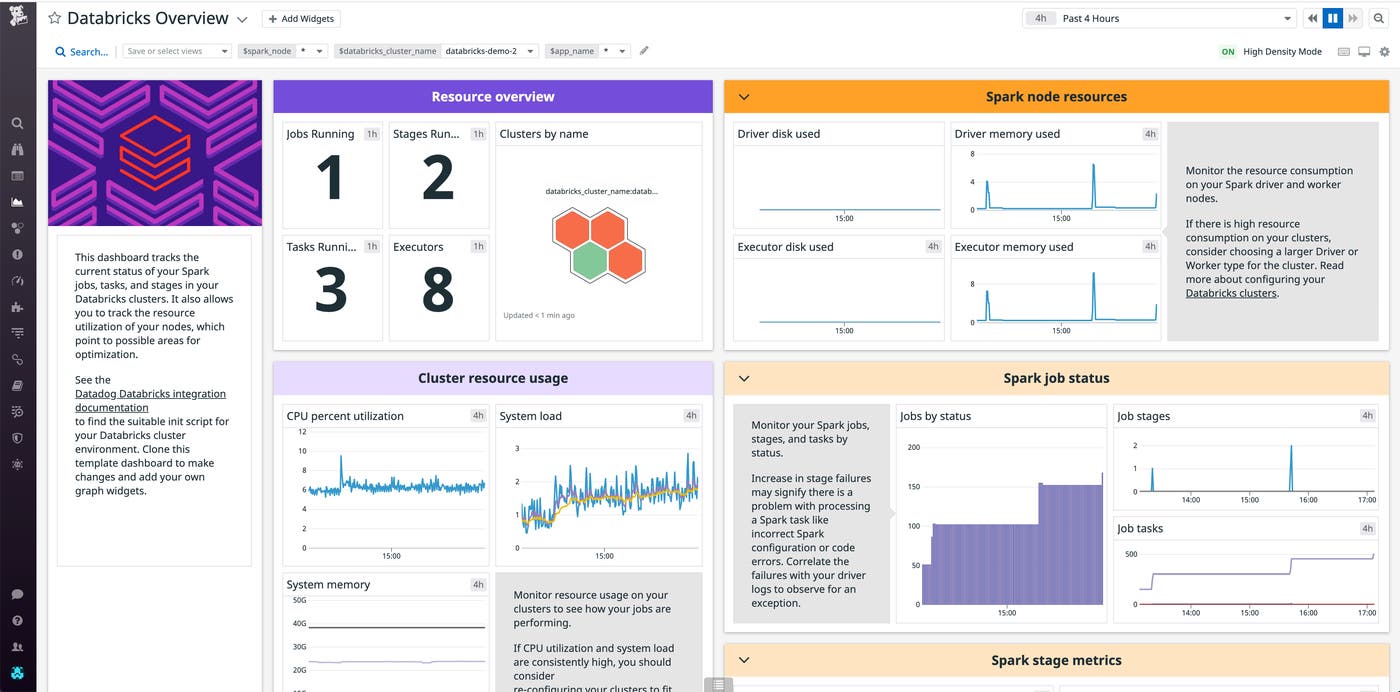
Get a complete view of your Databricks clusters
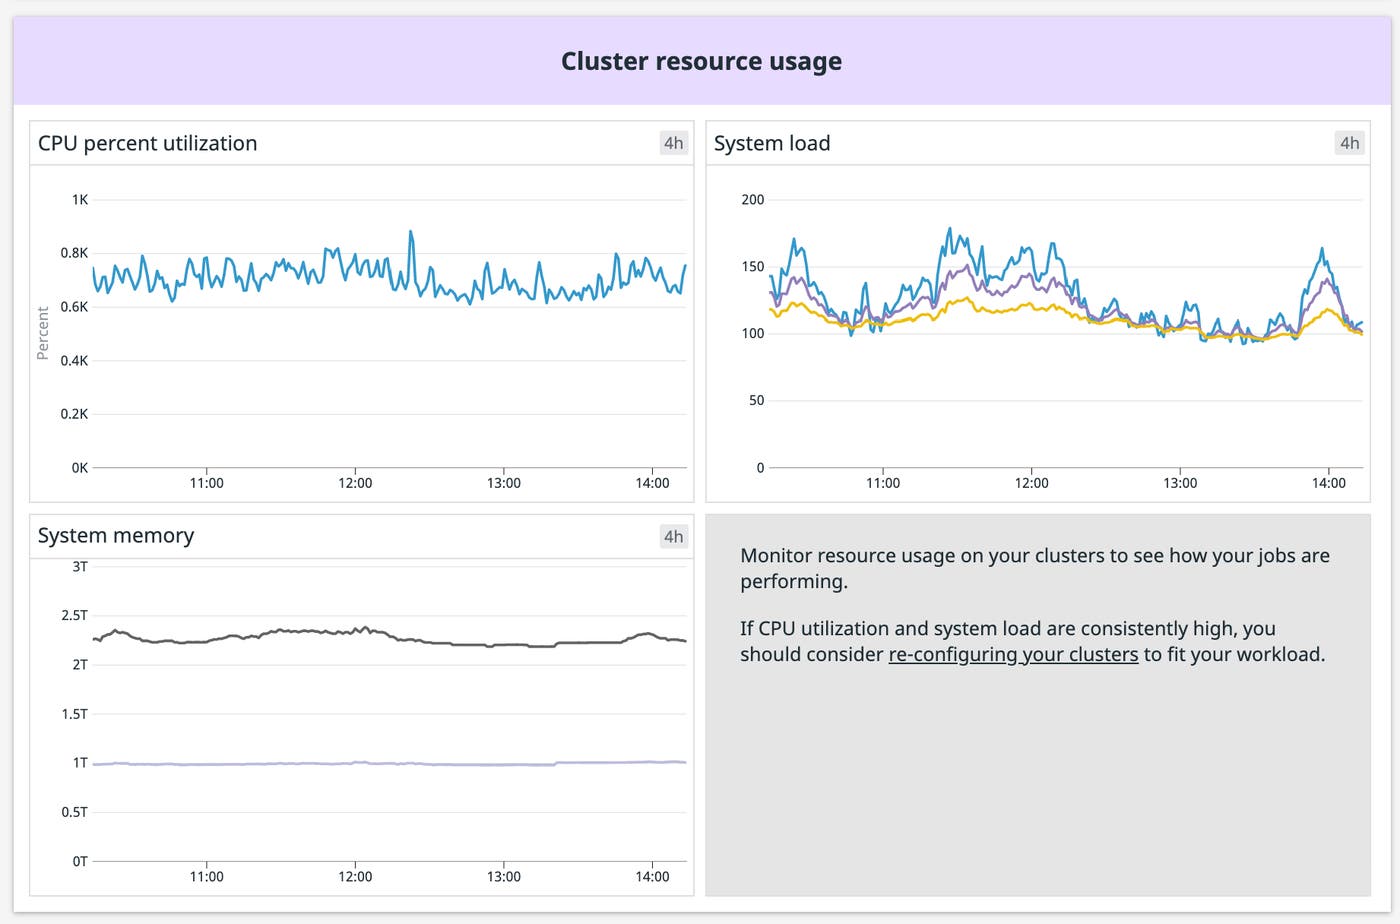
Databricks provisions clusters using your cloud provider's compute resources. Monitoring infrastructure resource metrics from your Databricks clusters like memory usage and CPU load is crucial for ensuring your clusters are correctly sized for the jobs you’re running. Datadog collects resource metrics from the nodes in your clusters and automatically tags them with the cluster name, letting you examine resource usage across specific clusters to see if they're properly provisioned to handle the job you've assigned to them. This helps you make decisions when re-running jobs on temporary clusters. If you see, for instance, that a job is consistently using most of a cluster's memory, you could scale up that cluster’s available memory for the next run, or look at ways to optimize the code you are running. You could even use anomaly detection to create a monitor that alerts you if it predicts abnormal CPU usage based on previous job runs.
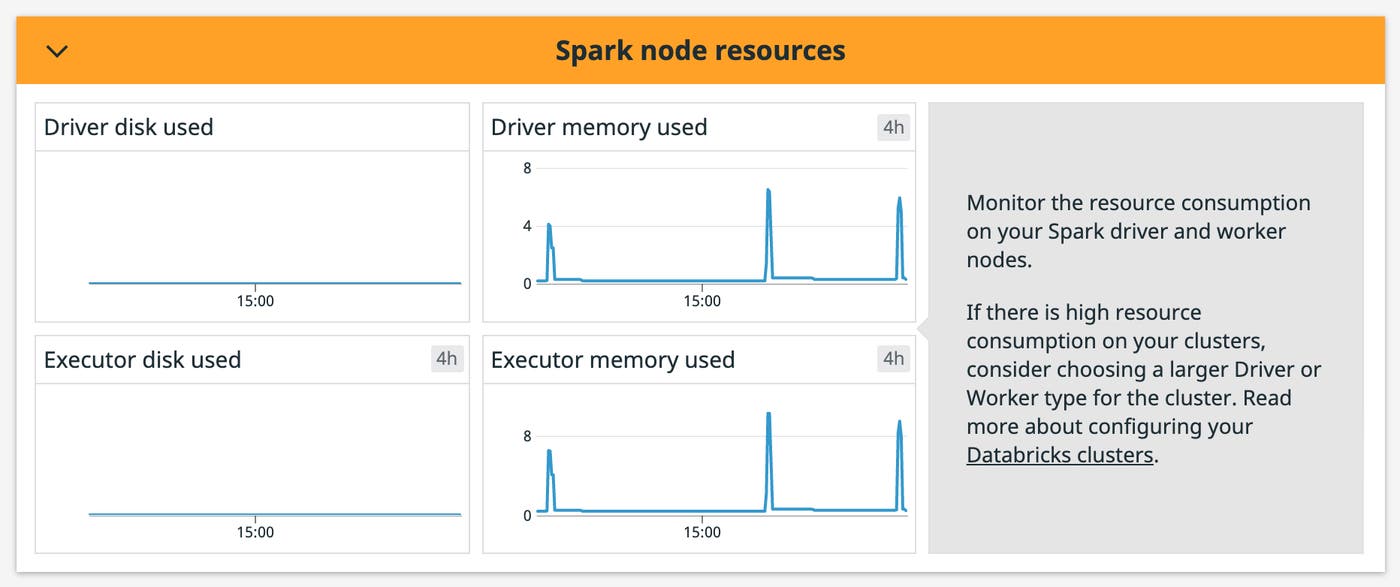
In addition to cluster-level metrics, monitoring resource usage across your individual driver and executor nodes can help you spot problems and understand why jobs stall or fail. Datadog collects and visualizes resource metrics from driver and worker nodes, which can help you identify memory leaks to help ensure, for example, that memory management processes like garbage collection are working as expected. You can also filter the dashboard by the spark-node tag to see the metrics from a particular node.
Monitor Spark metrics jobs to fine-tune performance
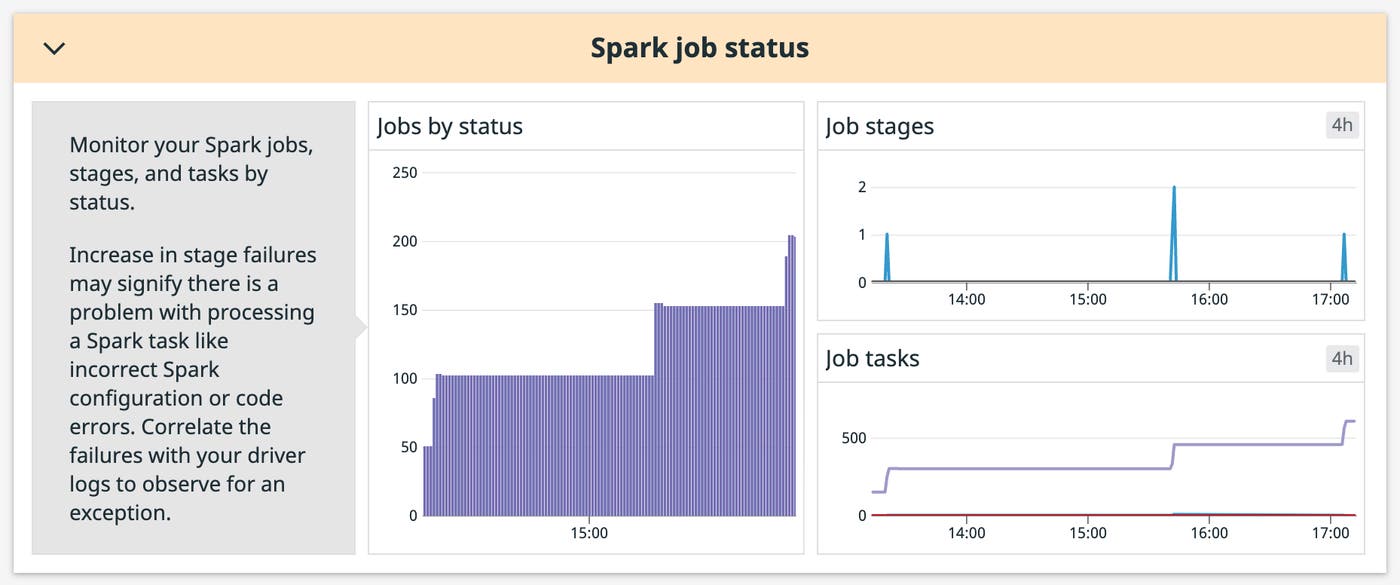
A cluster's driver node runs each job in scheduled stages. Individual stages are broken down into tasks and distributed across executor nodes. Datadog's Spark integration collects detailed job and stage metrics so you can get granular insight into job performance at a glance. For instance, you can break down the spark.job.count metric by status (successful, pending, or failed) to see in real-time if a high number of jobs are failing, which could indicate a code error or memory issue at the executor level.
Visualizing the number of jobs can also help you make decisions for provisioning clusters in the future. For example, you can correlate task and stage counts with resource usage across your nodes to see if both are consistently low, which could indicate that you’ve overprovisioned your cluster for the type of job it’s running.
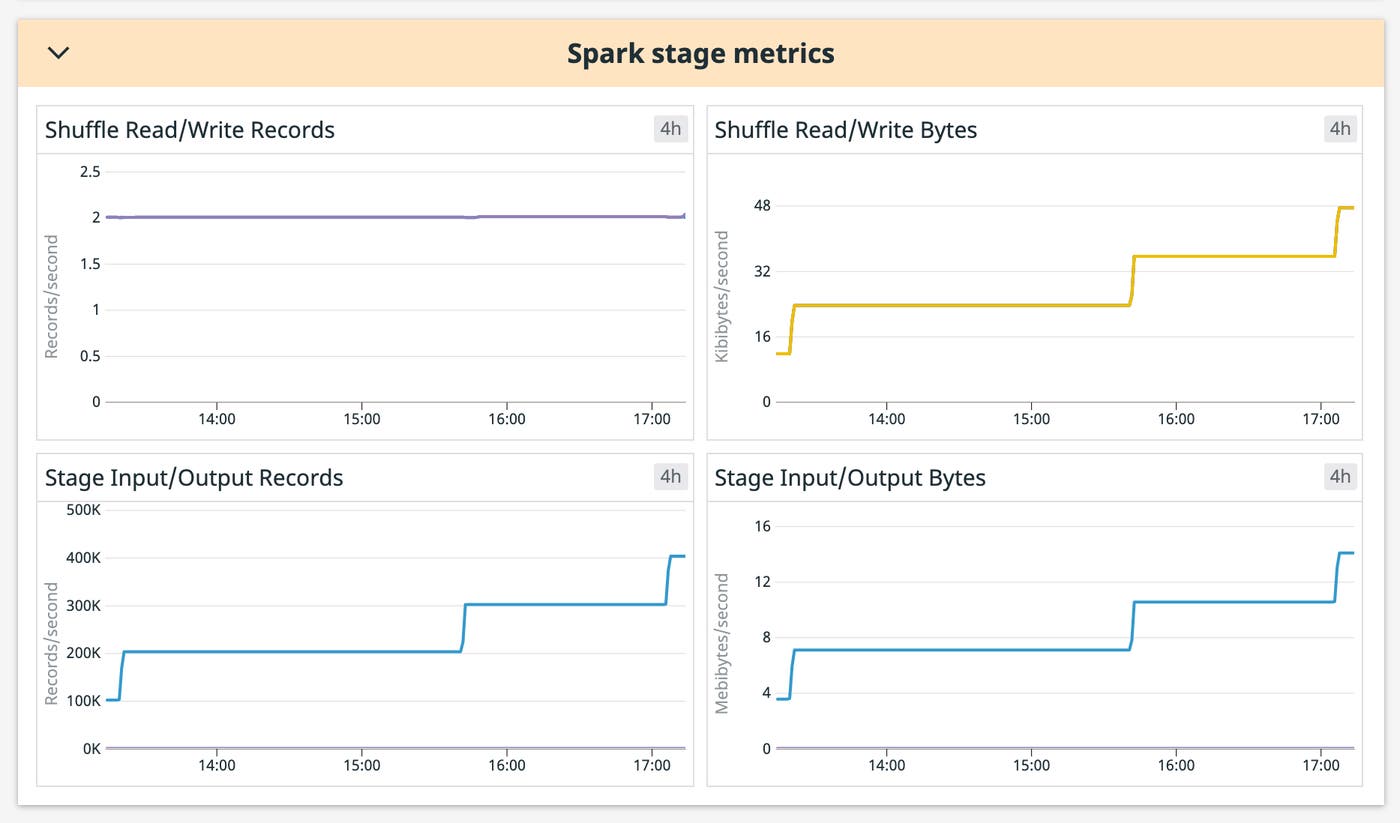
Along with the status of jobs, it’s important to monitor resource metrics at the stage level to understand how Spark is processing your data. A stage represents a set of similar computing tasks needed to run a job, which is organized by the driver node for parallel execution across worker nodes. Each worker node stores a chunk of your data to process as a partition. When an operation requires data from different workers, Spark triggers a shuffle to redistribute the data across nodes. Datadog also collects metrics on stage and shuffle operations that can help you locate the source of memory exceptions and avoid performance degradation.
Shuffle operations are particularly expensive because they require copying data across the network between nodes. If you’re processing a large dataset in Databricks, node size and proper partitioning are key to minimize the amount of shuffling required to complete data operations. You can use Datadog to monitor the amount of data shuffled as you make changes to your code and tune shuffle behavior to minimize the impact on your future job runs.
Use logs to debug errors
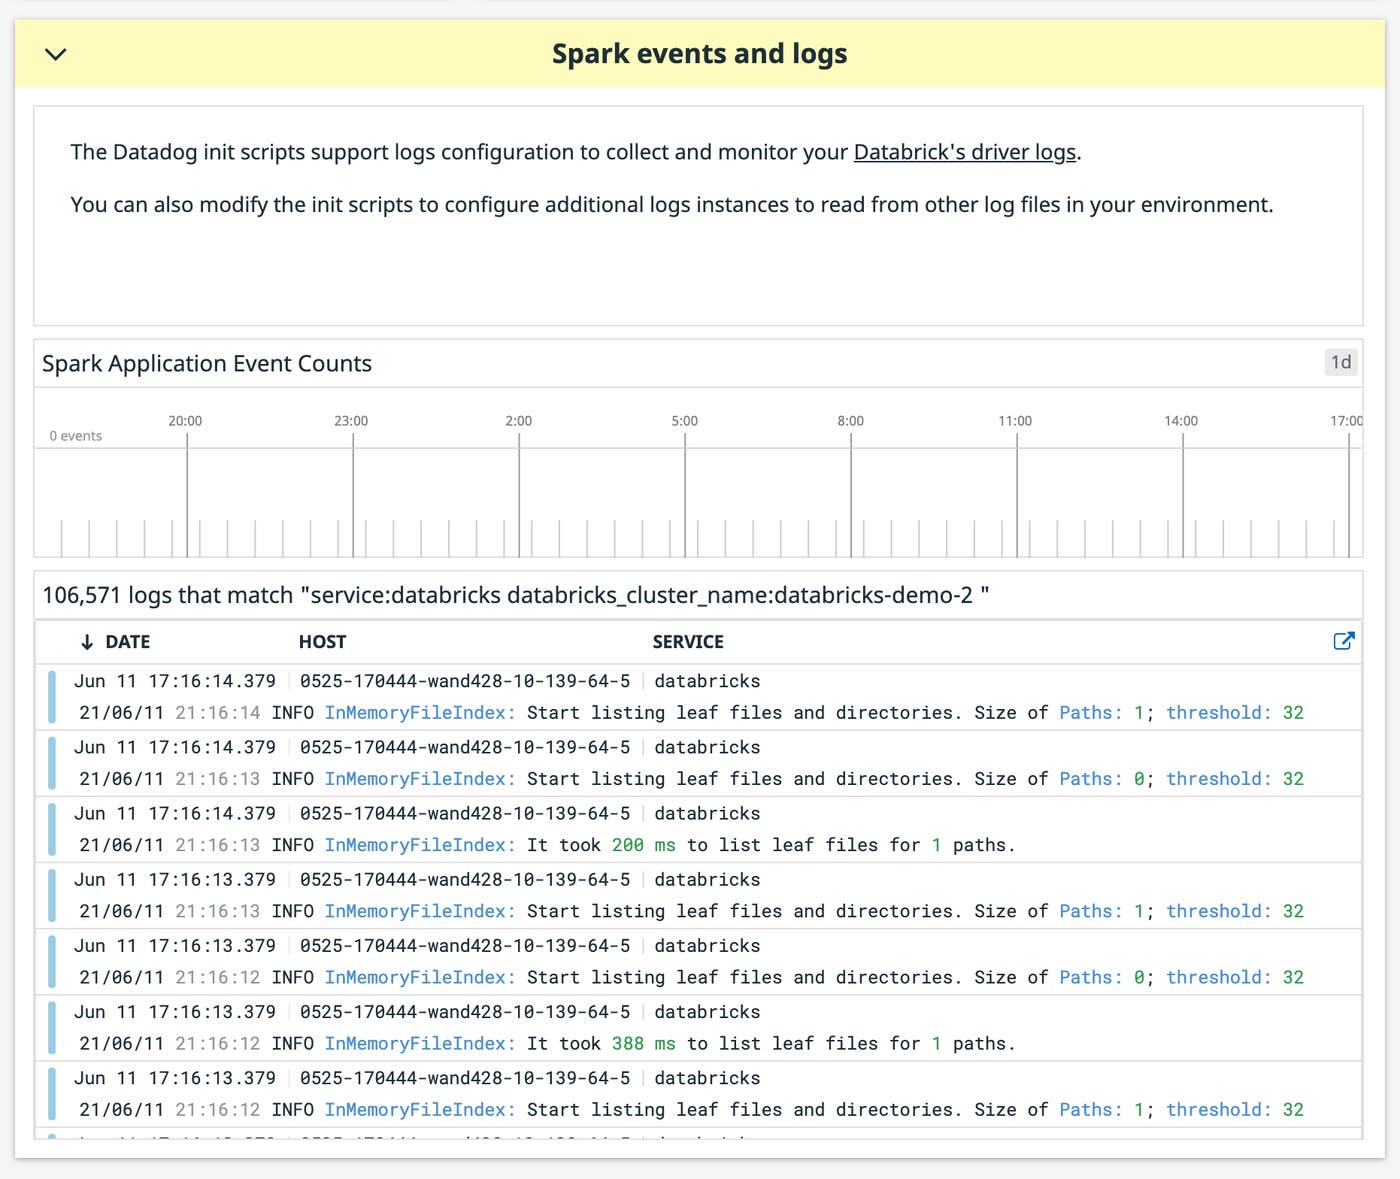
Logs from your Databricks clusters can provide additional context that can help you troubleshoot issues. Datadog can ingest system and error logs from your driver and executor nodes. This allows you to correlate node exceptions with performance metrics in order to identify causal relationships.
For example, if your driver node reports a job failure, you can inspect worker logs to see if one of them logged an exception. If a node logged an OutOfMemory exception, you can filter for that node on the dashboard to see its memory and disk usage at the moment when the error occurred. As you make changes to your cluster configuration, such as re-partitioning or increasing worker memory, you can then watch nodes in real-time to see if the changes are having the desired effect.
Start monitoring Databricks today
Datadog’s Databricks integration provides real-time visibility into your Databricks clusters, so you can ensure they’re available, appropriately provisioned, and able to execute jobs efficiently. For more information on how to get started with our Databricks integration, check out our documentation, Or, if you’re new to Datadog, get started with a 14-day free trial.

