Prashant Jain

Bowen Chen
To get visibility into highly distributed applications, organizations often use various tracing tools that are best suited to each individual service owner’s specifications. However, when a request travels between services that have been instrumented with different tools, the trace data may be formatted differently, resulting in broken traces.
W3C Trace Context aims to address this problem by defining a standardized format for unifying trace data from distributed tracing solutions. We’re pleased to announce that Datadog APM, Serverless, Synthetic Monitoring, and Real User Monitoring (RUM) now provide out-of-the-box support for W3C Trace Context. This enables you to view a complete trace as it propagates from its root to terminal service, as long as services along its request path are instrumented with distributed tracing solutions that conform to the W3C standard. In addition to Datadog’s tracing libraries, this includes OpenTelemetry (OTel) libraries, Jaeger, and other vendors.
In this post, we’ll walk through the challenges of propagating traces across distributed systems and how W3C Trace Context can help improve the observability of your applications. We’ll also discuss how correlating traces with W3C Trace Context can enhance troubleshooting in various Datadog products.
Challenges of tracing highly distributed applications
To understand how vendor-specific trace formats can lead to broken traces, we need to take a closer look at how distributed tracing works. When a service that has been instrumented for tracing processes a request, its tracer will record how the service interacts with the request and encode this contextual data into an HTTP header. This header is then passed along to subsequent services and platforms as the request travels downstream. Each tracing tool may use a different header format for encoding trace data (e.g., Datadog employs its own proprietary format, while Zipkin uses the B3 format), as shown in the diagram below.

As the request travels downstream from Service A to B to C, each tracing tool needs to incorporate its own contextual trace data with the incoming data and then forward this combined data to the next service. But if these services are instrumented with tracing tools that use incompatible headers, the trace data cannot properly propagate across services. This results in separate traces with missing spans, rather than a single trace that visualizes the complete request with spans from each service.
Standardized trace context with W3C and Datadog
W3C Trace Context enables teams to gain full visibility into their services when instrumenting them with multiple tools. The Trace Context specification splits trace context data into two headers: traceparent and tracestate.
traceparent contains all the necessary fields for propagating trace context in a common format to support interoperability between tracing tools. This includes a unique 128-bit trace ID for the distributed trace and the ID of the parent span. Using these identifiers,traceparent is able to position the given trace in relation to the incoming request and then propagate this data downstream to the next service.
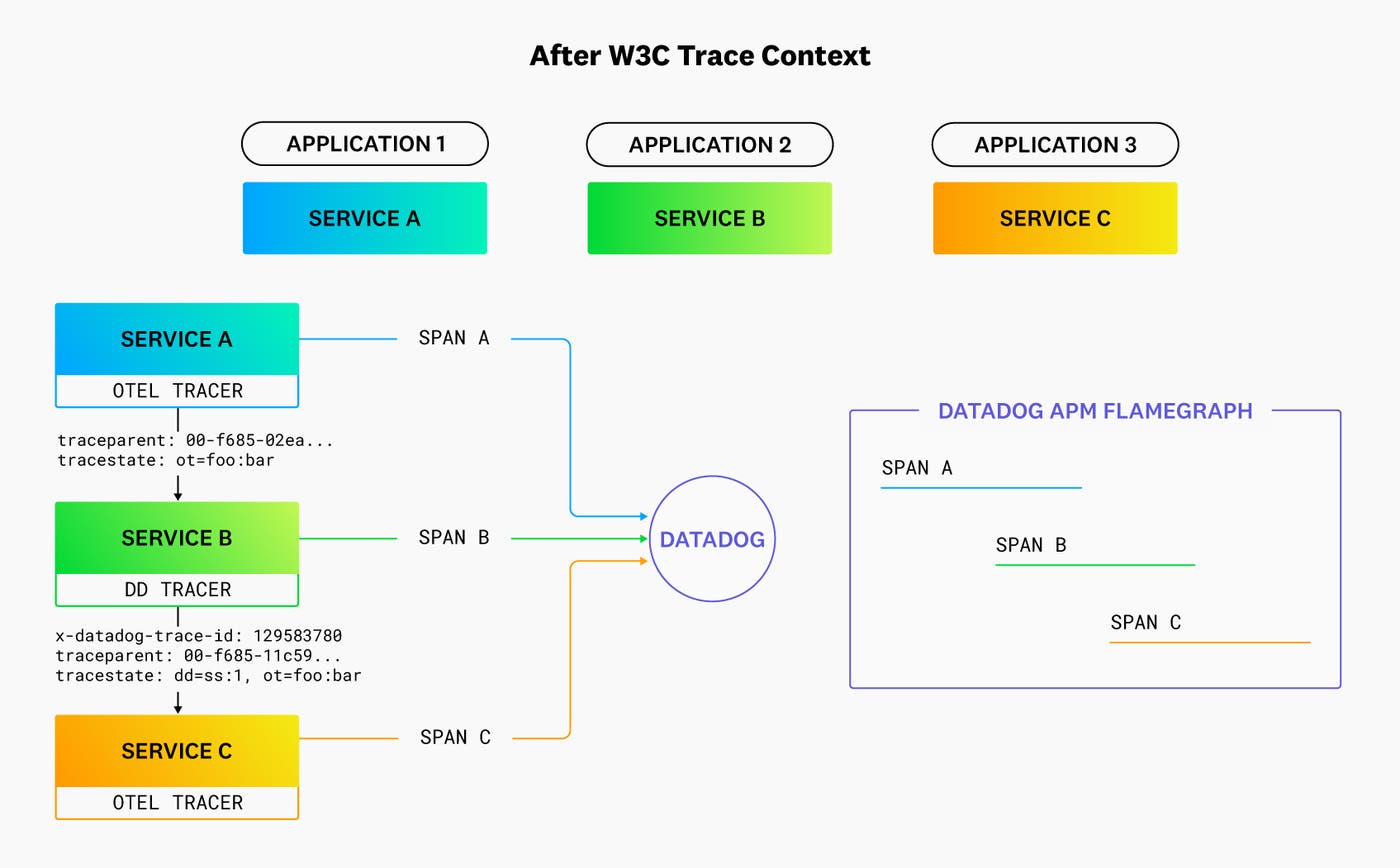
tracestate is an optional header that can be used to propagate vendor-specific information. When a trace propagates between two services that have been instrumented with different vendors, each service’s vendor-specific data will be appended to the existing tracestate, as shown in the diagram below.

With the introduction of W3C Trace Context support, Service B is now able to successfully receive the incoming trace header from Service A. It constructs a new tracestate header by adding its own vendor-specific ID to the previous header. It also constructs a new traceparent header with the same hyphenated trace ID value (shown as f685 in the diagram) and a different parent ID. By default, Datadog generates 128-bit trace IDs to fully support W3C Trace Context standards, but we will also continue to support 64-bit trace IDs in order to maintain compatibility with environments that use a mix of both.
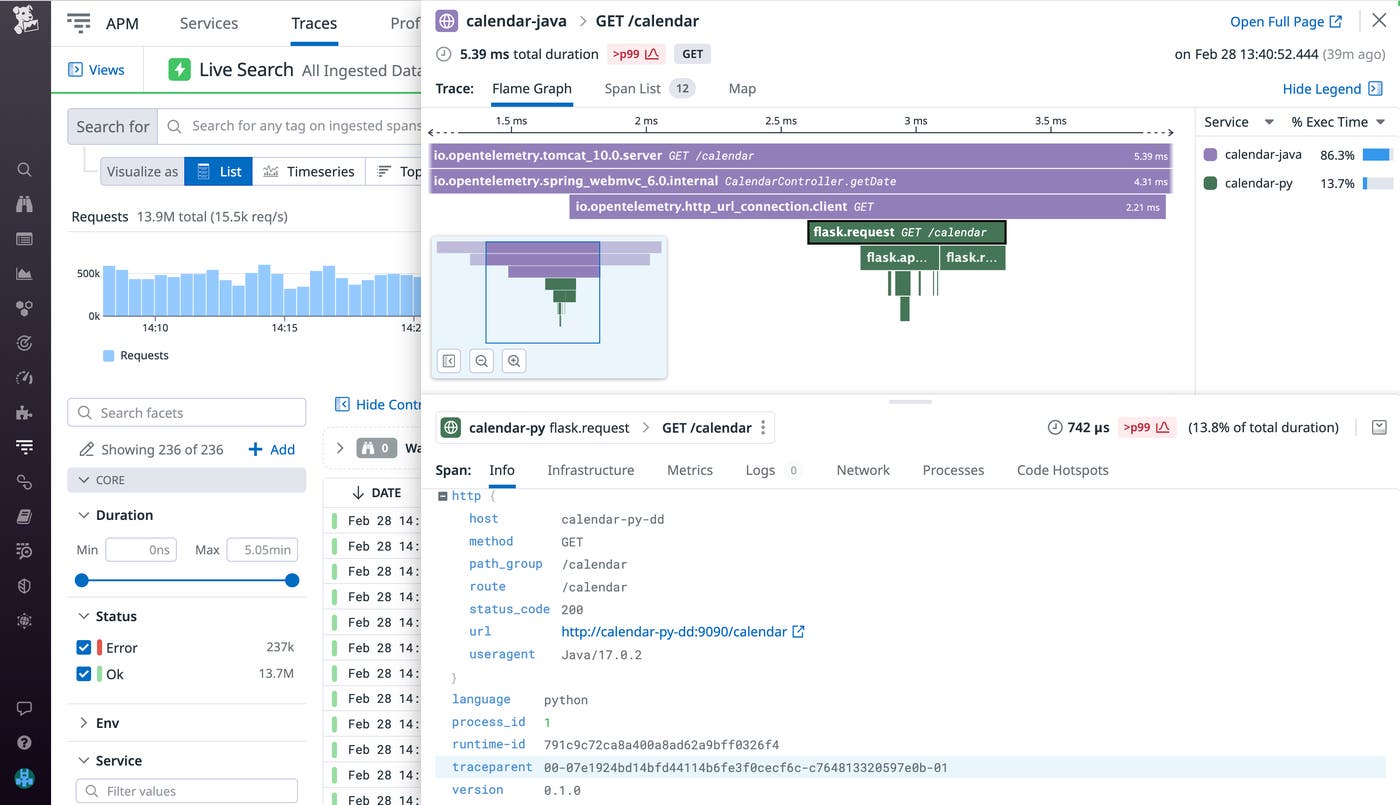
When inspecting the distributed trace in Datadog APM, the developer can now track the complete path of the request, which provides invaluable context for troubleshooting. In the trace below, we’re able to visualize the complete distributed trace consisting of spans from both the calendar-java service (which has been instrumented with the OTel Java SDK) and the calendar-py service (which has been instrumented with the Datadog Python Tracing Library). In the Info tab, we can see that the selected span’s traceparent header is in the W3C format.

Monitor end-to-end traces across the Datadog platform
After instrumenting your application with Datadog’s tracing libraries and other W3C-compliant tracers, you’ll be able to view complete paths of requests with trace context and correlate them across several Datadog products, such as Synthetic Monitoring, RUM, and Serverless Monitoring.
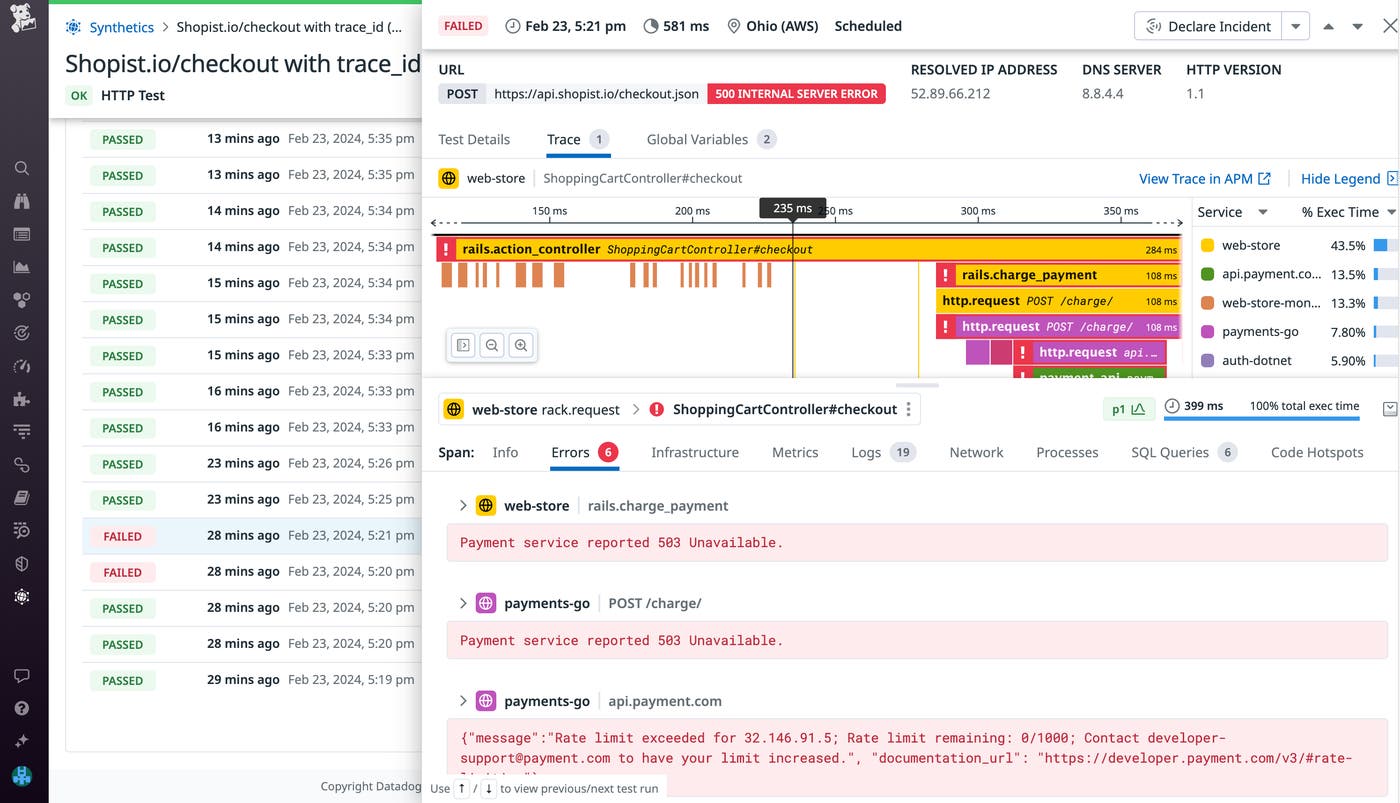
For example, integrating APM with Synthetic Monitoring enables you to view complete traces from your synthetic tests. With trace context support, you’ll gain complete end-to-end visibility that enables you to investigate your synthetic tests’ failed assertions and proactively remediate issues to ensure that your applications function as intended.

Datadog RUM and Serverless Monitoring also support W3C Trace Context. See our blog post to learn more about correlating RUM events with OTel-instrumented traces to troubleshoot user-facing issues or check out our guide for more details on how you can seamlessly collect traces from serverless workloads instrumented with W3C-compliant tracers.
W3C Trace Context support in Datadog APM
You can begin getting deep visibility into your applications with trace context by instrumenting them with Datadog’s tracing libraries. To learn more about the default trace header propagation for each programming language, view our documentation. You can learn more about this and get other updates on our OpenTelemetry work in our blog post and our OTel docs.
If you don’t already have a Datadog account, sign up for a free 14-day trial today.


