Stanley Liu
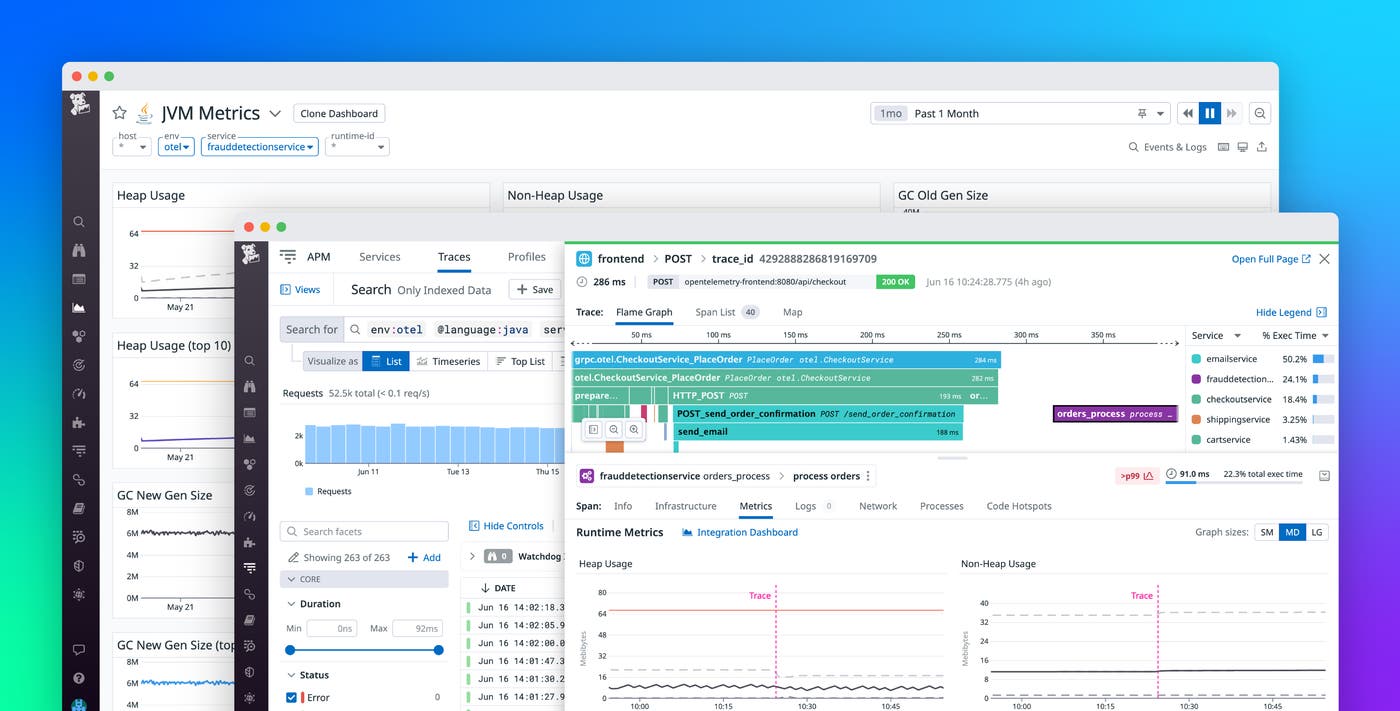
OpenTelemetry (OTel) is an open source, vendor-neutral observability framework that supplies APIs, SDKs, and tools for the instrumentation of applications and services. As part of our ongoing commitment to OTel, we are excited to announce support for the ingestion and visualization of runtime metrics from OTel-instrumented applications in Java, .NET, and Go. Runtime metrics provide deep visibility into your applications’ resource usage, such as memory usage, garbage collection, parallelization and more.
By sending runtime metrics from OTel-instrumented services to Datadog, you can gain additional insights for troubleshooting issues throughout the Datadog platform. This complements Datadog’s existing support for runtime metrics through our native tracing libraries, allowing you to get comprehensive visibility into all your applications, regardless of whether they are instrumented with Datadog or OTel SDKs.
In this post, we’ll look at how you can visualize and monitor runtime metrics in context with other data from your applications. But first, we’ll walk through how you can set up Datadog to collect runtime metrics from applications that have been instrumented with OTel SDKs.
Sending OTel runtime metrics to Datadog
In order to collect runtime metrics, your application needs to be set up with the respective runtime library for its language. These libraries are automatically enabled when using OTel automatic instrumentation, or you can manually enable them if you’re using OTel manual instrumentation. To send telemetry data (such as traces, logs, and metrics) to the Datadog backend, you can either ingest data with the Datadog Agent or send data to the OpenTelemetry collector and use the Datadog exporter to forward it to Datadog, as described in our documentation.
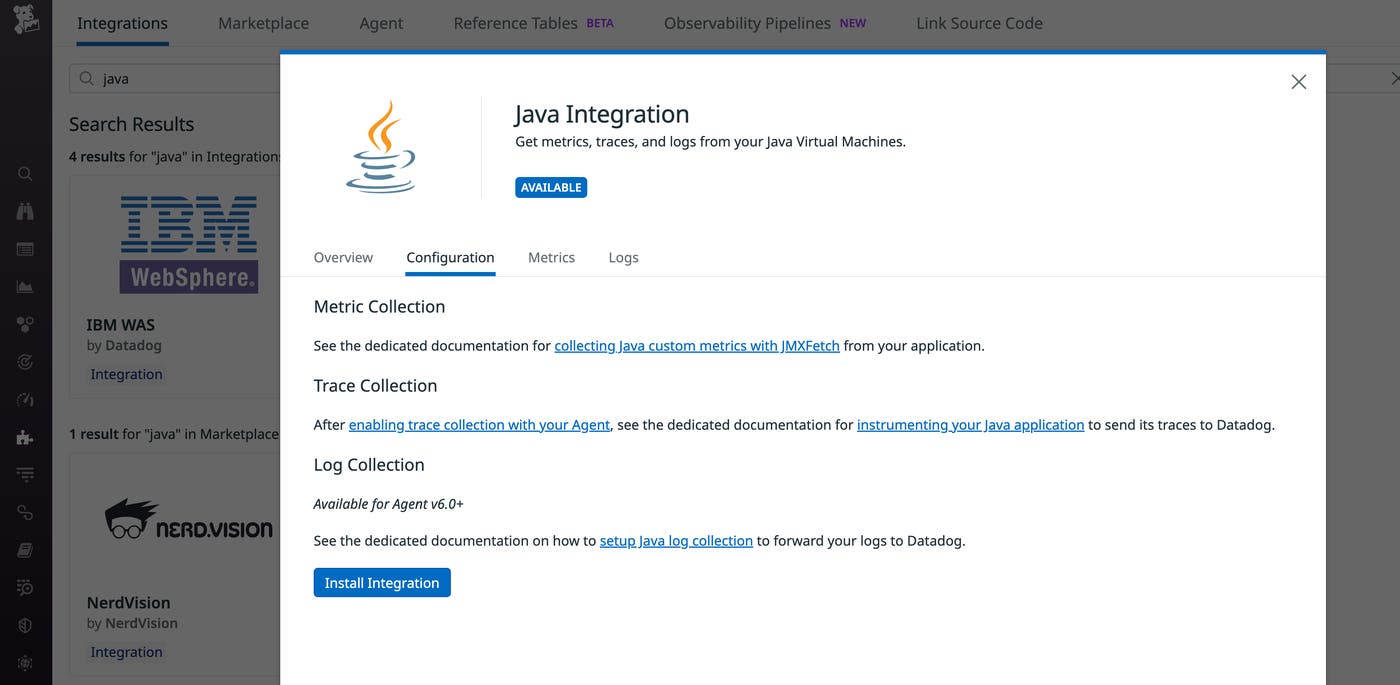
In order to visualize runtime metrics in dashboards and throughout the Datadog platform, you’ll also need to navigate to the language-specific integration tile (e.g., the Java tile shown below) and click “Install Integration.”
Visualizing OTel runtime metrics in Datadog
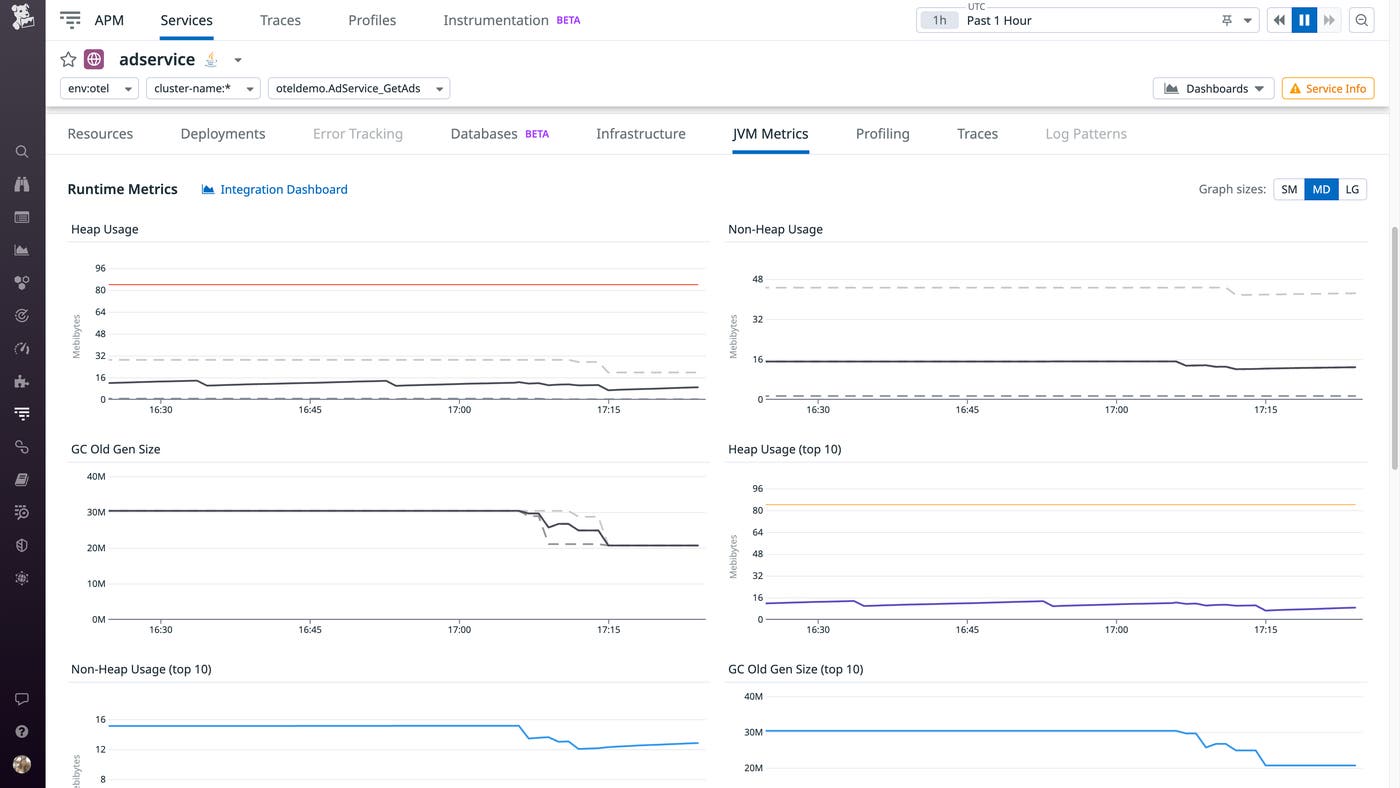
Once your application is sending runtime metrics to the Datadog backend, you’re ready to view them on our platform. APM service pages enable you to get a quick overview of the health and performance of the services you’re monitoring with Datadog. Now, you can also view runtime metrics in the service page for any OTel-instrumented service. For example, the JVM Metrics tab displays runtime metrics specifically from adservice, a service that has been instrumented with the Java OTel SDK.
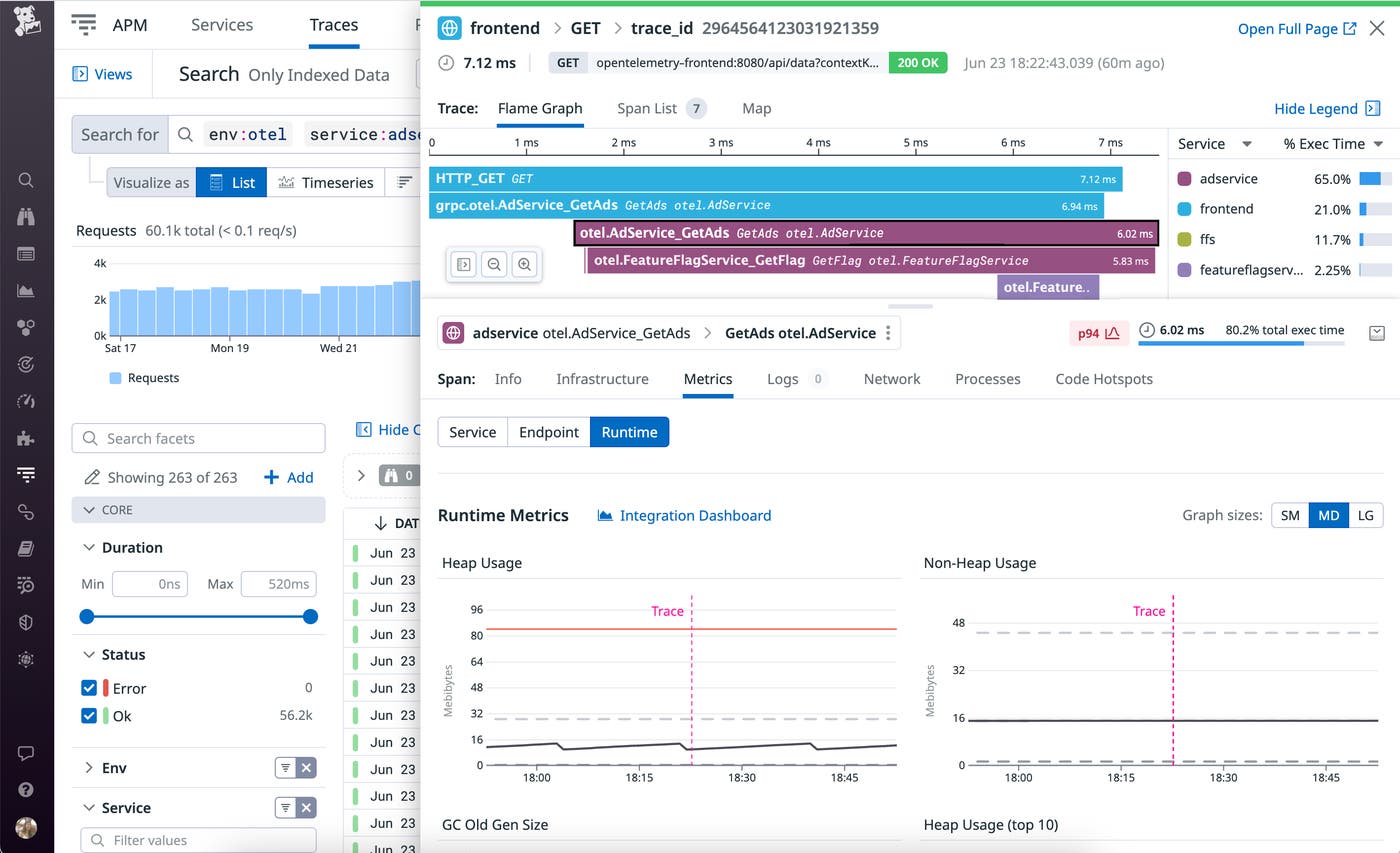
You can also use runtime metrics to gather more context around specific traces. By clicking to inspect a trace, you can access the flame graph and view runtime metrics in the Metrics tab. This view correlates the selected trace with runtime metrics from the same host and service, providing you with a snapshot of your application’s performance at the exact time of the trace. This can be useful for investigating incidents associated with suspect traces or for observing usage metrics for more costly operations.
Out-of-the-box visibility into OTel runtime metrics
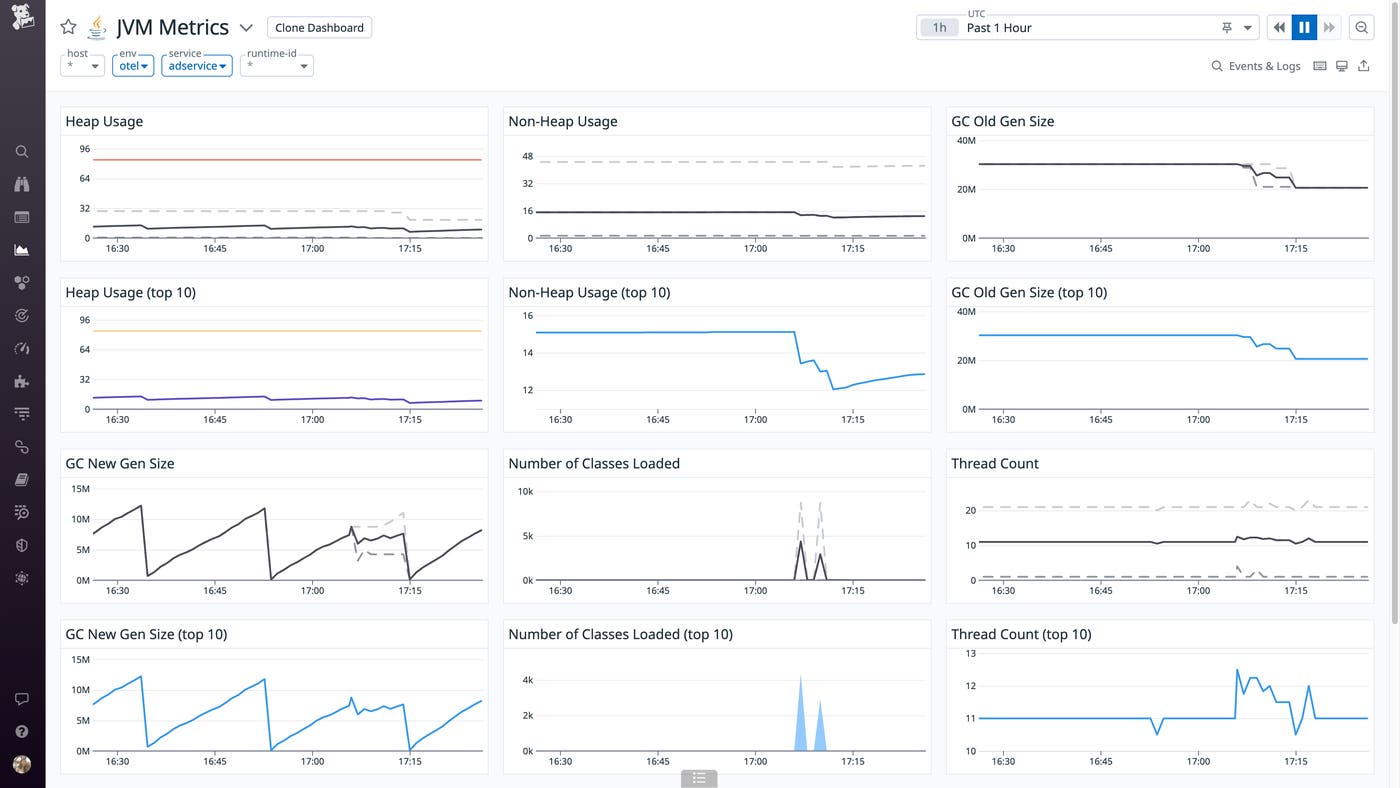
Datadog provides language-specific dashboards for all your runtime metrics, whether they come from services that have been instrumented with OpenTelemetry or Datadog’s native tracing libraries. For example, the out-of-the-box JVM runtime metrics dashboard displays metrics for all of your Java services. If you need to investigate an issue with a specific service or subset of your environment, you can use template variables to filter metrics by host, environment, or service, as shown below. This dashboard can also help you spot issues, such as steadily increasing heap usage, and investigate them before they degrade application performance.
Enhance your observability today
With our expanded support for OTel runtime metrics, you can now gain additional insights into the performance of OTel-instrumented services, alongside all the other services you’re already monitoring with Datadog. This gives you more visibility into metrics such as memory usage, garbage collection, and parallelization, enabling your engineering teams to optimize application performance through a single lens.
Check out our documentation to learn more about collecting runtime metrics from OTel-instrumented apps in Datadog. If you’re not already a Datadog customer, sign up for a 14-day free trial today.
