Sumedha Mehta

Neha Julka

Aaron Kaplan
Enabling auto-instrumentation for your Lambda functions provides detailed insights into the performance and security of your serverless applications. Developers often also use custom instrumentation to fine-tune visibility and further tailor telemetry to their business needs. However, different teams within your organization might use a variety of instrumentation libraries, and achieving more granular visibility can come at the expense of data portability and interoperability.
As part of our ongoing commitment to the OpenTelemetry project, Datadog APM now supports custom instrumentation for AWS Lambda using the OpenTelemetry Tracing API. This enhancement complements the OTel API support in Datadog's APM tracing libraries for non-serverless applications.
Additionally, with complete support for W3C trace header propagation across all runtimes for APM serverless and non-serverless workloads, as well as RUM and Synthetics, developers get complete frontend-to-backend traces in Datadog. This extends across any upstream or downstream service instrumented using the OTel SDKs, Datadog’s tracing libraries, Jaeger, or any other custom instrumentation that supports W3C trace headers.
Datadog now offers the best of both worlds when it comes to monitoring your serverless applications, bringing together the portability of custom OTel instrumentation with the enriched visibility offered by the Datadog platform through features like tag enrichment, Cold Start Tracing, Lambda payload capture, profiling, and App and API Protection (AAP).
In this post, we’ll show you how you can use Datadog APM to:
Capture full end-to-end traces from any W3C-compliant service
Get enriched visibility into your serverless applications using vendor-neutral code
Capture full end-to-end traces from any W3C-compliant service
Datadog’s support for W3C Trace Context means that you can capture complete traces from any service that adheres to W3C standards. Using the DD_TRACE_PROPAGATION_STYLE environment variable, you can configure the Datadog tracer to support different trace header formats based on your existing instrumentation and runtimes. As a result, whether your upstream and downstream services are currently instrumented using OTel, Datadog, Jaeger, or any other W3C-compliant vendor—and no matter the runtime—Datadog will capture complete end-to-end traces. This is available by adding the Lambda Extension to any supported runtime.
Let’s say you have an OTel-instrumented service running in EKS, which invokes a Lambda function that is instrumented with one of Datadog’s tracing libraries. With W3C support, now these spans will be tied into one seamless end-to-end trace.
By default, Datadog APM accepts both Datadog and W3C Trace Context headers. This is ideal for distributed applications that use a mix of tooling and instrumentation types across their services. For applications using the latest Datadog libraries or exclusively W3C-compatible instrumentation such as OTel, you may want to set the DD_TRACE_PROPAGATION_STYLE environment variable to tracecontext.
Get enhanced visibility into your serverless applications using open source standards
In addition to providing full trace context for any W3C-compliant instrumentation by default, Datadog APM can now directly collect traces from Lambda functions written in Python or Node.js that are custom-instrumented using the OTel API. Together with complementary features—such as payload capture and Cold Start Tracing—our support for custom OTel instrumentation enables detailed analysis of your Lambda traces, helping you optimize the performance of your serverless applications.
Anyone already using OTel instrumentation in their Lambda functions can get started with these features by simply adding the Datadog Lambda Extension to their existing Python or Node.js code. For example, let’s say you are monitoring the performance of a serverless e-commerce application that is instrumented using OTel, and you want to measure a key piece of business logic—the process of submitting order objects to a database. In order to gauge whether this can be optimized, you want to track the duration of each step of this process, which is a level of granularity not captured by your existing OTel instrumentation.
By creating custom spans and adding the Datadog Lambda Extension to your code, you can seamlessly visualize and monitor this process in Datadog. Your code for these spans might look like the following:
import opentelemetryimport ddtrace
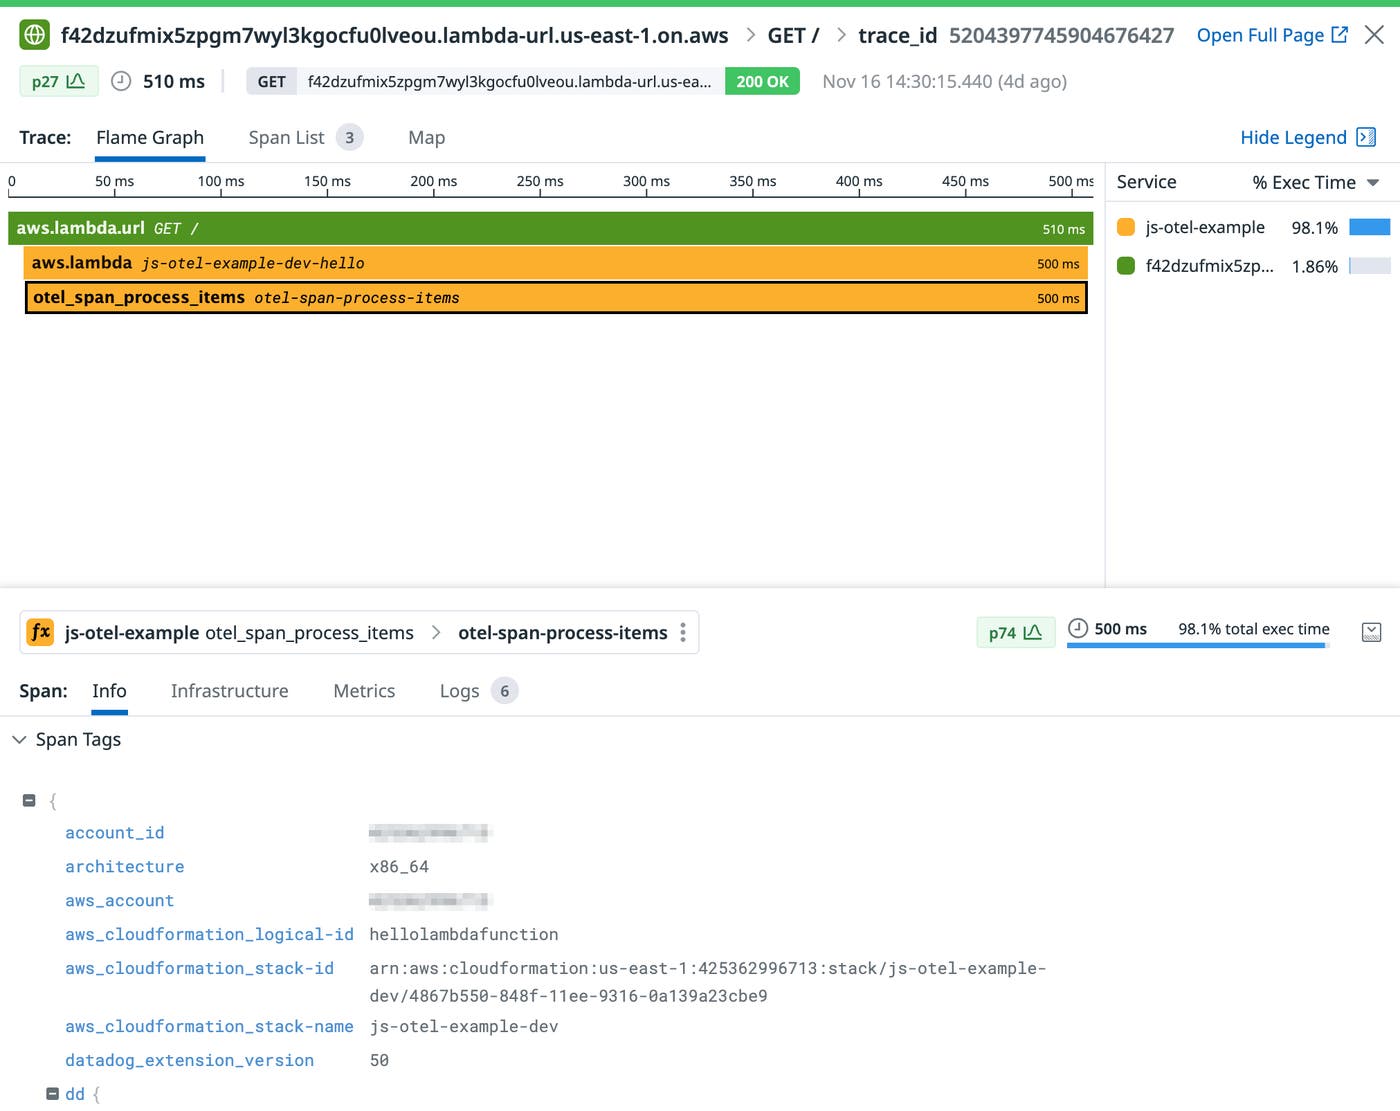
oteltracer = opentelemetry.trace.get_tracer(__name__)with oteltracer.start_as_current_span("otel_span_process_items") as parent_span: //attributes will become Datadog span tags parent_span.set_attribute("barcode_id", "some_id") //add business-specific item processing logic [...]In Datadog APM, the resulting trace would look like this:

Here, Datadog has processed your custom spans, added them to the relevant trace, and visualized them without requiring you to make any changes to your existing OTel instrumentation.
Enrich your serverless visibility today
Datadog’s support for custom OTel instrumentation in AWS Lambda provides you with rich insight into the performance of your serverless applications. We currently offer this support for Node.js and Python runtimes. Datadog also provides granular, end-to-end visibility for traces from any service that uses W3C standards, in any runtime.
This support enables organizations to standardize their instrumentation without risking vendor lock-in. If you’re already using OTel instrumentation, you can quickly port your code over to Datadog and get started with our data enrichment features, such as Cold Start Tracing, Lambda payload capture, profiling, and AAP. Check out our documentation to get started. Or, if you’re new to Datadog, sign up for a 14-day free trial today.

