
Jessica Manheimer
Product Marketing Manager

Quentin Sellem
Product Manager
When a native C or C++ application crashes on a user’s device, you often have limited visibility into what caused the failure. A stack trace can identify the affected code, but it doesn’t reveal what the user was doing before the crash or whether other users encountered the same issue. Without that context, you may have to reconstruct the events leading up to the crash or reproduce the issue locally, in an environment that may not match the user’s device.
The Datadog C++ SDK now extends Datadog Real User Monitoring (RUM) to native C and C++ applications running on Windows, macOS, and Linux. The SDK collects crash diagnostics, tracks errors, and captures instrumented user activity, so you can troubleshoot failures in the context of the user sessions where they happened.
In this post, we’ll cover how to:
Catch and troubleshoot crashes in native C and C++ applications
The SDK supports native crash reporting and Error Tracking to help you diagnose unhandled crashes. On Linux and macOS, it captures signals such as SIGSEGV (segmentation faults) and SIGABRT (aborts), while on Windows, it captures unhandled structured exceptions. The resulting crash reports include stack traces to help you identify where a failure occurred and what caused it.
Say a desktop application crashes when a user opens a saved document. With the SDK, you can examine the captured crash report and its stack trace. When you upload your debug symbols, symbolication translates stack trace addresses into human-readable function names and source locations, which can help you pinpoint the affected code.
Choose a crash handler for your application
The SDK offers two crash handlers:
An in-process handler that captures crashes within the application
An out-of-process handler that collects more comprehensive crash diagnostics
The in-process crash handler requires only C++17 and no additional executable. It captures the crashing thread’s stack trace and uploads the crash report the next time the application launches.
The out-of-process crash handler uses Crashpad, the open source crash reporting system that Chromium uses. Because Crashpad runs as a separate crashpad_handler process, it can capture failures such as stack overflows and heap corruption that the in-process handler may miss. It also captures stack traces from all threads and uploads crash reports immediately, without waiting for the application to relaunch.
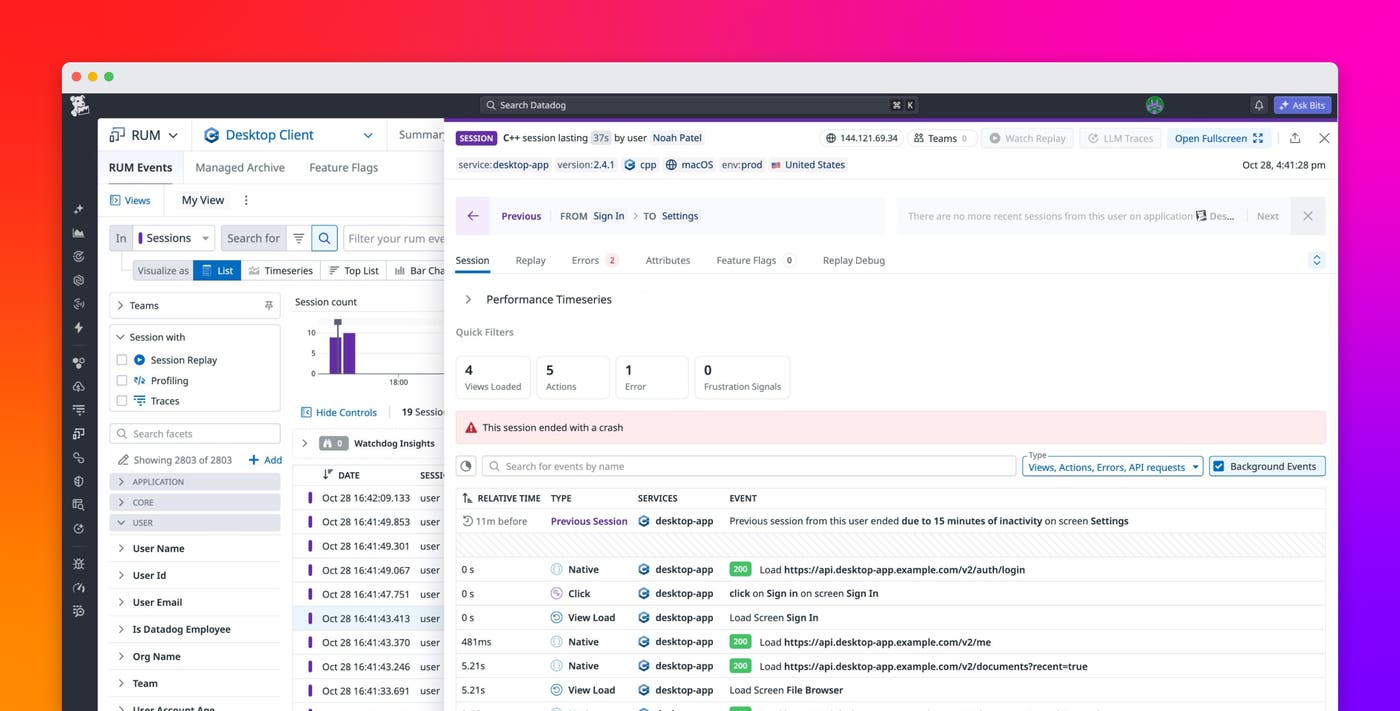
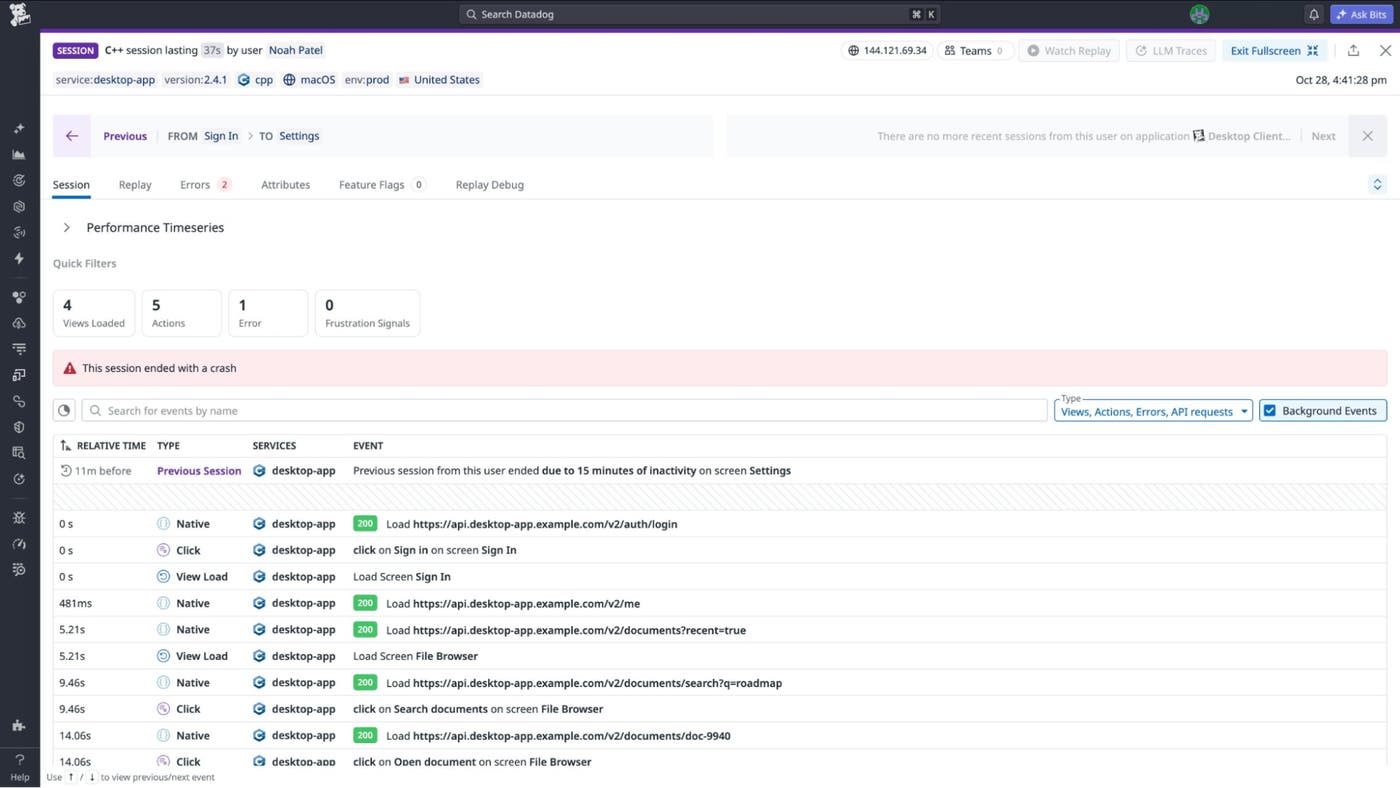
Both crash handlers report RUM errors enriched with the latest RUM context at the time of the crash, including the session and last active view. You can use this context to investigate crashes alongside the rest of your session data in Error Tracking. The RUM session timeline also lets you review the user actions, view loads, and network requests that preceded the crash, helping you reconstruct what happened before the application failed.
Identify recurring crashes and track handled errors
Error Tracking groups related failures into issues so you can identify recurring crashes, distinguish isolated failures from widespread ones, and prioritize investigations by user and session impact.
The SDK also lets you report handled errors that don’t terminate the application. For example, a desktop application might fail to deserialize a saved file, or a native client might encounter an unexpected response while processing data. Linking these errors to RUM sessions lets you investigate failures that affect users even when the application keeps running.
Track user activity with RUM session context
Because the SDK isn’t tied to a particular UI framework, you define the events that reflect how users interact with your application, and the SDK associates them with RUM sessions. For example, you can instrument a desktop application to capture:
Views: Application screens or states, such as a document editor, settings page, or file browser
Actions: User interactions, such as selecting a file, clicking a button, or starting an export
Resources: Network requests and their outcomes, including timeouts and other failures
Operations: Multistep workflows, such as opening a document, authenticating a user, or uploading a file
Long tasks: Stalls that block the main thread for an extended period, such as when a per-frame update or an event handler exceeds a budgeted duration
If a user encounters a failure while opening a document, you can see the view they were on, the action that started the workflow, and any related resource failures. RUM operations can also track whether the document opens successfully, and how long it takes to load its contents and prepare for editing.
Integrate RUM into native C and C++ applications
The SDK provides a C++ API for codebases that target C++17 or later, plus a C99-compliant C API. Both work with native build environments, including CMake-based projects. You can also wrap the C API in foreign function interface (FFI) bindings to instrument applications written in other languages and runtimes.
The SDK sends RUM data directly to Datadog without requiring the Datadog Agent on each user’s device. For example, you can instrument a PC game to capture views, user actions, errors, and operations such as loading a level or connecting to a game server. You can then investigate failures in RUM without a plugin specific to your game engine.
The SDK also includes tracking-consent controls that let you manage local storage and uploads of RUM data based on each user’s consent preferences.
Start monitoring native applications with Datadog RUM
To start monitoring your native C or C++ application, instrument the workflows most relevant to your users and configure crash reporting to collect diagnostic information when failures occur.
For setup details, see the C++ SDK setup documentation and the open source C++ SDK on GitHub.
If you’re not already a Datadog customer, sign up for a free 14-day trial to start monitoring native C and C++ applications with Datadog RUM.
