Betsy Sallee

Jimmy Caputo
HiveMQ is an open source MQTT-compliant broker for enterprise-scale IoT environments that lets you reliably and securely transfer data between connected devices and downstream applications and services. With HiveMQ, you can provision horizontally scalable broker clusters in order to achieve maximum message throughput and prevent single points of failure.
In an IoT system, you might have an enormous number of clients sending messages through your brokers to a range of backend databases or processing pipelines at any given moment. This makes full observability of your brokers paramount. Datadog’s new integration makes HiveMQ monitoring easy by enabling you to collect, visualize, and alert on key data including client connection activity and message throughput. For more insight, you can also use Datadog to collect HiveMQ event logs.
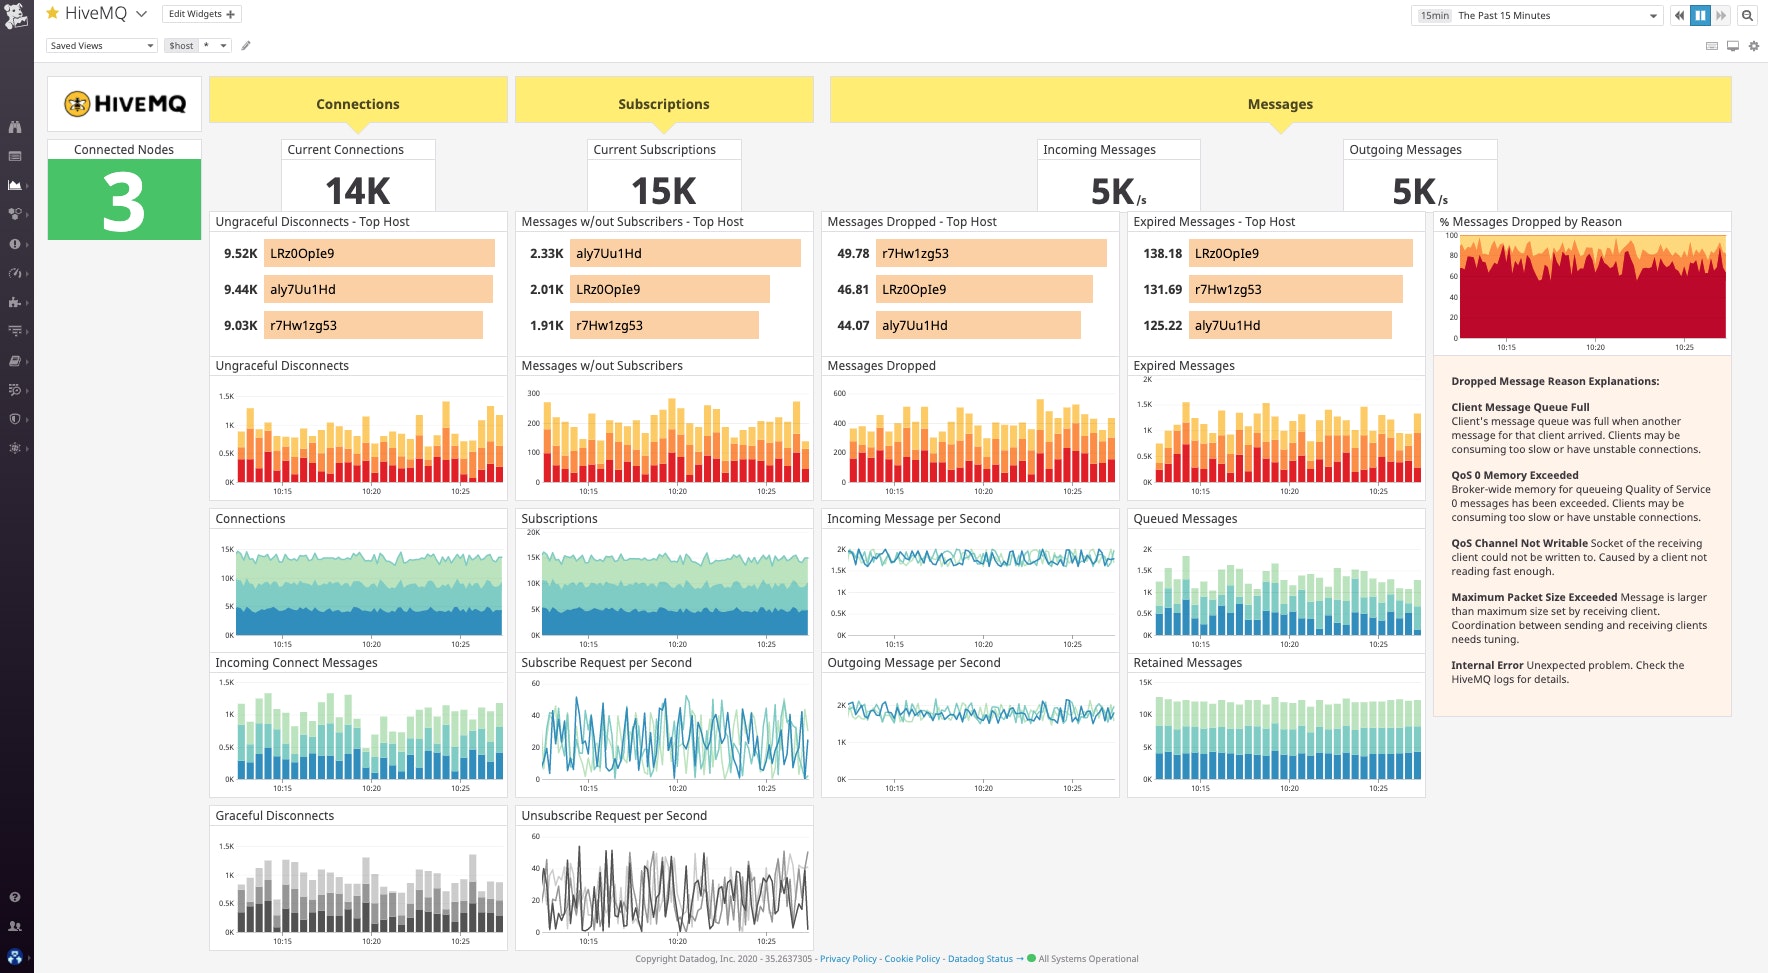
Once you’ve enabled the integration, a customizable out-of-the-box dashboard gives you real-time visibility into connection health between your IoT devices and brokers, the load on your MQTT brokers, and whether or not your backend services are able to keep up with messages coming from connected devices.

Troubleshoot fluctuations in the number of client connections
A hallmark trait of the MQTT protocol is the decoupling of publishers and subscribers. Rather than communicating directly with one another, all MQTT clients—be they publishers or subscribers—send and receive data via a broker, such as HiveMQ. But before a client can start transferring data, it must first establish an MQTT connection with the broker over a network. In order to do so, it sends a connect message to the broker, to which the broker responds with a connack message. A client can disconnect from the broker gracefully by sending a disconnect message. On the other hand, ungraceful disconnects—that is, those without a disconnect message—are unexpected and can occur for a variety of reasons, including loss of network connection.
With Datadog, you can easily monitor and alert on key metrics pertaining to connection activity, including overall connection count and the number of ungraceful disconnects. For example, you may wish to set an alert to notify you of a sudden drop in connected devices, which you can then correlate with the rates of graceful and ungraceful disconnects. If you notice a spike in ungraceful disconnects, you can dive into your event logs for more detailed information about expired sessions, disconnects, and the reasons disconnects have occured.

Monitor message throughput between brokers and clients
Tracking the throughput of incoming and outgoing messages is an essential pillar of monitoring your HiveMQ infrastructure, as it can provide high-level insight into broker activity and alert you to a range of possible issues. For instance, a drop in incoming messages might correspond with a spike in the number of client disconnects, which you can investigate with the help of logs (as discussed above). You can also use Datadog’s Network Performance Monitoring to visualize your network flows and identify problems such as a poor connection between brokers and clients.
A decline in the rate of outgoing messages, on the other hand, may correspond with an increase in the number of dropped messages. A message is considered “dropped” if the broker receives the message but does not send it along to subscribers. Messages may be dropped for many reasons, including “Memory Exceeded” and “Maximum Packet Size Exceeded.” Datadog collects metrics that track the overall rate of dropped messages, as well as the rates of messages dropped for specific reasons, enabling you to more quickly identify problems in your IoT architecture and make appropriate changes.

Collect data across your entire IoT environment
IoT environments are inherently complex, so it’s important for you to have insight that extends beyond HiveMQ. For example, if you see an increase in messages dropped due to “Memory Exceeded,” it means that broker-wide memory for queuing Quality of Service 0 messages (that is, messages that aren’t stored or re-sent) has run out. This memory depletion could be symptomatic of either slow consumption of messages by your backend services or resource depletion within HiveMQ on the node or cluster level. Datadog collects hundreds of system resource metrics and integrates with more than 400 other technologies, including Kafka, so you can correlate HiveMQ metrics with monitoring data from across your entire environment, making it easy to quickly identify resource bottlenecks and troubleshoot potential issues.
Start monitoring HiveMQ with Datadog
Datadog’s HiveMQ integration gives you comprehensive visibility into the data flows from your IoT devices to all of your connected backend services, providing end-to-end coverage of your IoT infrastructure. For more information about the integration, check out our webinar. If you’re not already using Datadog, get started with a 14-day free trial.


