Michael Gerstenhaber
Editor's note: This post covers Cloud Network Monitoring, a Datadog feature that was originally called Network Performance Monitoring.
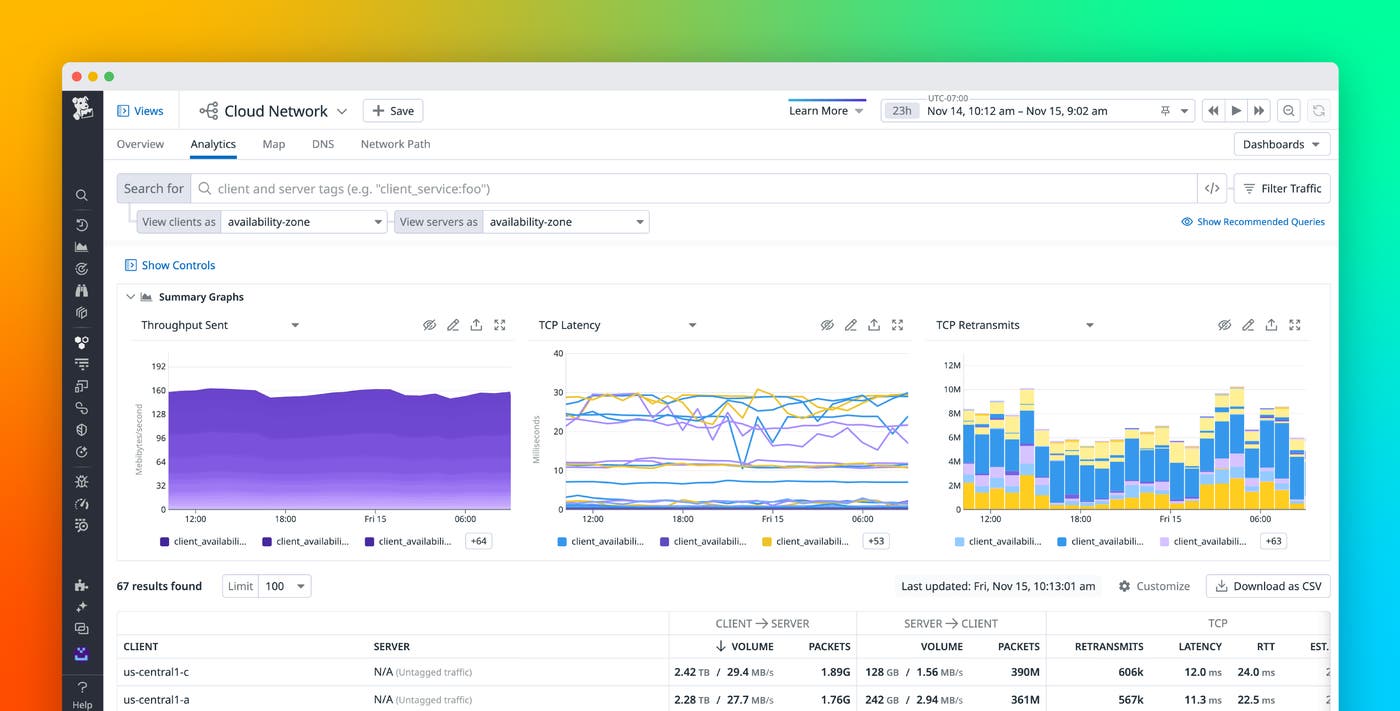
Your applications and infrastructure components rely on one another in an increasingly complex fabric, regardless of whether you run a monolithic application or microservices, and whether you deploy to cloud infrastructure, private data centers, or both. Virtualized infrastructure enables developers to respond to arbitrary scale—and creates dynamic network patterns that aren't well matched to traditional network monitoring tools. To provide visibility into every component in your environment, and all the connections between them, Datadog is introducing Cloud Network Monitoring.
From granular network details to global aggregates
Datadog Cloud Network Monitoring provides multi-cloud visibility into network flows in granular detail, while also enabling you to aggregate and monitor that data using any tag available in Datadog. So you can query and aggregate connection metrics between any two objects—from services to availability zones, or from Kubernetes pods to security groups—to provide immediate insight into performance and dependencies. Cloud Network Monitoring is fully integrated with the rest of the Datadog platform, so you can view automatically correlated logs and request traces to see the actual requests and application activity that the network traffic represents.
Observing long-lived abstractions
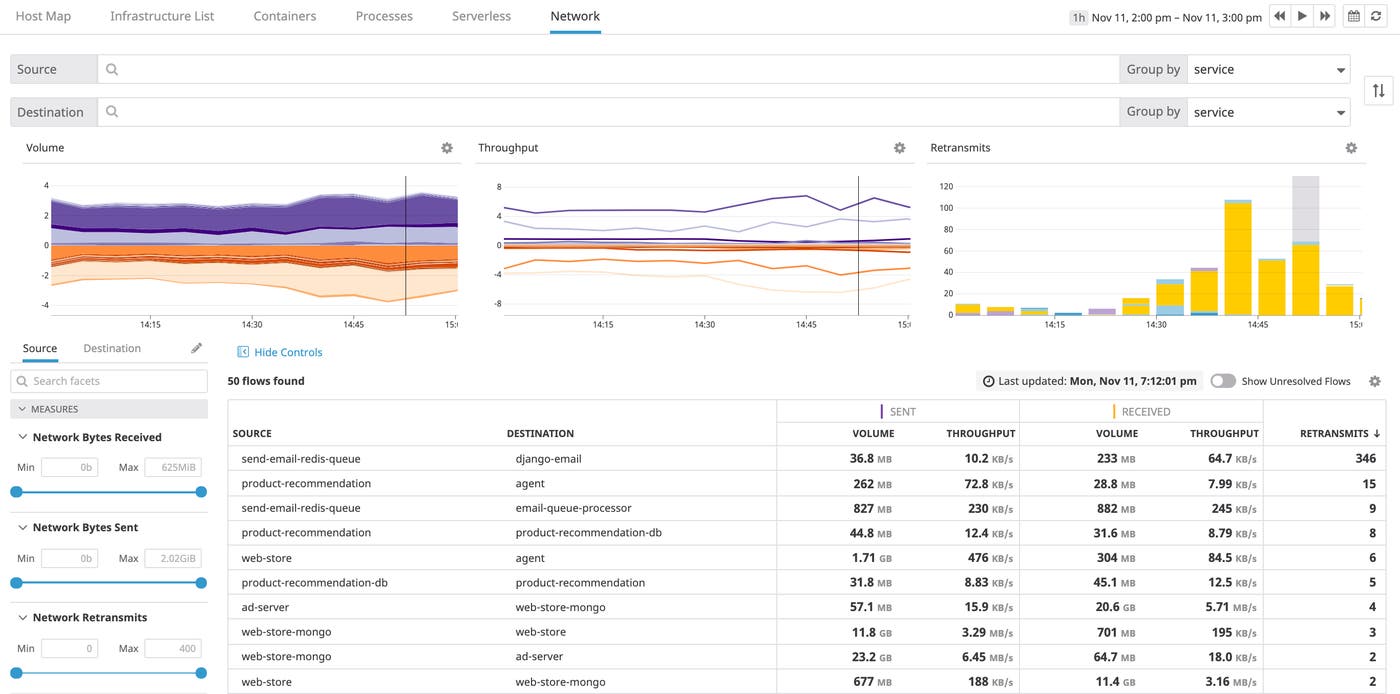
Monitoring dynamic infrastructure means monitoring abstract objects. Individual hosts and containers scale up and down, and IP addresses change, but with tags you can focus your monitoring on longer-lived abstractions like services, applications, and availability zones. After all, if a single container is resource constrained it will be reaped and re-orchestrated, but if an entire service or availability zone is having trouble communicating to a gateway, your customers may be experiencing intermittent timeouts.
In the new Network view in Datadog, you can see the network volume and throughput between any two sets of tags. Datadog automatically collects relevant tags from more than 1,000 integrations, in addition to the custom tags provided directly by developer instrumentation.
Optimize network traffic patterns
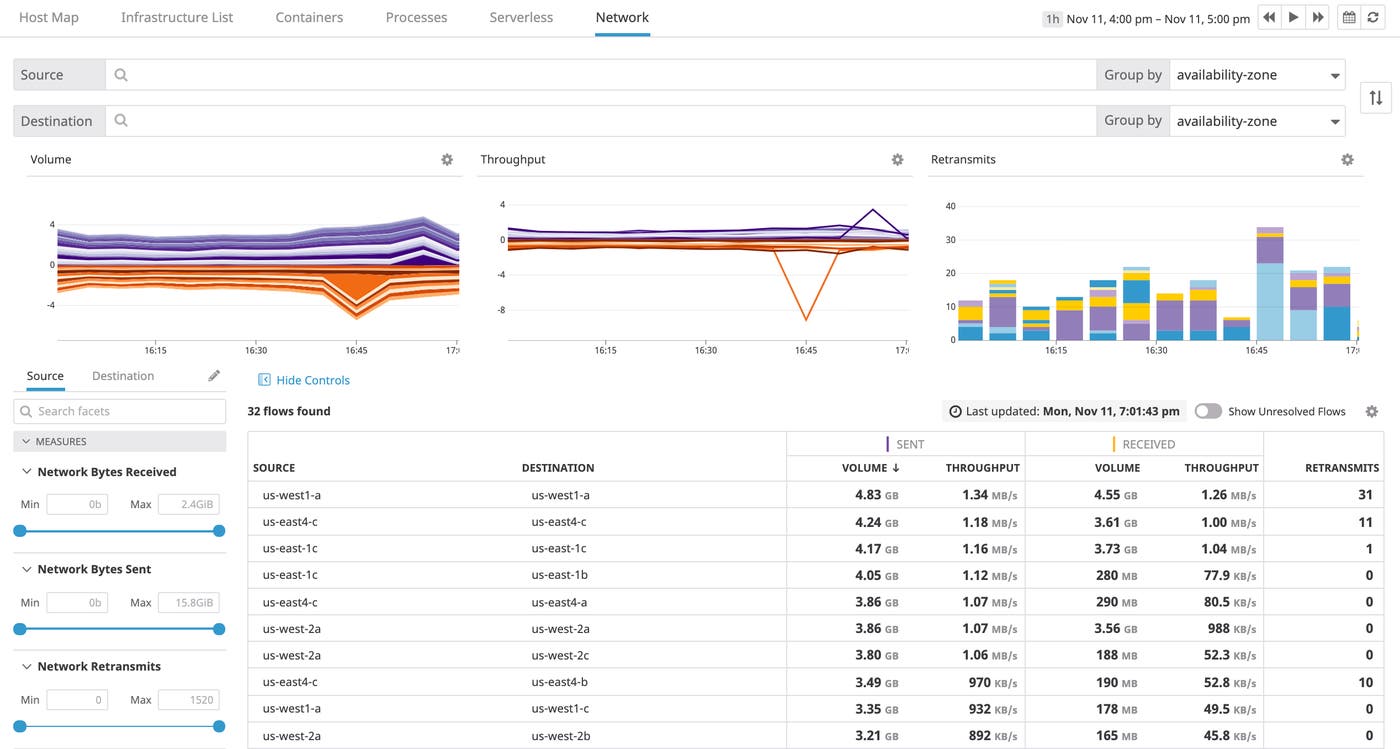
Using tags automatically applied to your cloud services and resources, you can instantly sort and filter your metrics to see, for example, how network traffic flows across availability zones for a particular service or for your entire infrastructure. Often, communicating across data centers or availability zones increases the potential for latency and communication errors, not to mention transit costs. By revealing network patterns that may not reflect the intended design of your application, Cloud Network Monitoring can point to areas for performance optimization and cost savings.
Identify misconfigured services
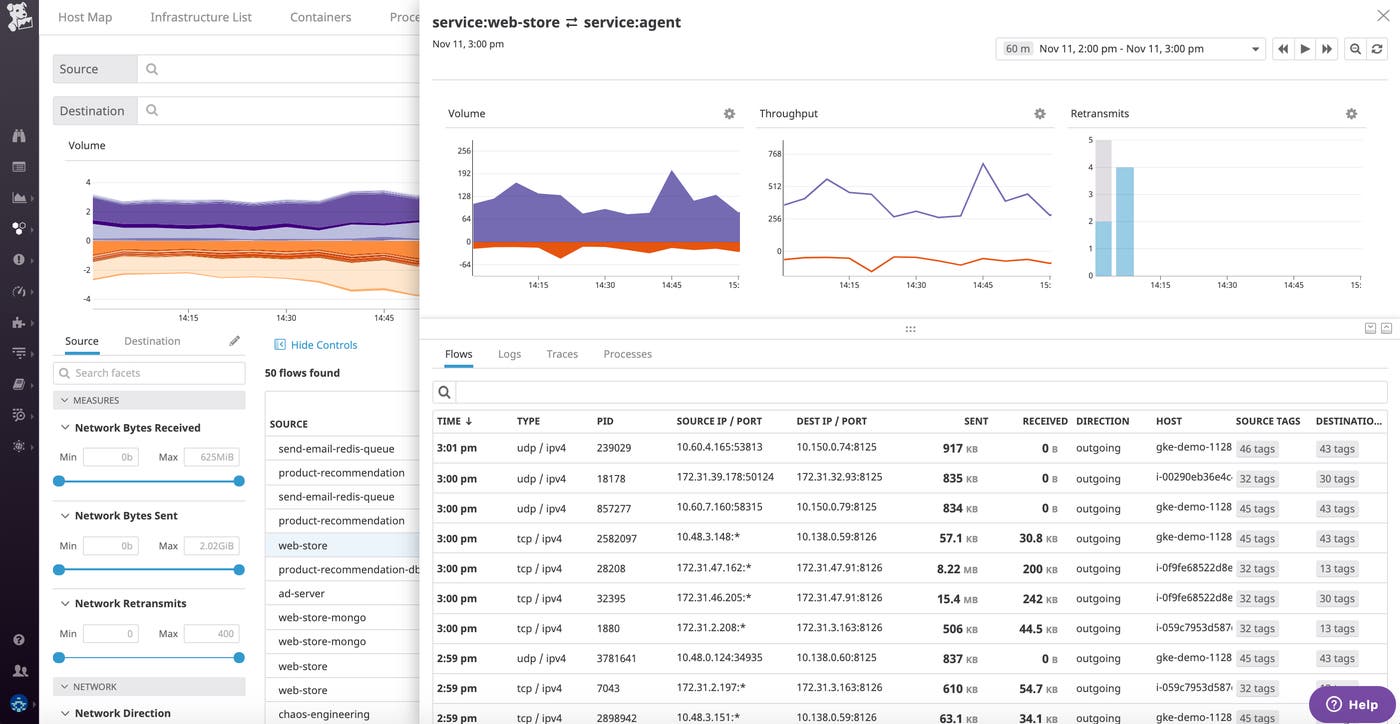
Cloud Network Monitoring is a powerful tool for zeroing in on the source of network issues. Use TCP retransmit count to quickly identify connectivity issues in your network. In a Kubernetes cluster, for example, where containers are constrained only in their CPU and memory usage, a single container can saturate the network. In a few clicks, you can drill down to the container image that is consuming the most network throughput, and pivot directly to logs or request traces from that service to help identify the root cause.
Full-stack dependency monitoring
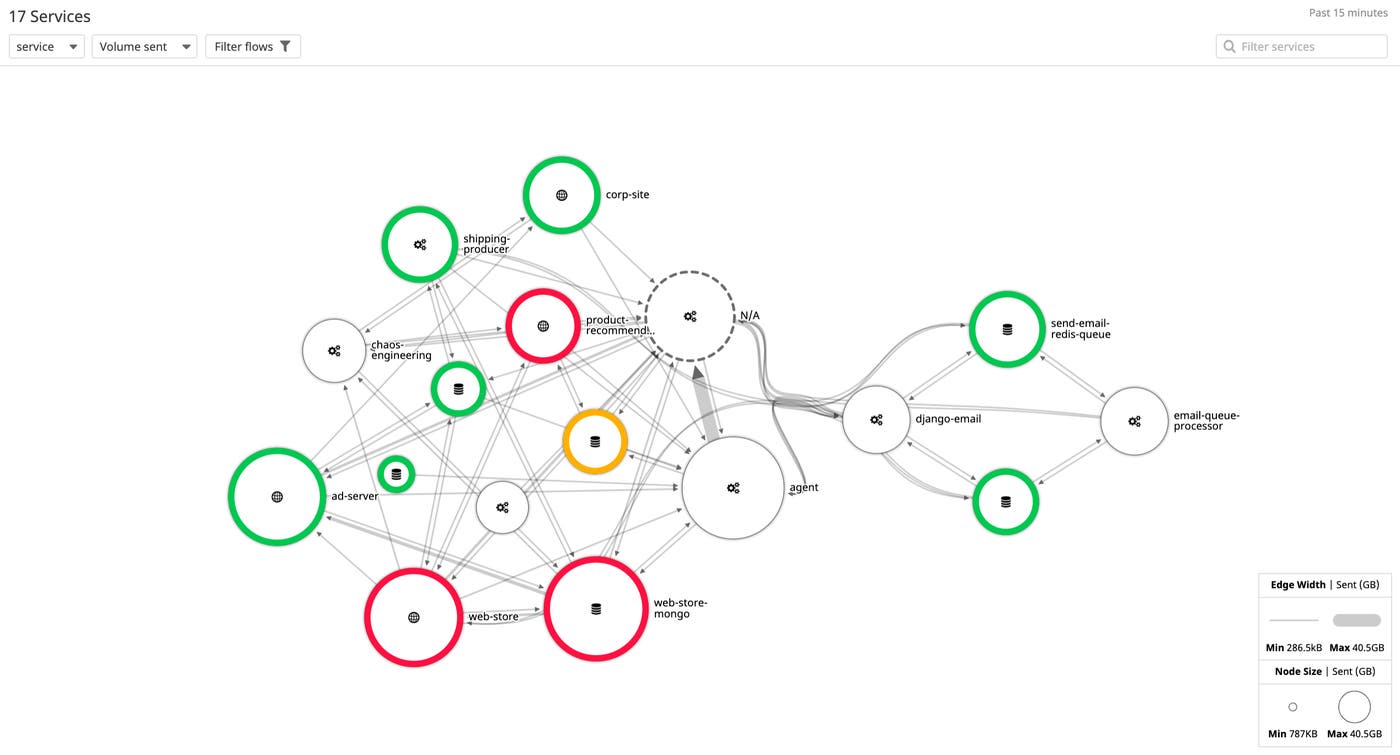
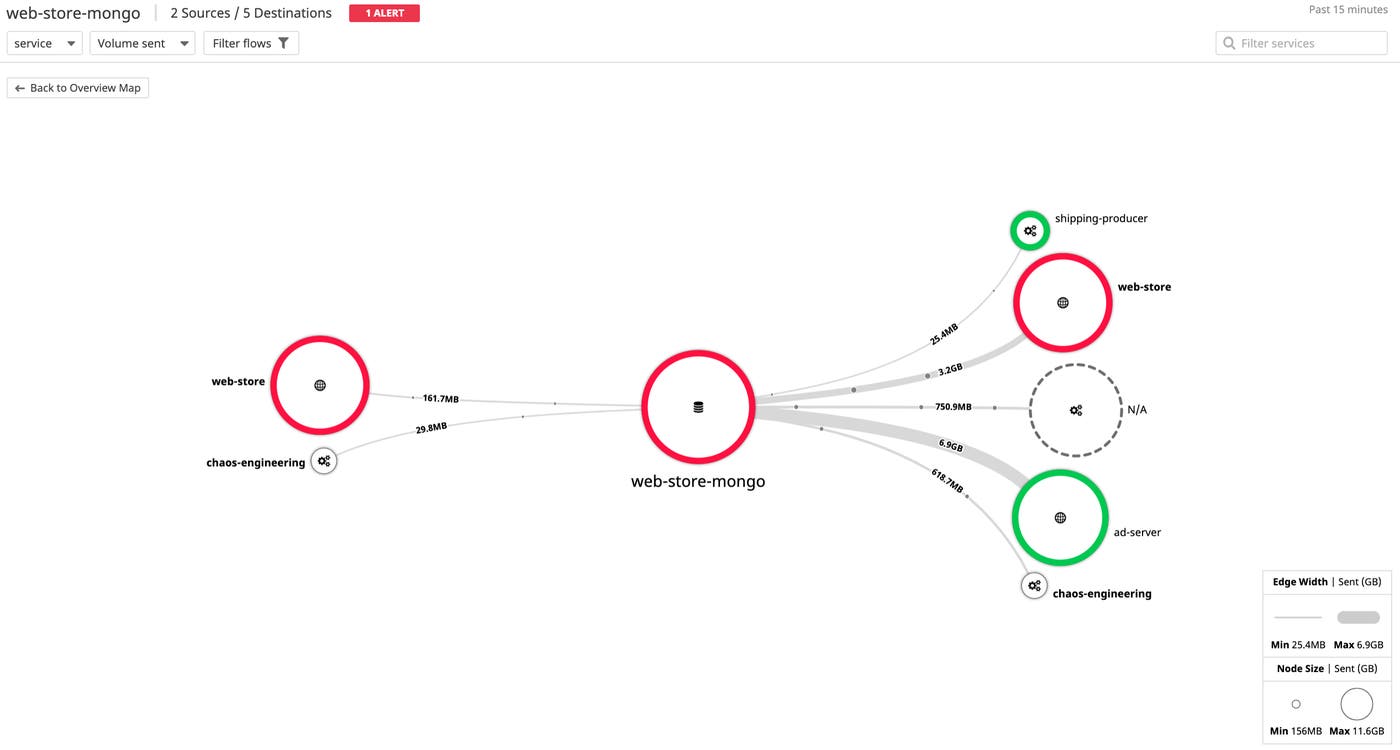
Flow analytics is a powerful way of drilling down into not just the metrics describing network communication, but the topology of the network as well. By aggregating all of the flows between objects, Datadog can display network traffic on a directed graph. Using tags, you can visualize network topology by service, Kubernetes deployment, Docker image, Chef role, AWS security group, or any other lens.
Fast and light with eBPF
Traditionally, network-level visibility has come with a performance cost—monitoring the flow of packets can chew up significant CPU resources. Datadog's Cloud Network Monitoring is built on eBPF, which enables detailed visibility into network flows with extremely low overhead. So you can get unprecedented visibility into your network connections in any environment, without the performance trade-offs.
Network observability for the cloud age
If you're already using Datadog to monitor your applications and infrastructure, you can enable Cloud Network Monitoring by following the steps outlined in our documentation. If you don't yet have a Datadog account, sign up for a full-featured trial here.
