Evan Mouzakitis
This post is the final part of a 3-part series on how to monitor Google Compute Engine. Part 1 explores the key metrics available from GCE, and part 2 is about collecting those metrics using Google-native tools.
To have a clear picture of GCE's operations, you need a system dedicated to storing, visualizing, and correlating your Google Compute Engine metrics with metrics from the rest of your infrastructure. If you’ve read our post on collecting GCE metrics, you've seen how you can quickly and easily pull metrics using the Stackdriver Monitoring API and gcloud, and had a chance to see Google's monitoring service, Stackdriver, in action.
Though these solutions are excellent starting points, they have their limitations, especially when it comes to integration with varied infrastructure components and platforms, as well as data retention for long-term monitoring and trend analysis.

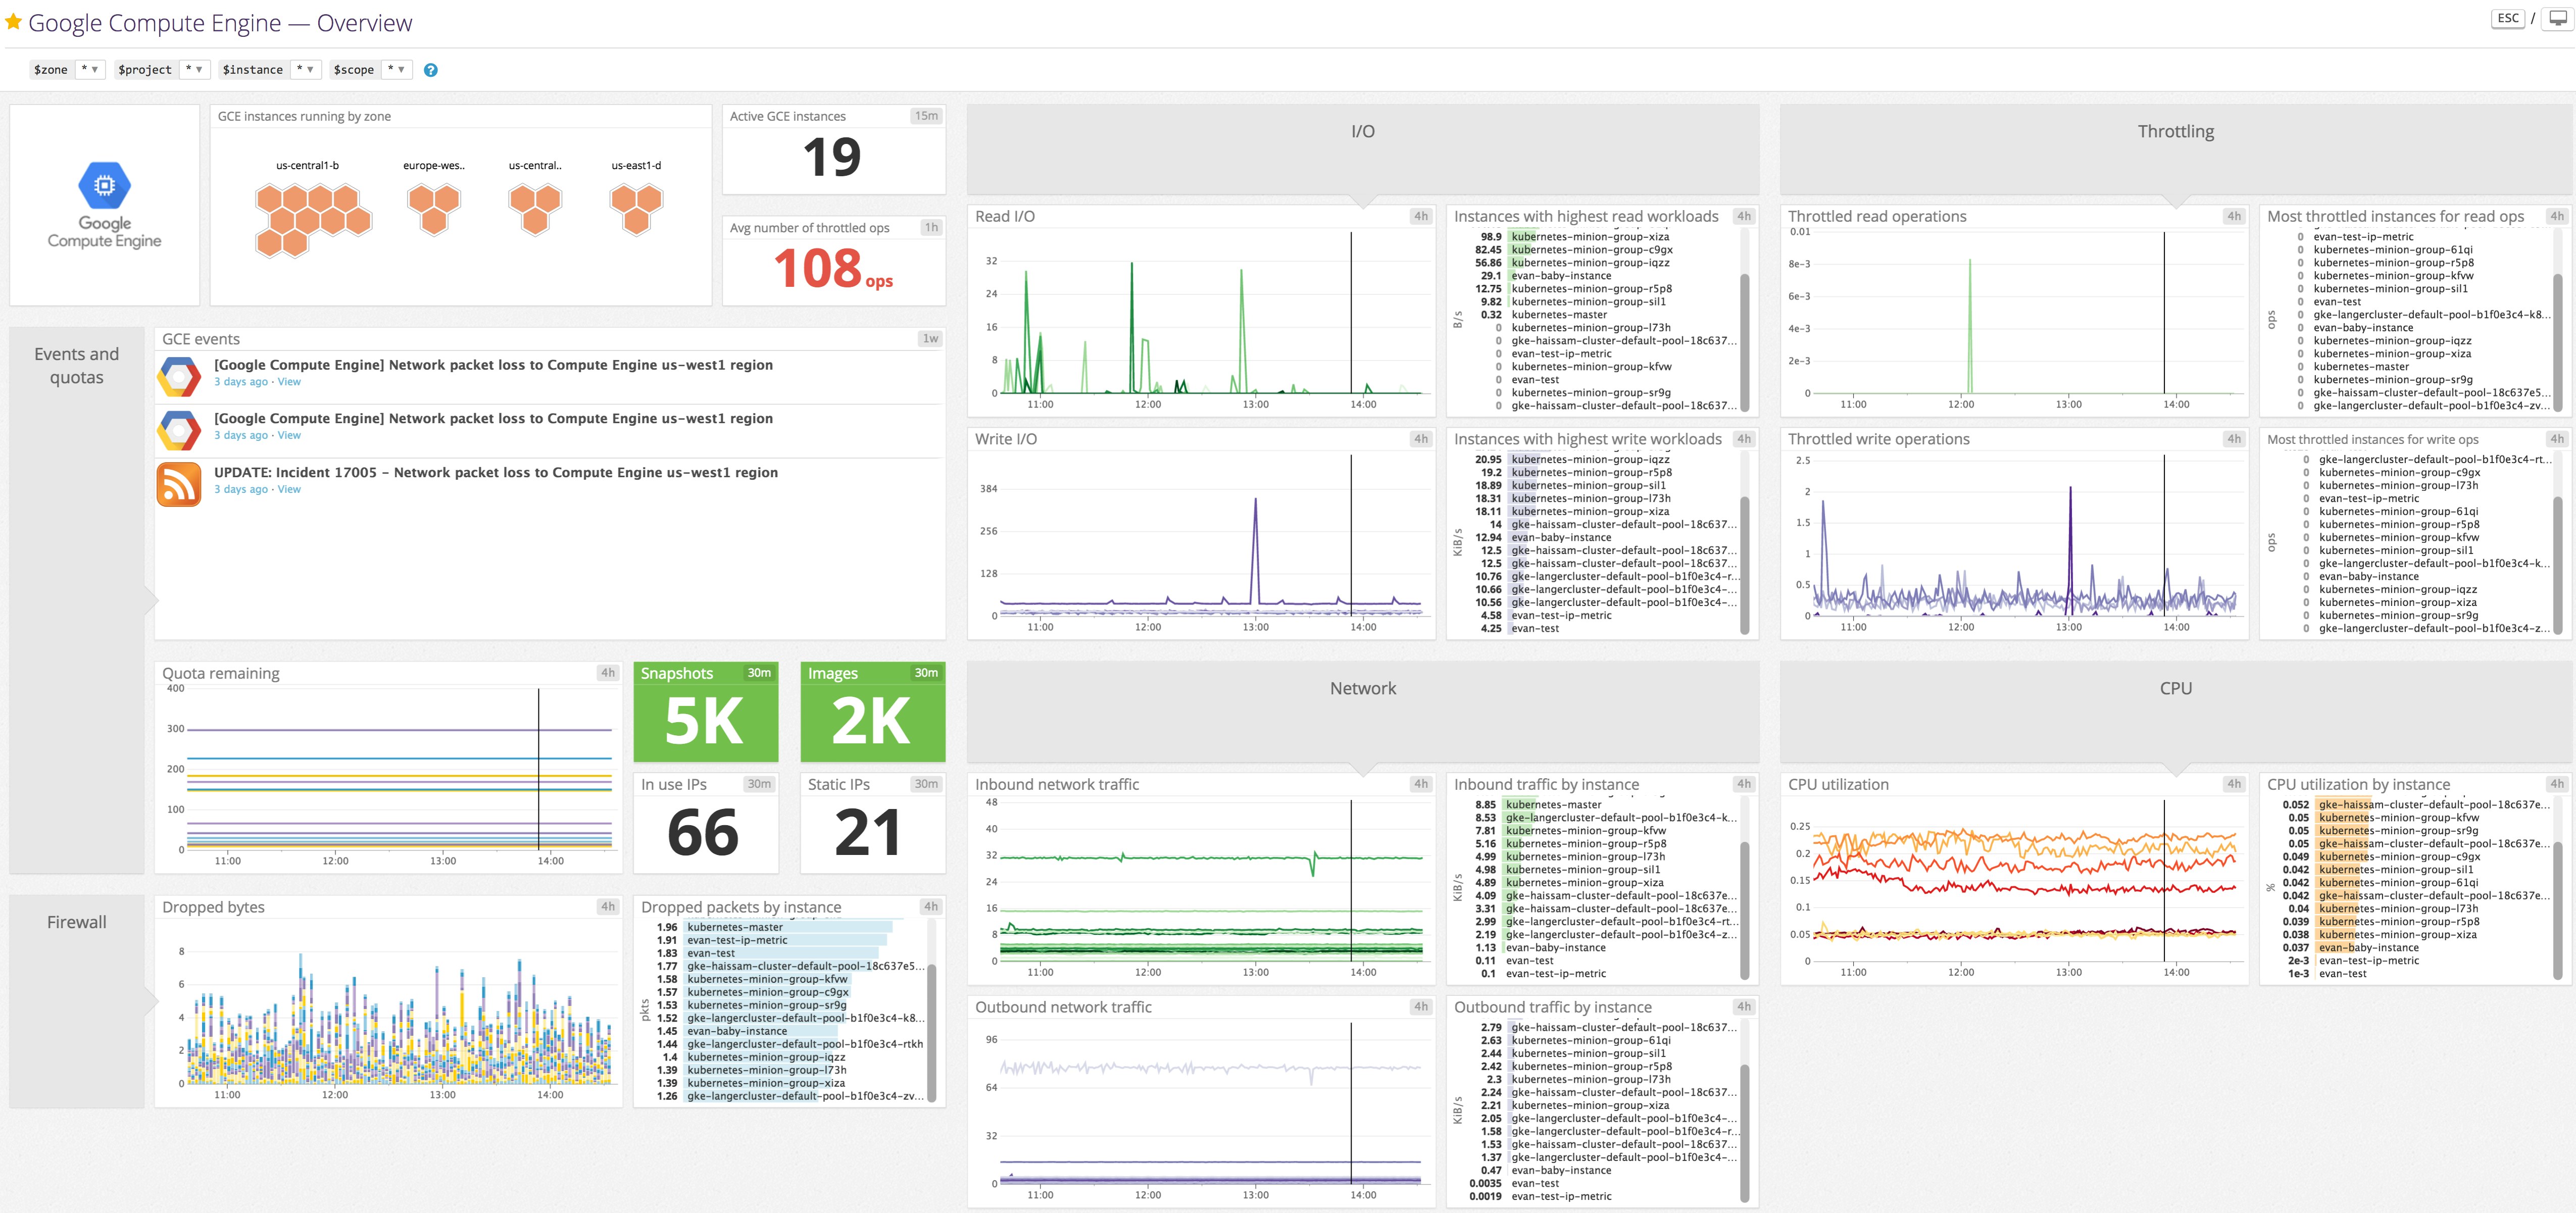
Datadog enables you to collect metrics from many Google Cloud platform services, including GCE, for visualization, alerting, and full-infrastructure correlation. Datadog will automatically collect the key performance metrics discussed in parts one and two of this series, and make them available in a customizable dashboard, as seen above. Datadog retains your data for 15 months at full granularity, so you can easily compare real-time metrics against values from last month, last quarter, or last year. And if you install the Datadog Agent, you gain additional system resource metrics (including memory usage, disk I/O, and more) and benefit from integrations with more than 850 technologies and services.
You can integrate Datadog with GCE in two ways:
- Enable the Google Cloud Platform integration to collect all of the metrics from the first part of this series
- Install the Agent to collect all system metrics, including those not available from Google's monitoring APIs
Enable the Google Cloud Platform integration
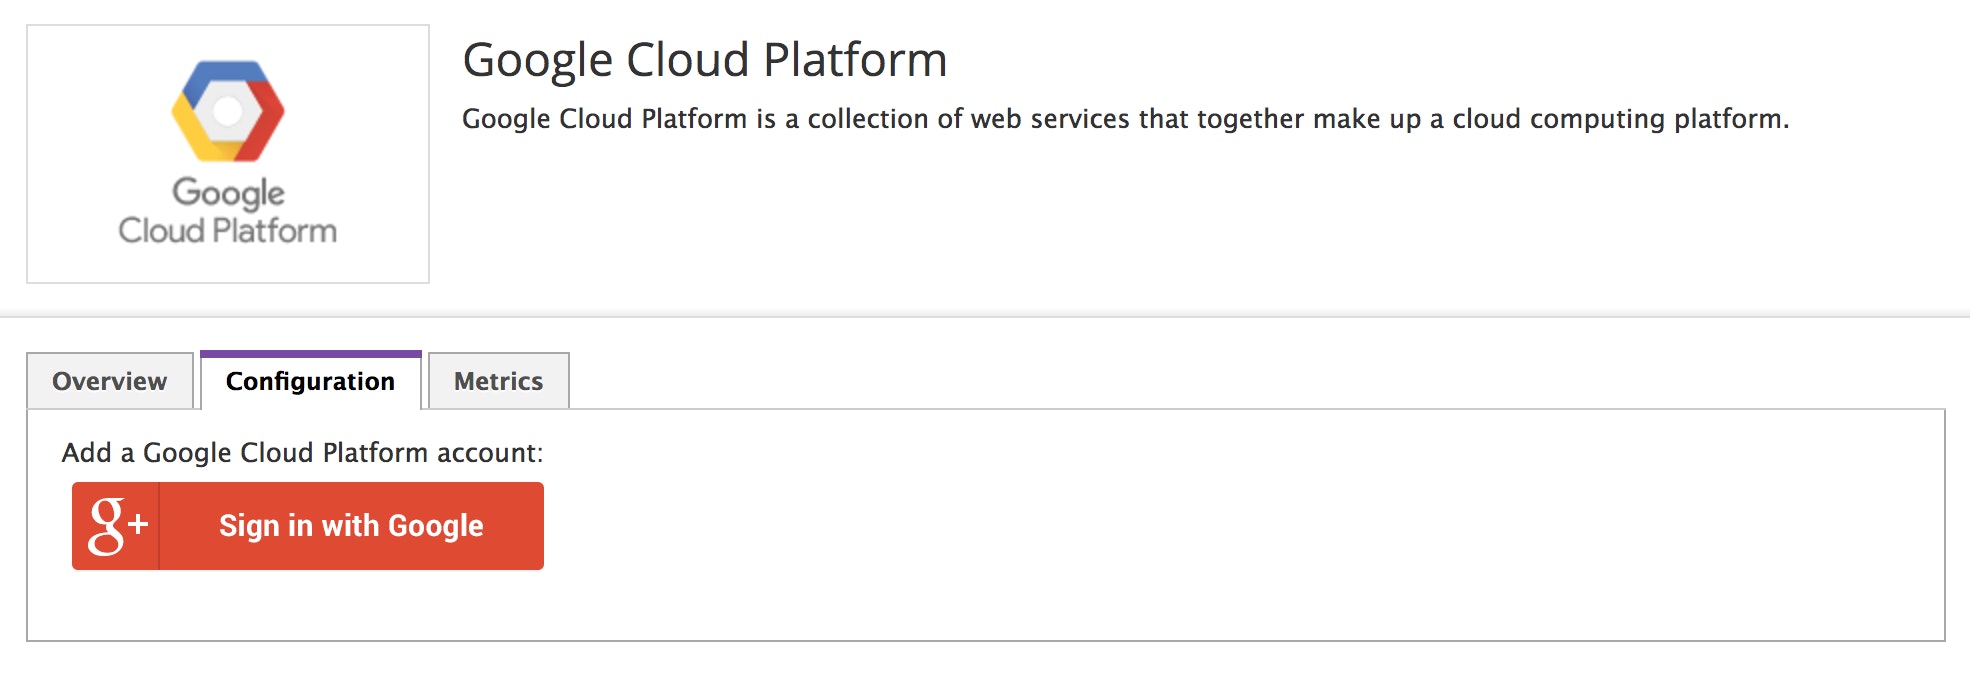
Enabling the Google Cloud Platform integration is the quickest way to start monitoring your GCE instances and the rest of your GCP resources, including Google App Engine applications and Google Container Engine (GKE) containers. And since Datadog supports OAuth login with your GCP account, you can start seeing your GCE metrics in just a few clicks.

Once signed in, add the id of the project you want to monitor, optionally restrict the set of hosts to monitor, and click Update Configuration.
After a couple of minutes you should see metrics streaming into the customizable Google Compute Engine dashboard. And if you're using other Google services, like Google App Engine or Google Pub/Sub, you'll automatically have access to built-in dashboards for those services, too.
Install the Agent
The Datadog Agent is open source software that collects and reports metrics from your hosts so that you can view and monitor them in Datadog. Installing the Agent usually takes just a single command.
Installation instructions for a variety of platforms are available here.
As soon as the Agent is up and running, you should see your host reporting metrics in your Datadog account.

No additional configuration is necessary, but if you want to collect more than just host metrics, head over to the integrations page to enable monitoring for over 850 applications and services.
Monitoring GCE with Datadog dashboards
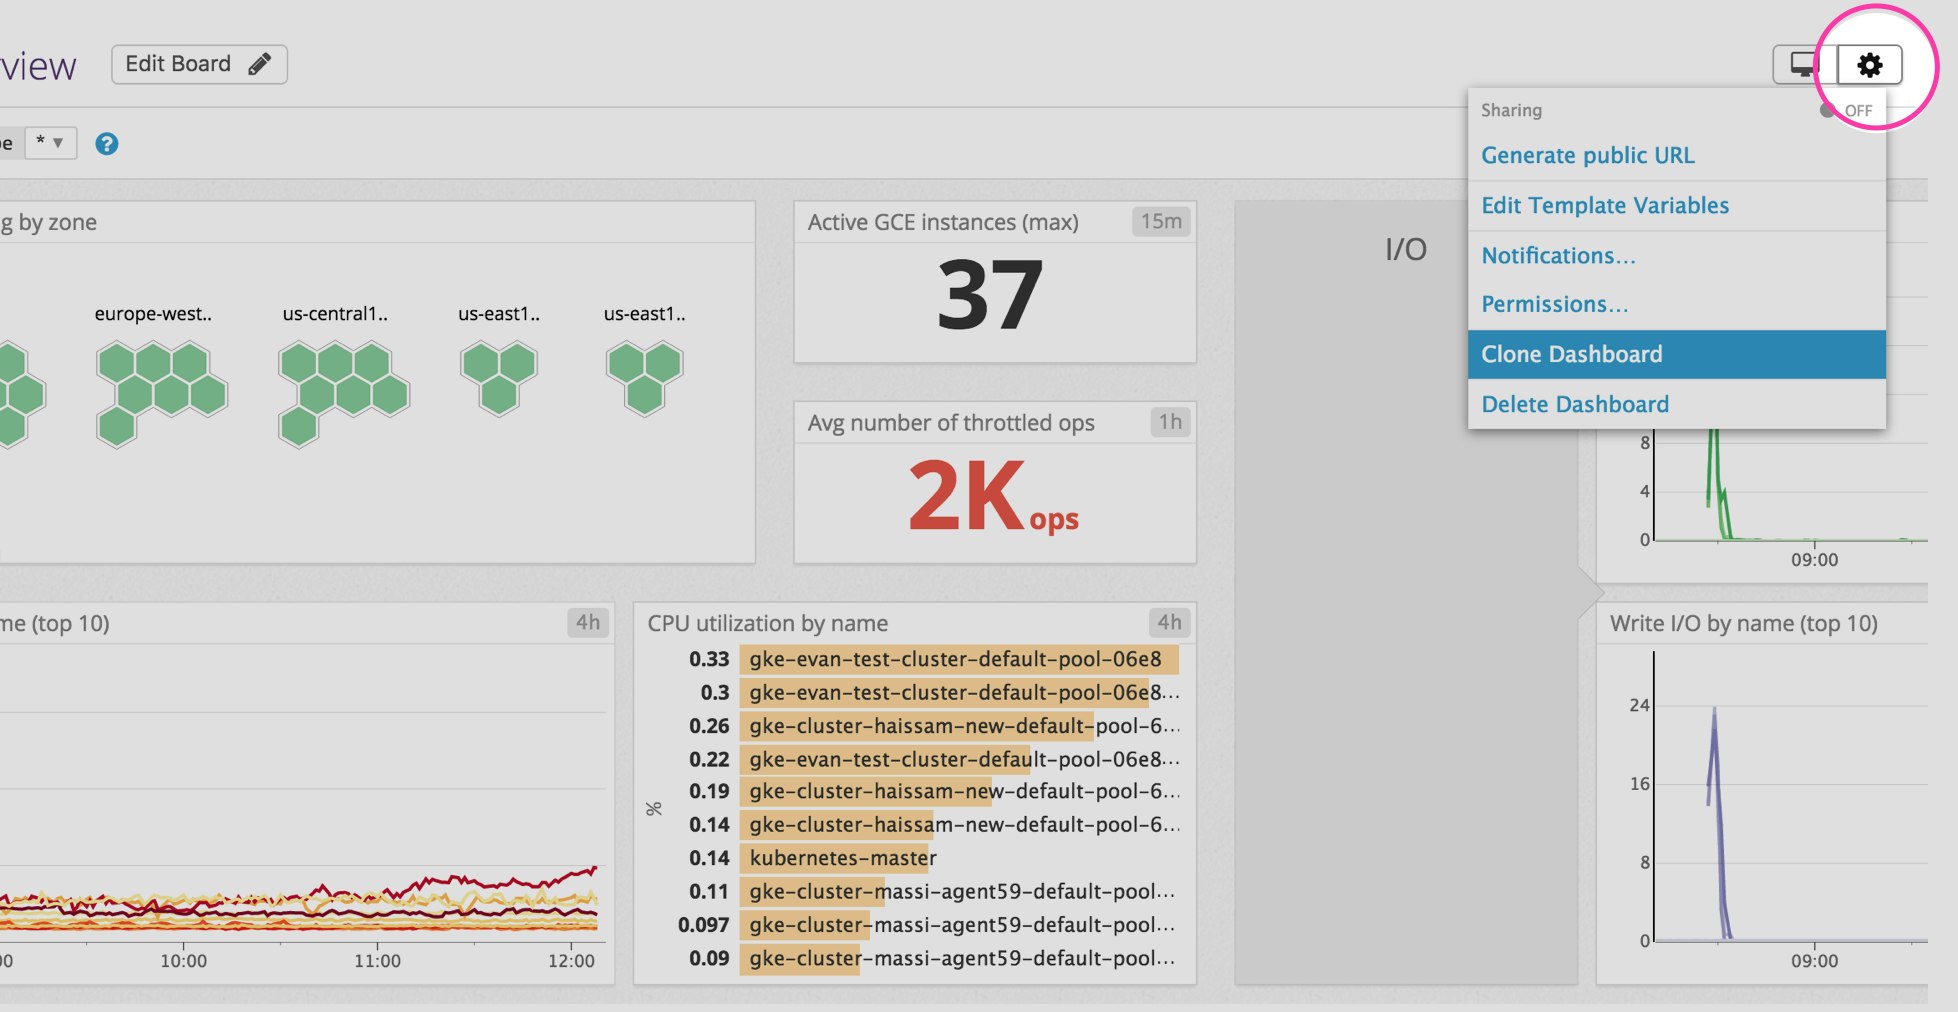
The template GCE dashboard in Datadog is a great resource, but you can easily create a more comprehensive dashboard to monitor your entire application stack by adding graphs and metrics from your other systems. For example, you might want to graph GCE metrics alongside metrics from Kubernetes or Docker, performance metrics from your applications, or host-level metrics such as memory usage on application servers. To start extending the template dashboard, clone the default GCE dashboard by clicking on the gear on the upper right of the dashboard and selecting Clone Dashboard.

Drilling down with tags
All Google Compute Engine metrics are tagged with the following information:
availability-zonecloud_providerinstance-typeinstance-idautomatic-restarton-host-maintenacenumeric_project_idnameprojectzone- any additional labels and tags you added in GCP

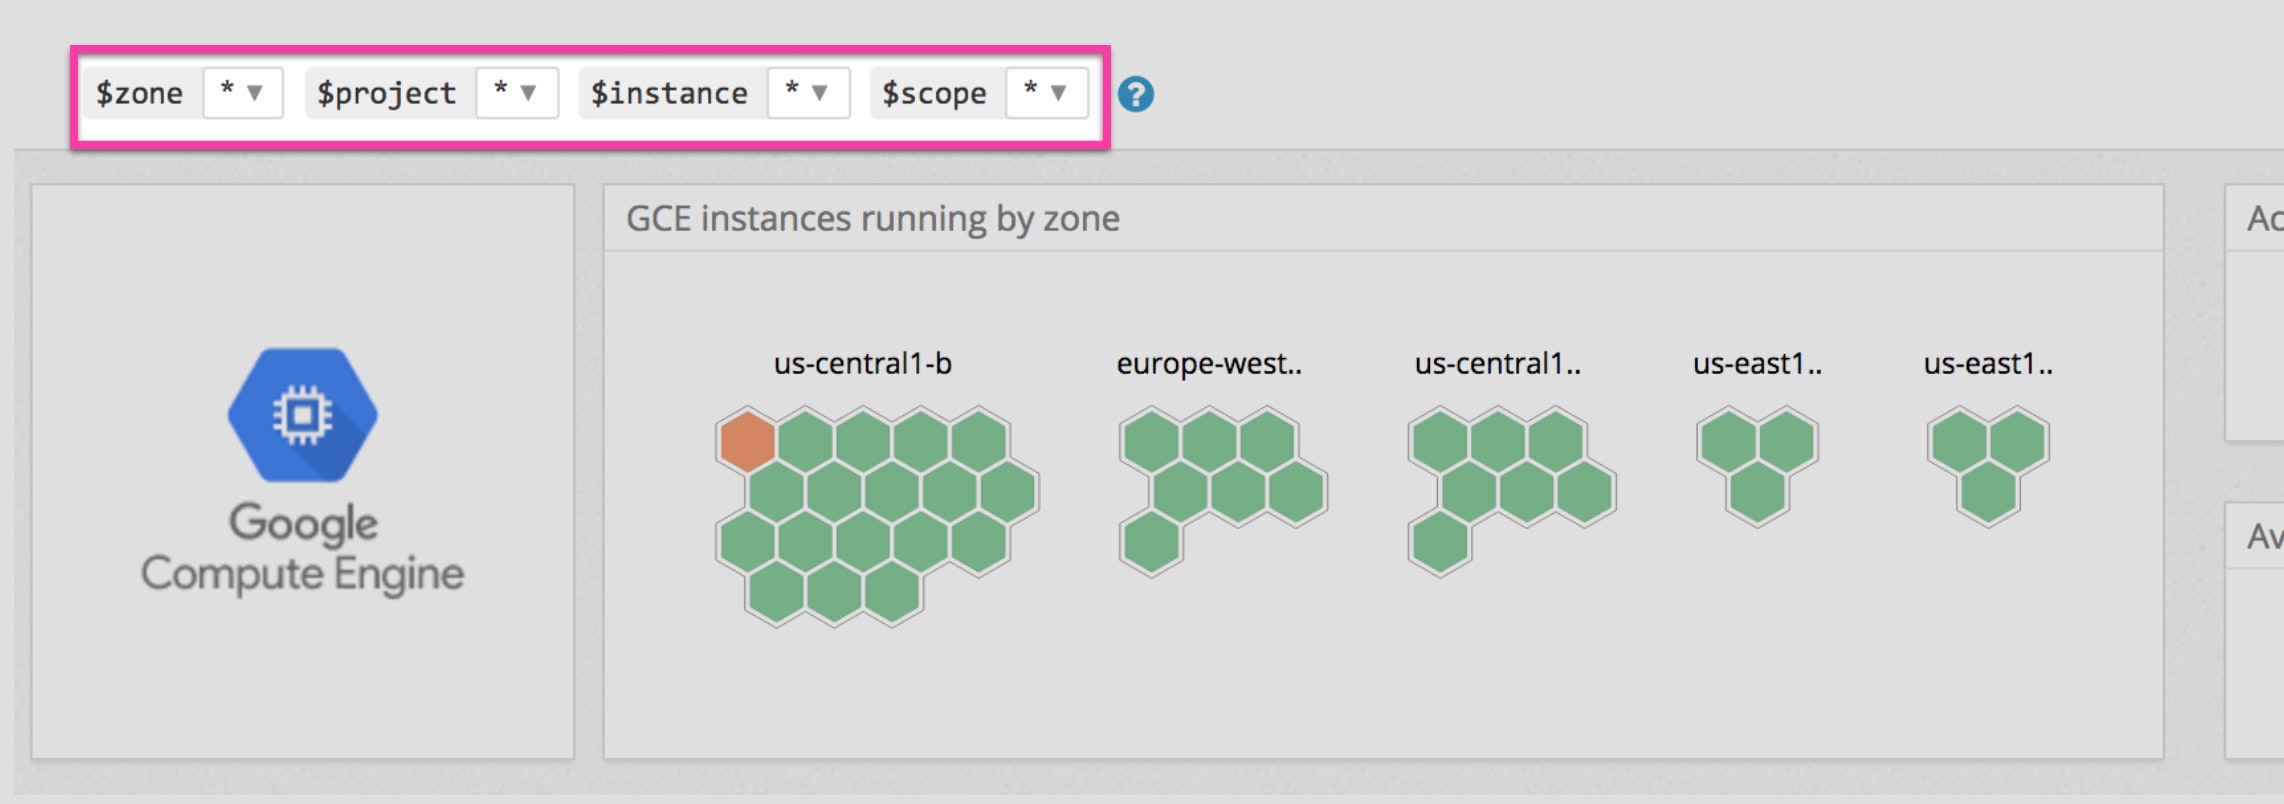
You can easily slice your metrics to isolate a particular subset of hosts using tags. In the out-of-the-box GCE screenboard, you can use the template variable selectors in the upper left to drill down to a specific host or set of hosts. And you can similarly use tags in any Datadog graph or alert definition to filter or aggregate your metrics.
Alerts
Once Datadog is capturing and visualizing your metrics, you will likely want to set up some alerts to be automatically notified of potential issues. With powerful algorithmic alerting features like outlier detection and anomaly detection, you can be automatically alerted to unexpected instance behavior.
Observability awaits
We’ve now walked through how to use Datadog to collect, visualize, and alert on your Google Compute Engine metrics. If you’ve followed along with your Datadog account, you should now have greater visibility into the state of your instances.
If you don’t yet have a Datadog account, you can start monitoring Google Compute Engine right away with a free trial.
Source Markdown for this post is available on GitHub. Questions, corrections, additions, etc.? Please let us know.


