Evan Mouzakitis
This post is part 1 in a 3-part series about monitoring Google Compute Engine (GCE). Part 2 covers the nuts and bolts of collecting GCE metrics, and part 3 describes how you can get started collecting metrics from GCE with Datadog. This article describes in detail the resource and performance metrics that can be obtained from GCE.
What is Google Compute Engine?
Google Compute Engine (GCE) is an infrastructure-as-a-service platform that is a core part of the Google Cloud Platform. The fully managed service enables users around the world to spin up virtual machines on demand. It can be compared to services like Amazon’s Elastic Compute Cloud (EC2), or Azure Virtual Machines.
GCE powers a large number of high-profile businesses including Philips, Evernote, and HTC.
Key GCE metrics
Because GCE provides the underlying infrastructure to host applications and services, the majority of available metrics are related to low-level resources. Most standard system-level metrics, like CPU utilization and network throughput, are available for Google Compute Engine. Other metrics, like memory utilization, are not available at all without using a third-party tool, and some of the standard metrics have nuances and quirks specific to the GCE platform. We’ll cover those in detail below.
GCE metrics can generally be broken down into the following three categories:
A note about terminology: In the metric breakdowns below, we’ll include the relevant metadata that you can use to filter and aggregate your metrics. Google refers to this metadata as labels, whereas on some other platforms (including Datadog) the same metadata is known as tags. It’s worth mentioning that Google also has a concept of tags, which are used to apply network and firewall settings. Lastly, we will use the terms “virtual machine”, “instance”, and “host” interchangeably.
Instance metrics
Instance metrics shed light on resource utilization at the individual host level. GCE emits metrics on the following compute resources:
All instance metrics are prefixed with compute.googleapis.com/ in GCE. The prefix has been omitted in the tables below, for brevity. (We’ll demonstrate how to use these metric names to collect data in the second part of this series.) Note that if you are using the deprecated v2 API for Google’s Stackdriver monitoring service, some of the metrics below may not be available for collection.
CPU metrics
| Metric | Google metric name | Labels | Metric Type |
|---|---|---|---|
| CPU utilization (as a fraction of 1) | instance/cpu/utilization | instance_name: Name of VM | Resource: Utilization |
CPU utilization
For machines performing heavy computation, high or maxed-out CPU utilization is expected. In other cases, extended periods of high CPU utilization can indicate a resource bottleneck. In those cases, by monitoring CPU utilization, you can more appropriately provision compute resources.

Even though CPU utilization is reported as a fraction of total available CPU, you should note that it is possible to have CPU utilization greater than 1 on share-core instance types that allow bursting, specifically f1-micro and g1-small type instances.
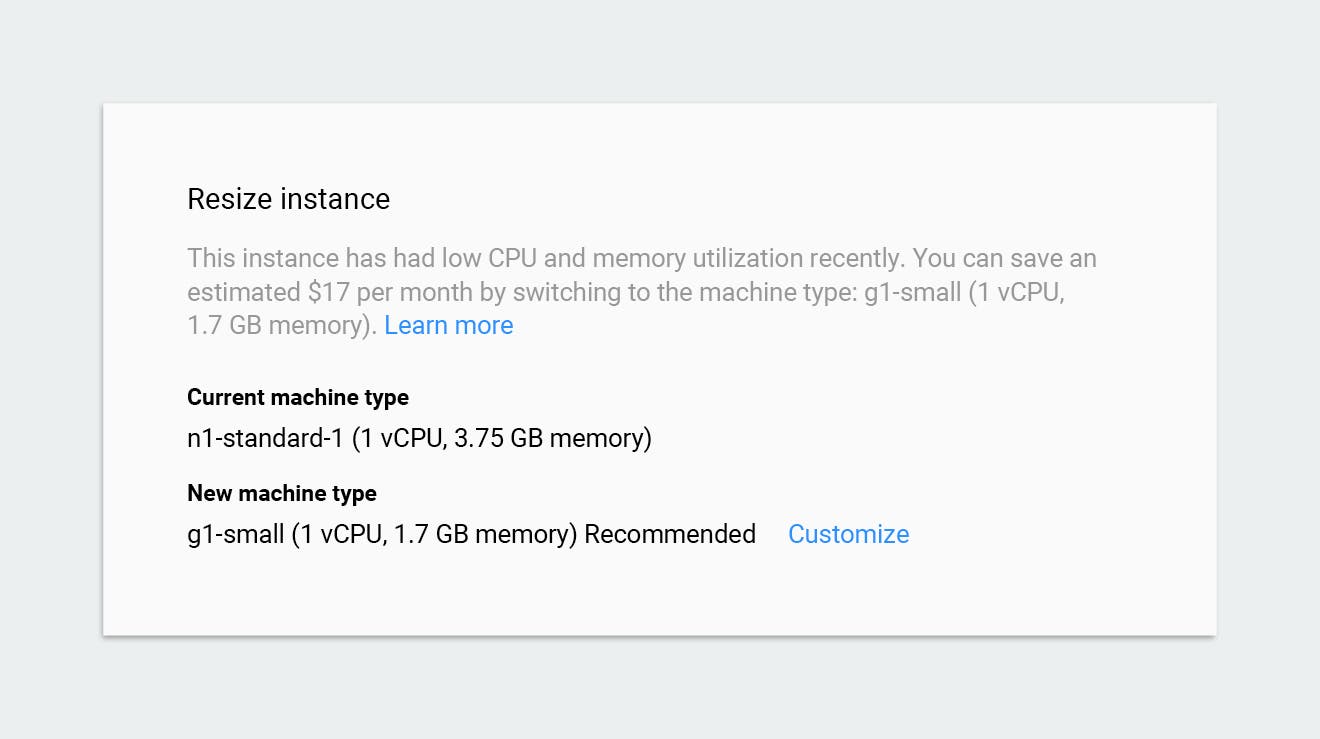
Google Cloud Platform will helpfully suggest a machine type upgrade if the platform detects prolonged periods of extended resource consumption, and alternatively, it will suggest a downgrade if your compute resources are underutilized.

Disk metrics
| Metric | Google metric name | Labels | Metric Type |
|---|---|---|---|
| Count of disk read/write bytes | instance/disk/read_bytes_count instance/disk/write_bytes_count | instance_name: Name of VM device_name: Name of disk storage_type: HDD or SSD device_type: Permanent (attached) or ephemeral | Resource: Utilization |
| Count of disk read/write operations | instance/disk/read_ops_count instance/disk/write_ops_count | instance_name device_name storage_type device_type | Resource: Utilization |
| Count of throttled read/write operations | instance/disk/throttled_read_ops_count instance/disk/throttled_write_ops_count | instance_name device_name storage_type device_type | Resource: Saturation |
Disk read/write bytes
Measuring disk throughput at the host level is fundamental to diagnosing performance issues in hosted applications. By tracking the volume of data being written to/read from disk, you have the information you need to better determine if the underlying cause of degraded performance is due to a disk bottleneck, or something else altogether. Correlating disk throughput with application performance metrics, as well as other system metrics like I/O operations and CPU utilization, can help you identify friction points in your infrastructure and applications.
Disk read/write operations
Instances hosting I/O-intensive applications will benefit from monitoring disk operations. This pair of metrics provides an aggregate measure of the total rate of I/O operations, which is useful for quickly identifying machines where there is contention for disk access. Prolonged periods of high disk activity could result in performance degradation for other applications hosted on the same instance.
Throttled read/write operations

Throttling occurs when the disk is saturated with read/write requests, preventing those requests from being serviced in a timely manner. Though we do not have direct visibility into the I/O queue, we can infer its size by observing the throttle rate in relation to the general I/O rate. Generally speaking, large numbers of throttled I/O operations indicate a resource bottleneck; of course, if the instance is being used to host a database server or similar I/O-intensive application, some number of throttled operations should be expected. However, prolonged periods of I/O throttling should be investigated, and potentially remedied by scaling your data storage.
Network metrics
Monitoring network traffic is essential to identifying network issues and bottlenecks, and can also help you to surface issues in the unlikely event you run into the egress throughput limit.
| Metric | Google metric name | Labels | Metric Type |
|---|---|---|---|
| Count of sent bytes/received bytes | instance/network/sent_bytes_count instance/network/received_bytes_count | instance_name: Name of VM loadbalanced: True/False if traffic received from load-balanced IP address | Resource: Utilization |
Sent bytes/received bytes
Though the network is rarely the source of bottlenecks, keeping an eye on network throughput is essential to detecting issues early. Unexpected drops in throughput are good indicators of application issues. Correlating network throughput with metrics from applications hosted on your instance could shed light on issues arising in those applications. Google limits outbound instance traffic to a generous 2 gigabits per second per CPU core. In the event that you are saturating your network link, you may consider increasing your bandwidth by upgrading to a larger instance.
Firewall metrics
Each network in Google Cloud Platform has its own firewall, allowing administrators to set inbound network access restrictions. (To limit outbound traffic, Google suggests using a tool like iptables on your instances.) By default, GCE restricts traffic on commonly abused ports, specifically STMP traffic (port 25), and encrypted SMTP traffic (ports 465 and 587) destined for a non-Google IP address, in addition to all traffic using a protocol that is not TCP, UDP, or ICMP (unless explicitly forwarded).
| Metric | Google metric name | Labels | Metric Type |
|---|---|---|---|
| Count of incoming bytes dropped due to firewall policy | firewall/dropped_bytes_count | instance_name: Name of VM | Other |
| Count of incoming packets dropped due to firewall policy | firewall/dropped_packets_count | instance_name | Other |
Dropped bytes and packets
Observing the drop rate of incoming packets and the amount of data dropped serves two purposes: potential attacks against your infrastructure are more readily surfaced, and diagnosing network configuration issues becomes easier.

For example, if you recently configured your instance as a web application server but did not enable inbound access to the application’s listening port, you should see a marked increase in both dropped packets and bytes, as the upstream servers unsuccessfully attempt to pass traffic to your app server.
Project metrics
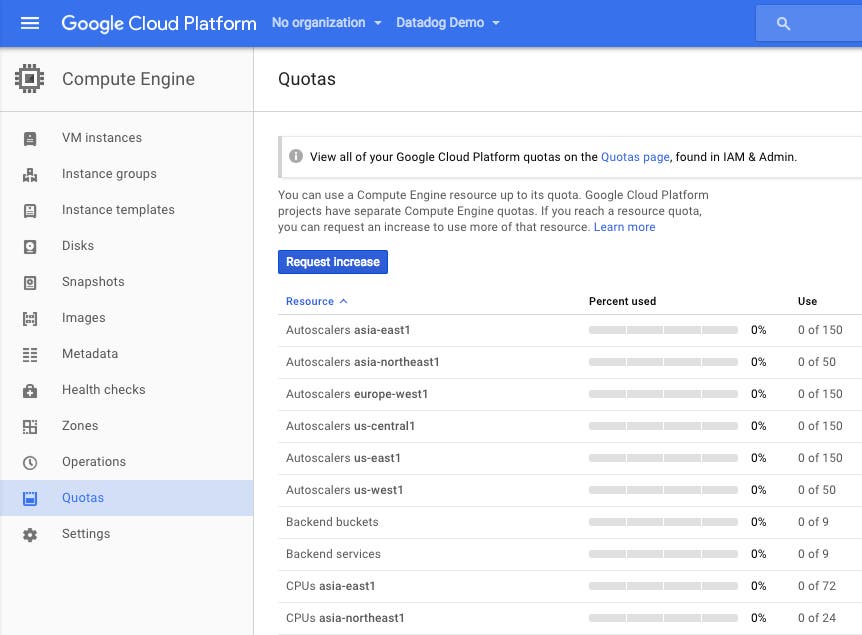
Like most cloud service providers, Google Compute Engine has limits on the number of resources a project may consume. Though quota metrics are not usually used for troubleshooting issues in your environment, they are useful for tracking resource consumption/growth over time, as well as anticipating potential future issues (like bumping into the quota limit) before they arise. Of course, the specific quotas you wish to monitor will be dependent on your use case and resource use. In part two of this series, we’ll walk through collecting these metrics using tools provided by Google.
Each of the quota metrics outlined below have two variants:
usage: the actual number of resources in uselimit: the maximum number of resources allowed
| Quota | Description | Limit |
|---|---|---|
| snapshots | Number of moment-in-time captures of an instance’s disk | 1000 |
| networks | Number of legacy (non-grouped) networks | 5 |
| firewall rules | Number of firewall rules | 100 |
| images | Number of disk images | 2000 |
| static_addresses | Number of static IP addresses | 1 |
| routes | Number of routes for routing traffic to instances | 200 |
| routers | Number of routers | 10 |
| forwarding_rules | Number of forwarding rules (for packet-forwarding to a group of VMs) | 15 |
| target_pools | Number of target pools (instance groups that receive inbound traffic) | 50 |
| health_checks | Aggregate number of HTTP and HTTPS health checks | 50 |
| in_use_addresses | Number of external IP addresses | 23 |
| target_instances | Number of target instances | 50 |
| target_http_proxies | Number of HTTP proxies | 10 |
| url_maps | Number of URL maps (for load balancing) | 10 |
| backend_services | Number of handlers configured for serving load-balanced traffic | 5 |
| instance_templates | Number of instance templates | 100 |
| target_vpn_gateways | Number of target VPN gateways | 5 |
| vpn_tunnels | Number of VPN tunnels | 10 |
| target_ssl_proxies | Number of SSL proxies | 10 |
| target_https_proxies | Number of HTTPS proxies | 10 |
| ssl_certificates | Number of SSL certificates | 10 |
| subnetworks | Number of subnet networks | 100 |
It’s worth mentioning that if you are approaching (or have reached) your quota for a specific resource, you can easily request an increase from within the Google Cloud Platform console.

Time to collect
We’ve now explored the key metrics emitted by Google Compute Engine that you should monitor to keep tabs on the health and performance of your virtual machines. As you may have noted, the number of metrics emitted by GCE is enough to give you a rough idea of the health and performance of your virtual machine. However, over time you will likely identify additional metrics, like memory metrics for example, that are needed to provide further visibility into your application infrastructure.
Read on for a comprehensive guide to collecting all of the performance and project metrics described in this article using a variety of standard tools.
Acknowledgment
Thanks to Ahmer B. Sabri, Senior Technical Program Manager—Google Cloud, for graciously sharing his Google Compute Engine knowledge for this article.
Source Markdown for this post is available on GitHub. Questions, corrections, additions, etc.? Please let us know.


