Jean-Mathieu Saponaro
Google Compute Engine (GCE), part of the suite of services offered on the Google Cloud Platform (GCP), provides you on-demand and easily scalable virtual machines. Launched in 2013, it has become a serious alternative to AWS EC2 and has been adopted by major companies such as Spotify, which decided to move all its infrastructure to GCP in early 2016.
As the core of your cloud infrastructure, virtual machine instances need to be closely monitored in order to spot hiccups and bottlenecks, to enable rapid investigation of any issue, and to know when to scale up.
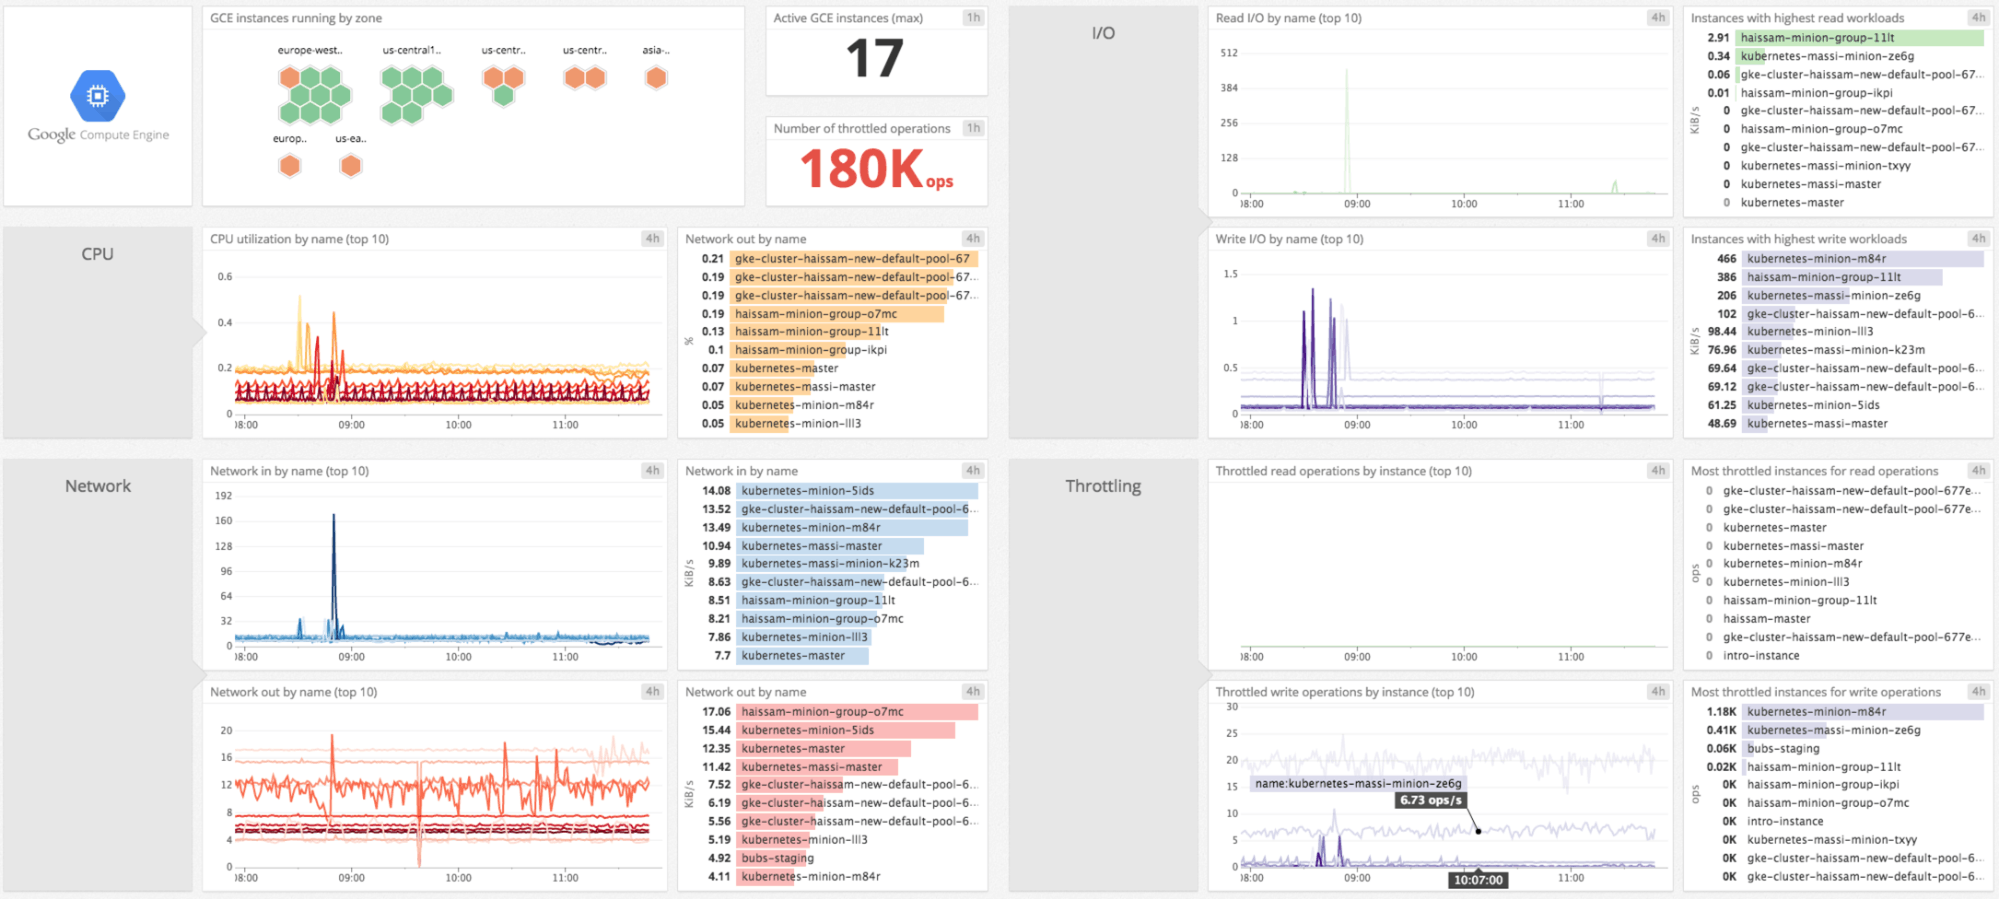
Datadog collects the Google Compute Engine performance metrics you need, and is an easy way to monitor your VM instances’ activity, health, and performance. Datadog provides highly targeted alerts, and can correlate what’s happening in GCE with metrics and events from the rest of your infrastructure.

The Compute Engine performance metrics you need
Google Compute Engine’s performance metrics are collected by the Datadog integration so you can properly monitor your GCE instances with:
- Status checks to see if your instances are down or running properly
- Metrics tracking the percentage of allocated CPU currently in use on the instance. Note that some instance types allow bursting above 100% usage.
- Throughput metrics to give you insights on:
- I/O: number of read and write operations as well as volume of data read from or written to disk
- Network: volume of data received and sent over the network
- Saturation: number of throttled read and write operations as well as the corresponding amount of data being throttled
In our docs, you will find a list of all the metrics collected from GCE, with a brief description of each.

Runtime slicing with tags
Datadog automatically tags your GCE metrics with their associated instance type, host name, availability zone, and more. Tags are automatically formatted as key:value pairs, such as region:us-central1, which allows you to aggregate your incoming metrics from different instances. For example, you can monitor the average CPU utilization by region and determine if additional machines need to be spun up to meet localized demand.
Any network tags and labels assigned to your Google Compute Engine instances will also appear as tags in Datadog.
You can use tags to slice and dice your metrics, and to filter and group your hosts for a comprehensive view of your infrastructure.
And all the power of Datadog
You can of course use all the features Datadog offers, from advanced alerting mechanisms to host maps and outlier detection, to properly monitor GCE and effectively investigate any performance issue.

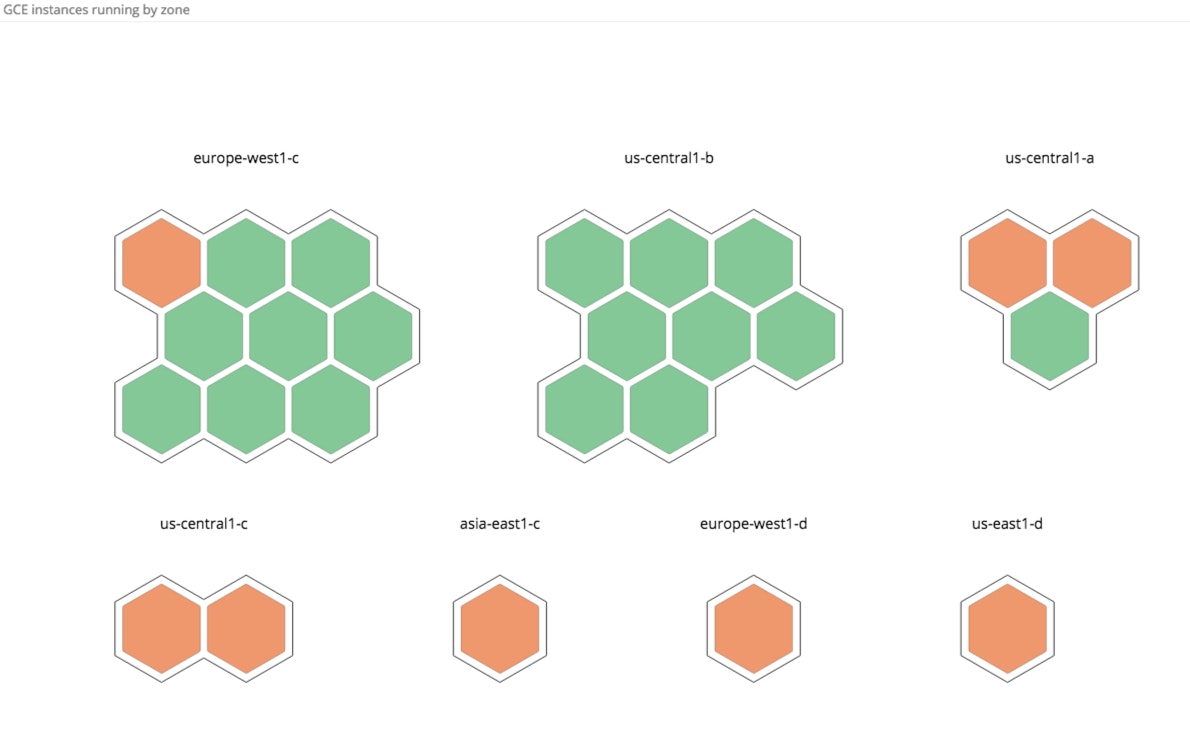
Host maps provide you a bird’s-eye view of all your Google Compute Engine instances so you can check their health at a glance. You can then filter and group them using any of your labels and tags.
Start monitoring GCE in a few seconds
If you are already a Datadog user, you can start monitoring GCE as part of our integration with Google Cloud Platform. Otherwise you can sign up for a free trial and immediately start monitoring your Google Compute Engine instances alongside the rest of your infrastructure, applications, and services.


