Jean-Mathieu Saponaro
This post is the last of a 3-part series on monitoring Amazon ELB. Part 1 explores its key performance metrics, and Part 2 explains how to collect these metrics.
Note: The metrics referenced in this article pertain to classic ELB load balancers. If you want to learn how to monitor Application Load Balancer metrics, read this blog post.
If you’ve already read our post on collecting Elastic Load Balancing metrics, you’ve seen that you can visualize their recent evolution and set up simple alerts using the AWS Management Console’s web interface. For a more dynamic and comprehensive view, you can connect ELB to Datadog.
Datadog lets you collect and view ELB metrics, access their historical evolution, and slice and dice them using any combination of properties or custom tags. Crucially, you can also correlate ELB metrics with metrics from any other part of your infrastructure for better insight—especially native metrics from your backend instances. And with more than 100 supported integrations, you can create and send advanced alerts to your team using collaboration tools such as PagerDuty and Slack.
In this post we’ll show you how to get started with the ELB integration, and how to correlate your load balancer performance metrics with your backend instance metrics.

Integrate Datadog and ELB
To start monitoring ELB metrics, you only need to configure our integration with AWS CloudWatch by setting up role delegation in AWS IAM. You’ll need to create a role for Datadog and attach a policy that grants read-only access to your AWS services, by following the steps listed in our documentation.
Once these credentials are configured within AWS, follow the simple steps on the AWS integration tile on Datadog to start pulling ELB data.
Note that if, in addition to ELB, you are using RDS, SES, SNS, or other AWS products, you may need to grant additional permissions to the role. See here for the complete list of permissions required to take full advantage of the Datadog–AWS integration.
Keep an eye on all key ELB metrics
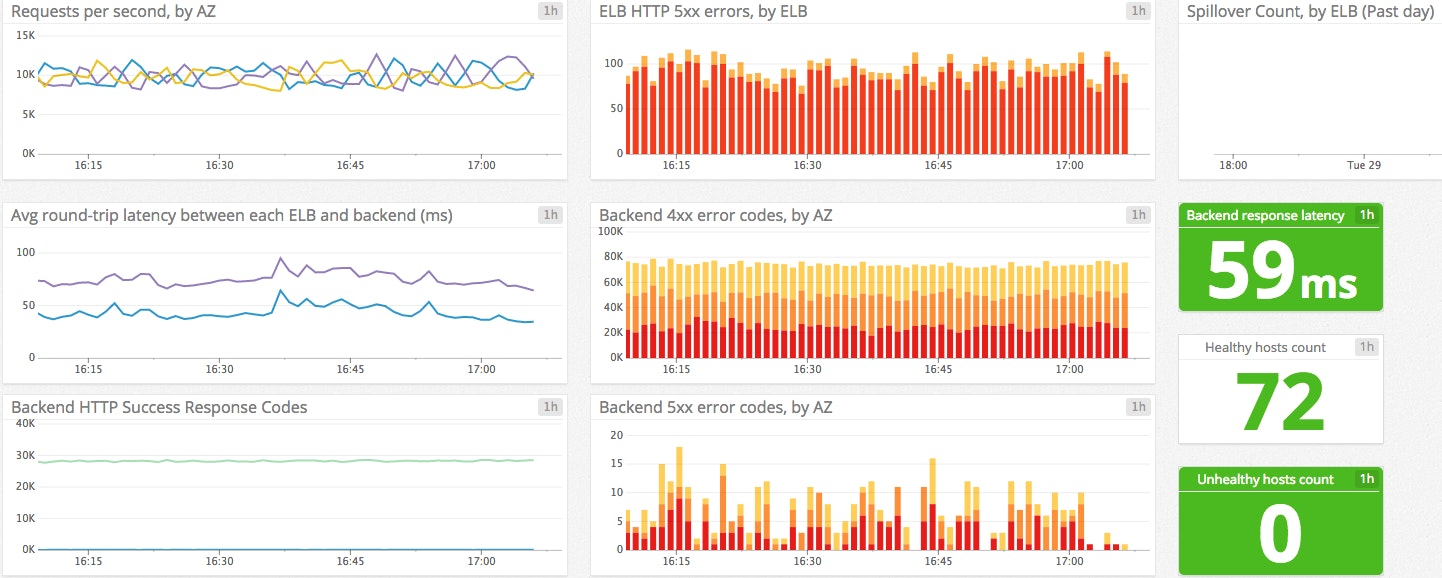
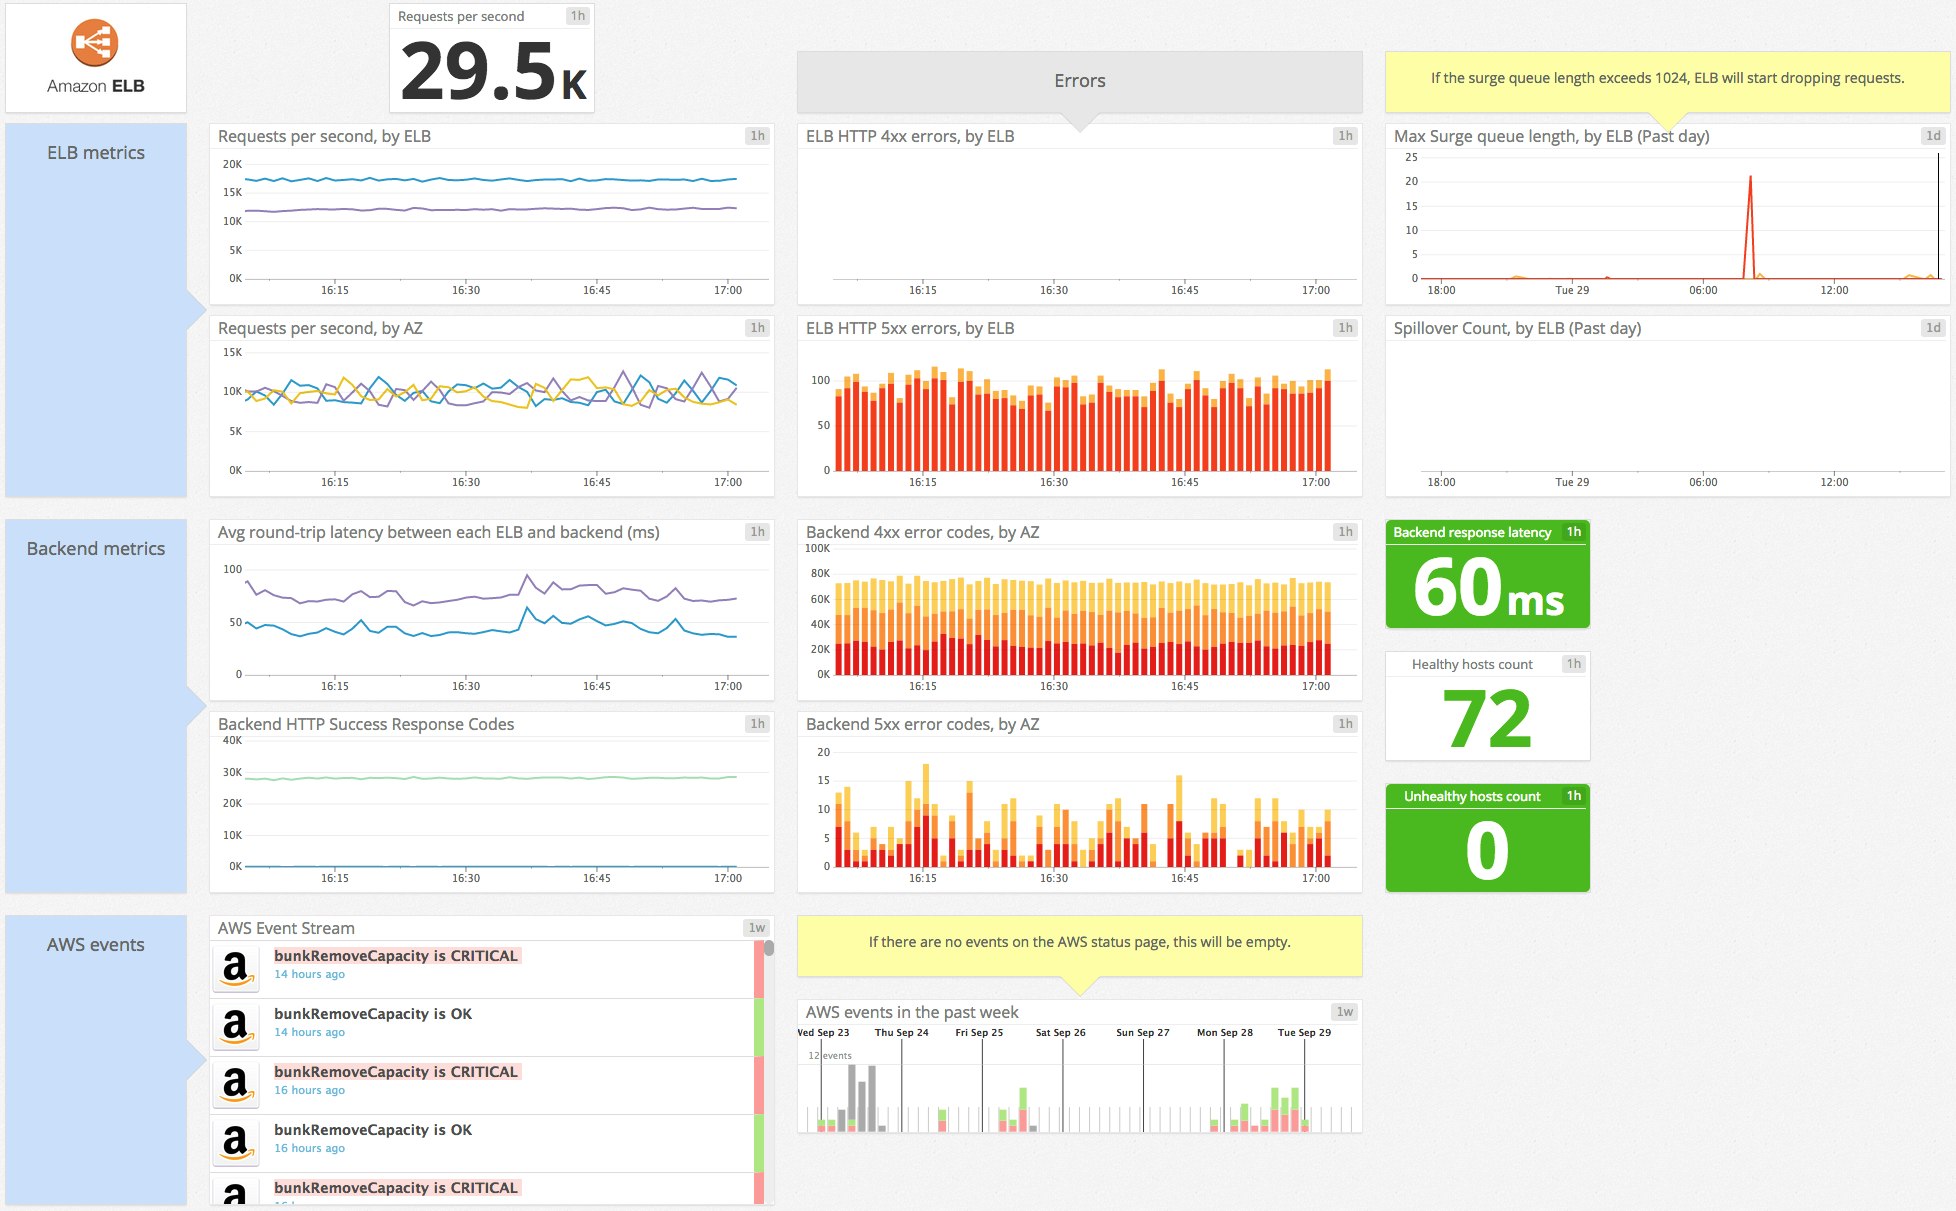
Once you have successfully integrated Datadog with ELB, you will see a default dashboard called “AWS-Elastic Load Balancers” in your list of integration dashboards. The ELB dashboard displays all of the key metrics highlighted in Part 1 of this series: requests per second, latency, surge queue length, spillover count, healthy and unhealthy hosts counts, HTTP code returned, and more.

Customize your dashboards
Once you are capturing metrics from Elastic Load Balancing in Datadog, you can build on the default dashboard and edit or add additional graphs of metrics from ELB or even from other parts of your infrastructure. To start building a custom screenboard, clone the default ELB dashboard by clicking on the gear on the upper right of the default dashboard.
Collect, visualize, and alert on Amazon ELB metrics in minutes with Datadog.
You can also create timeboards, which are interactive Datadog dashboards displaying the evolution of multiple metrics across any timeframe.
Correlate ELB with EC2 metrics
As explained in Part 1, CloudWatch’s ELB-related metrics inform you about your load balancers’ health and performance. ELB also provides backend-related metrics reflecting your backend instances health and performance. However, to fully monitor your backend instances, you should consider collecting these backend metrics directly from EC2 as well for better insight. By correlating ELB with EC2 metrics, you will be able to quickly investigate whether, for example, the high number of requests being queued by your load balancers is due to resource saturation on your backend instances (memory usage, CPU utilization, etc.).
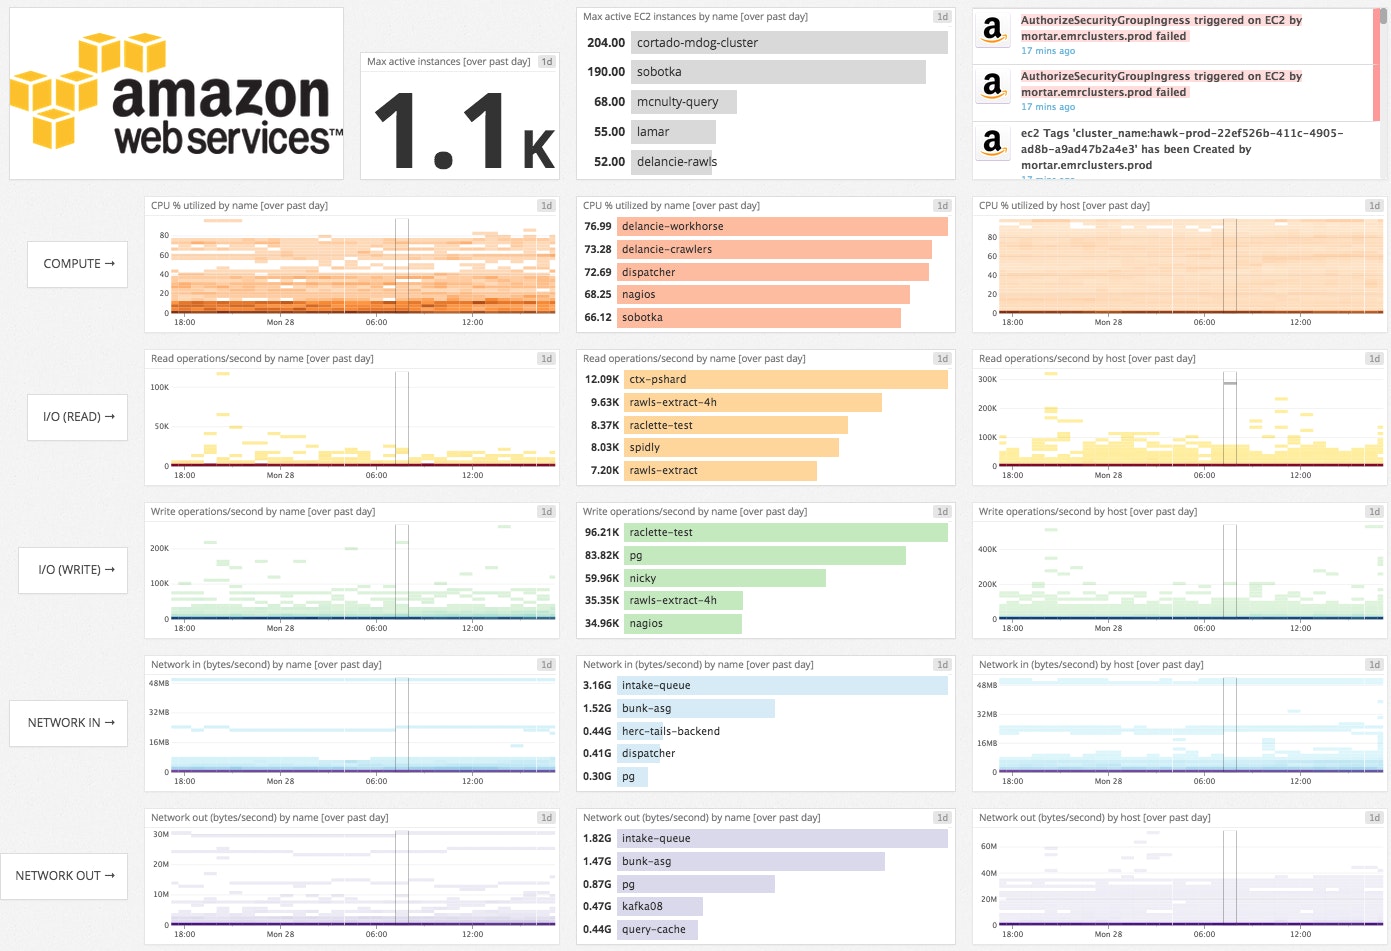
Thanks to our integration with CloudWatch and the permissions you set up, you can already access EC2 metrics on Datadog. Here is your default dashboard for EC2.

You can add graphs to your custom dashboards and view side by side ELB and EC2 metrics. Correlating peaks in two different metrics to see if they are linked is very easy.
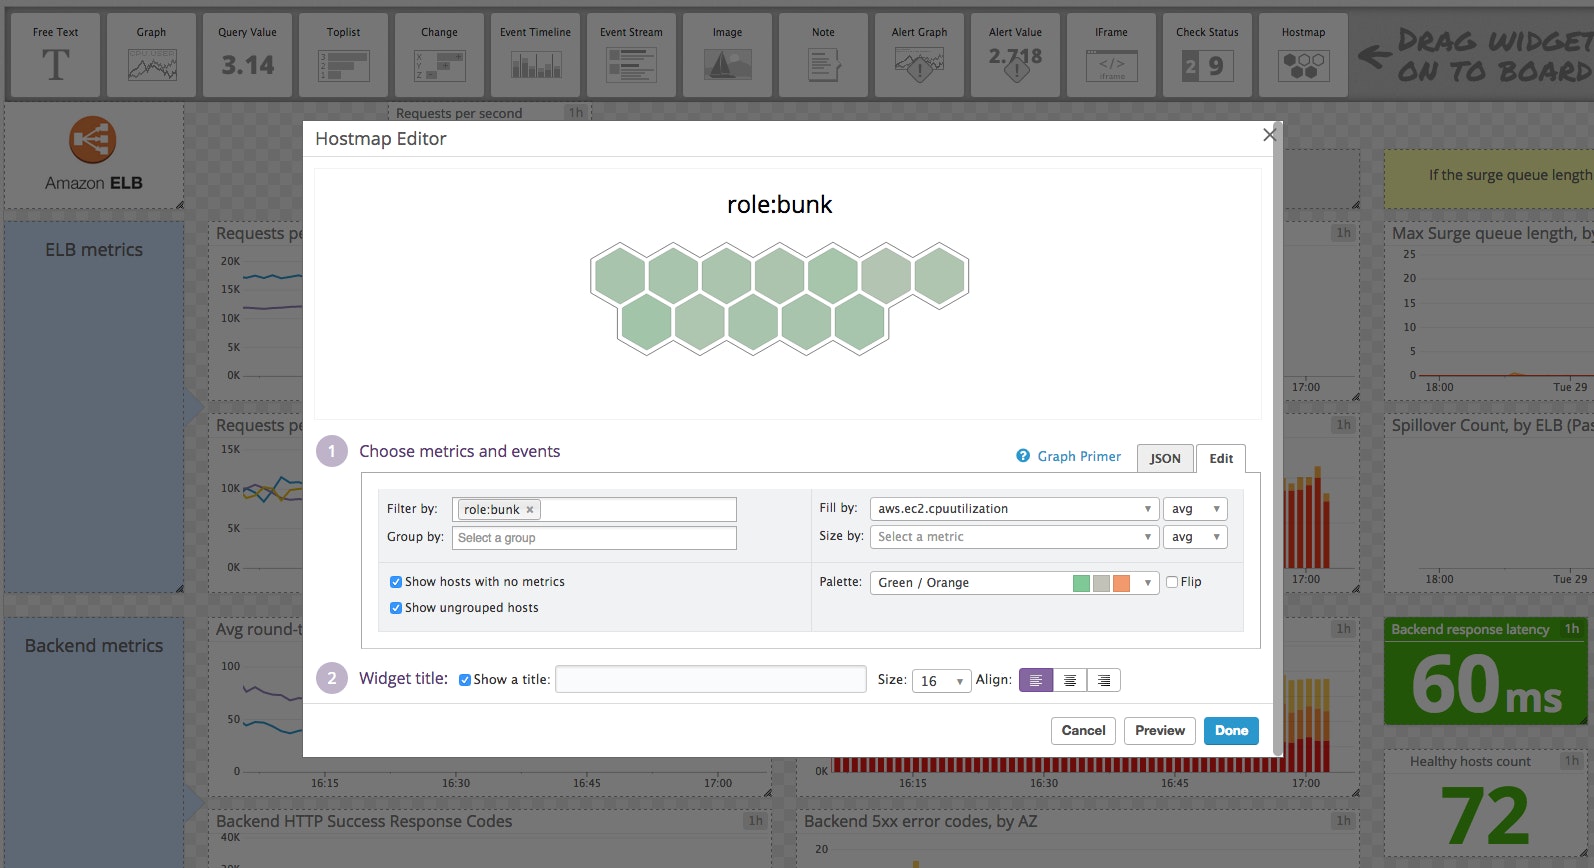
You can also, for example, display a host map to spot at a glance if all your backend instances have a reasonable CPU utilization:

Native metrics for more precision
In addition to pulling in EC2 metrics via CloudWatch, Datadog also allows you to monitor your EC2 instances’ performance with higher resolution by installing the Datadog Agent to pull native metrics directly from the servers. The Agent is open source software that collects and reports metrics from your individual hosts so you can view, monitor and correlate them on the Datadog platform. Installing the Agent usually requires just a single command. Installation instructions for different operating systems are available here.
By using the Datadog Agent, you can collect backend instance metrics with a higher granularity for a better view of their health and performance. The Agent reports metrics directly, at rapid intervals, and does not rely on polling an intermediary (such as CloudWatch), so you can access metrics more frequently without being limited by the provider’s monitoring API.
The Agent provides higher-resolution views of all key system metrics, such as CPU utilization or memory consumption by process.
Once you have set up the Agent, correlating native metrics from your EC2 instances with ELB’s CloudWatch metrics is a piece of cake (as explained above), and will give you a full and precise picture of your infrastructure’s performance.
The Agent can also collect application metrics so that you can correlate your application’s performance with the host-level metrics from your compute layer. The Agent integrates seamlessly with applications such as MySQL, NGINX, Cassandra, and many more. It can also collect custom application metrics as well.
To install the Datadog Agent, follow the instructions here depending on the OS your EC2 machines are running.
Conclusion
In this post we’ve walked you through integrating Elastic Load Balancing with Datadog so you can visualize and alert on its key metrics. You can also visualize EC2 metrics to keep tab on your backend instances, to improve performance, and to save costs.
Monitoring ELB with Datadog gives you critical visibility into what’s happening with your load balancers and applications. You can easily create automated alerts on any metric across any group of instances, with triggers tailored precisely to your infrastructure and usage patterns.
If you don’t yet have a Datadog account, you can sign up for a free trial and start monitoring your cloud infrastructure, applications, and services.
Source Markdown for this post is available on GitHub. Questions, corrections, additions, etc.? Please let us know.


